


The Ethereum (ETH) price reached a new yearly high on July 14. However, it fell almost immediately afterward, putting the entire previous upward movement at risk.
The ETH price now trades below a critical confluence of resistance levels, the reaction to which can determine the future trend’s direction.
Ethereum Price Fails to Sustain Breakout
The daily time frame technical analysis for Ethereum is mixed. This is because of both indicator readings and the price action.
The Ethereum price broke out from a descending resistance line on June 21. Afterward, it reached a high of $2,029 on July 14. The high seemingly caused a breakout from the $1,940 resistance area. This is a crucial resistance since it is both a horizontal resistance area and the 0.618 Fib retracement resistance level.
Read More: Ethereum (ETH) price prediction
So, due to the breakout from the line and the resistance area, it seemed that the ETH price had begun a bullish trend reversal that would take it to new highs.
However, ETH fell below the $1,940 area shortly afterward, rendering the previous breakout as invalid (green circle). So, the $1,940 area is expected to act as resistance again.
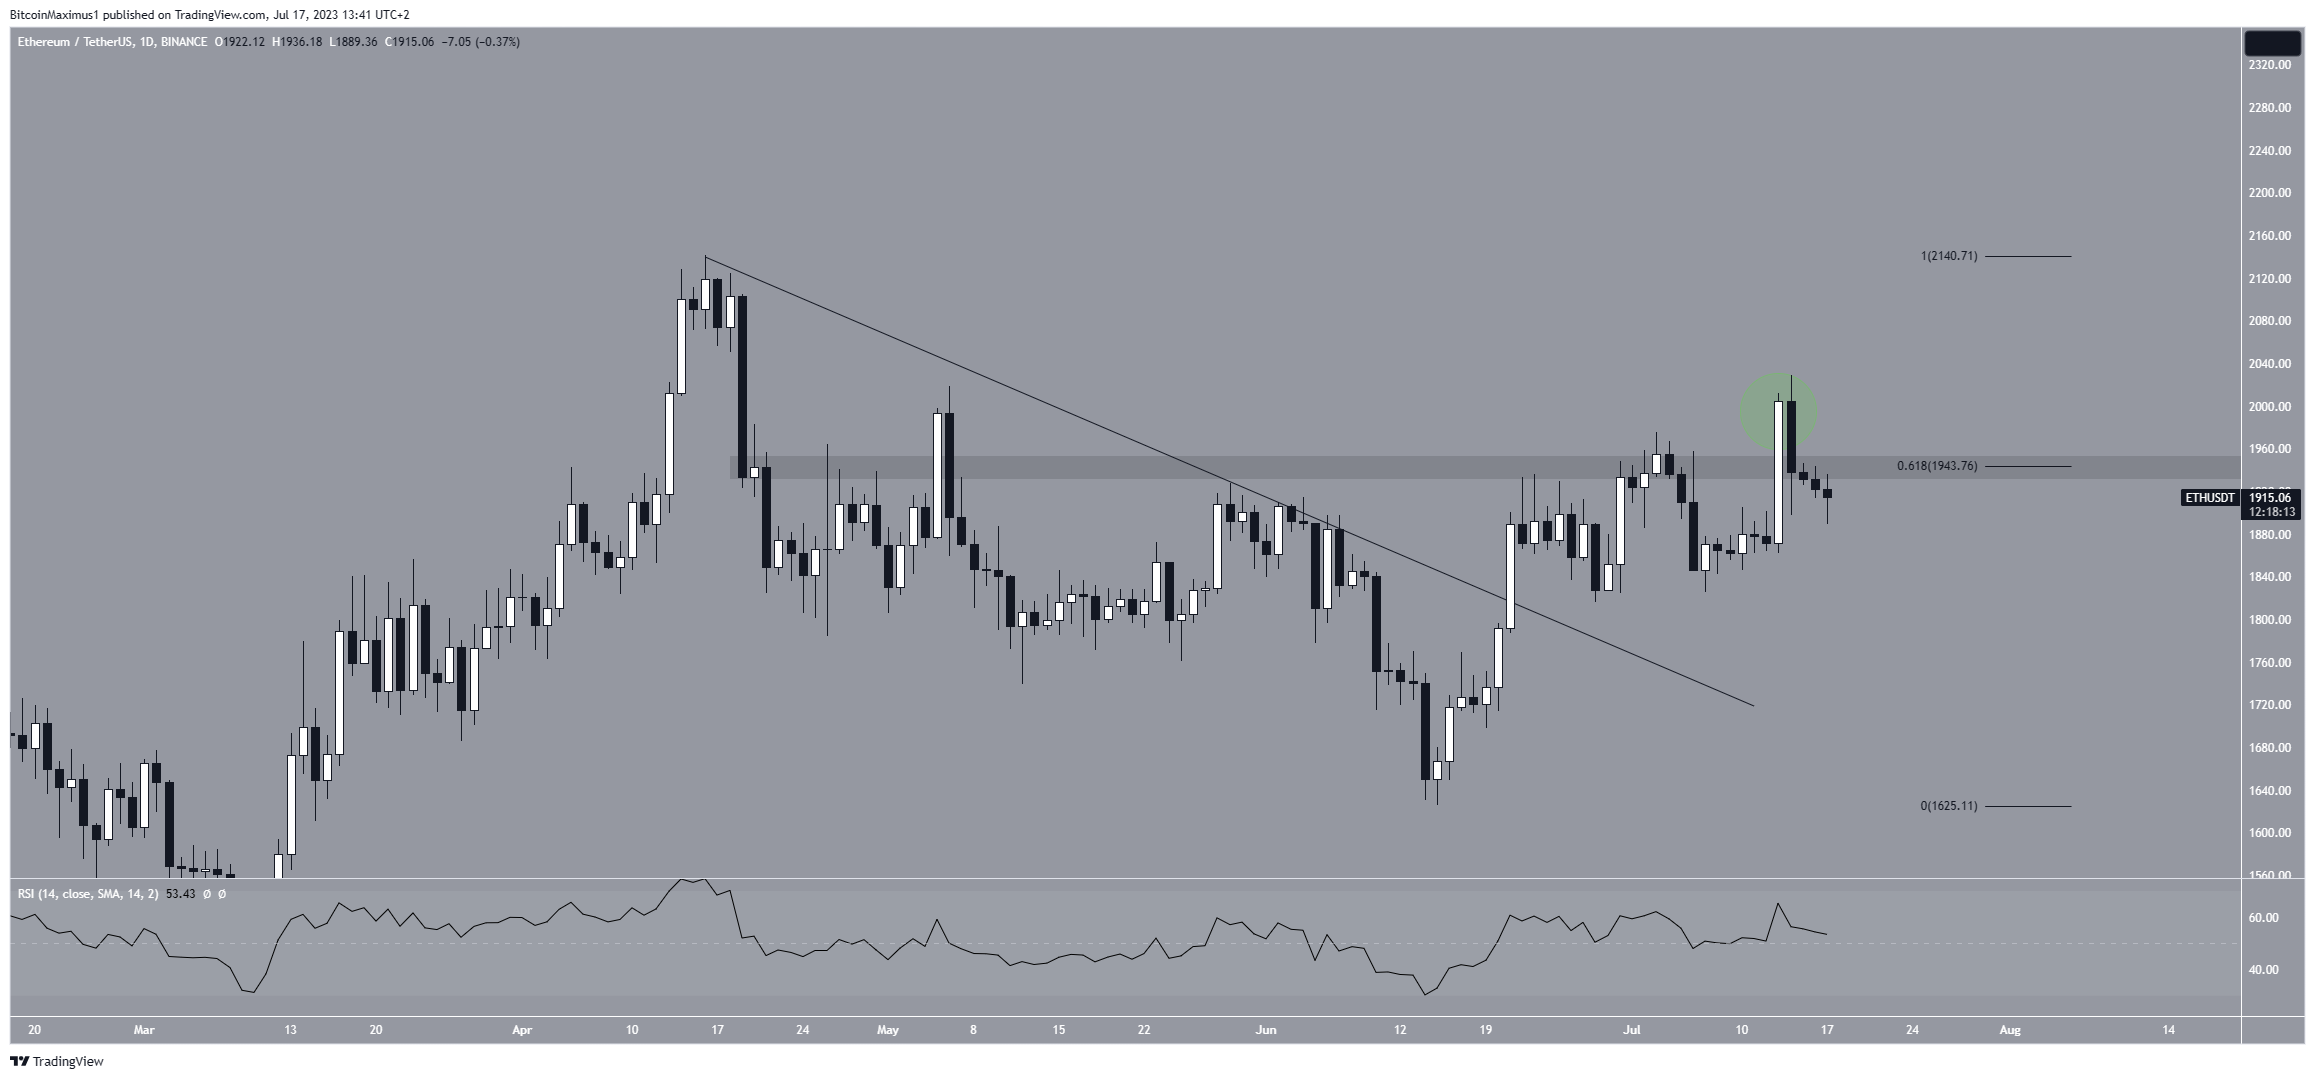
The technical indicators are inconclusive. The daily Relative Strength Index (RSI), which traders rely on to evaluate market conditions, provides an ambiguous result.
When the RSI value is above 50 and shows an upward trend, it indicates a positive situation for bullish investors. Conversely, a value below 50 implies the opposite.
Although the RSI is currently declining, it remains above 50, indicating that the direction of the trend is uncertain.
ETH Price Prediction: Is the Correction Complete?
The technical analysis from the shorter-term six-hour time frame also provides conflicting readings. This is because of both the price action and the Elliot Wave pattern.
The wave count suggests that the ETH price completed a five-wave upward movement between June 15 and July 3. Since then, it has been corrected inside an A-B-C structure (black).
The fact that the correction has been contained inside an ascending parallel channel makes this possibility likely.
However, whether the correction is complete or the ETH price will complete another low is uncertain.
So far, waves A:C have had an exactly 1:1 ratio. This suggests that the correction is done. However, ETH could fall to the $1,790 support if the price breaks down from the channel, giving waves A:C a 1:1.61 ratio.
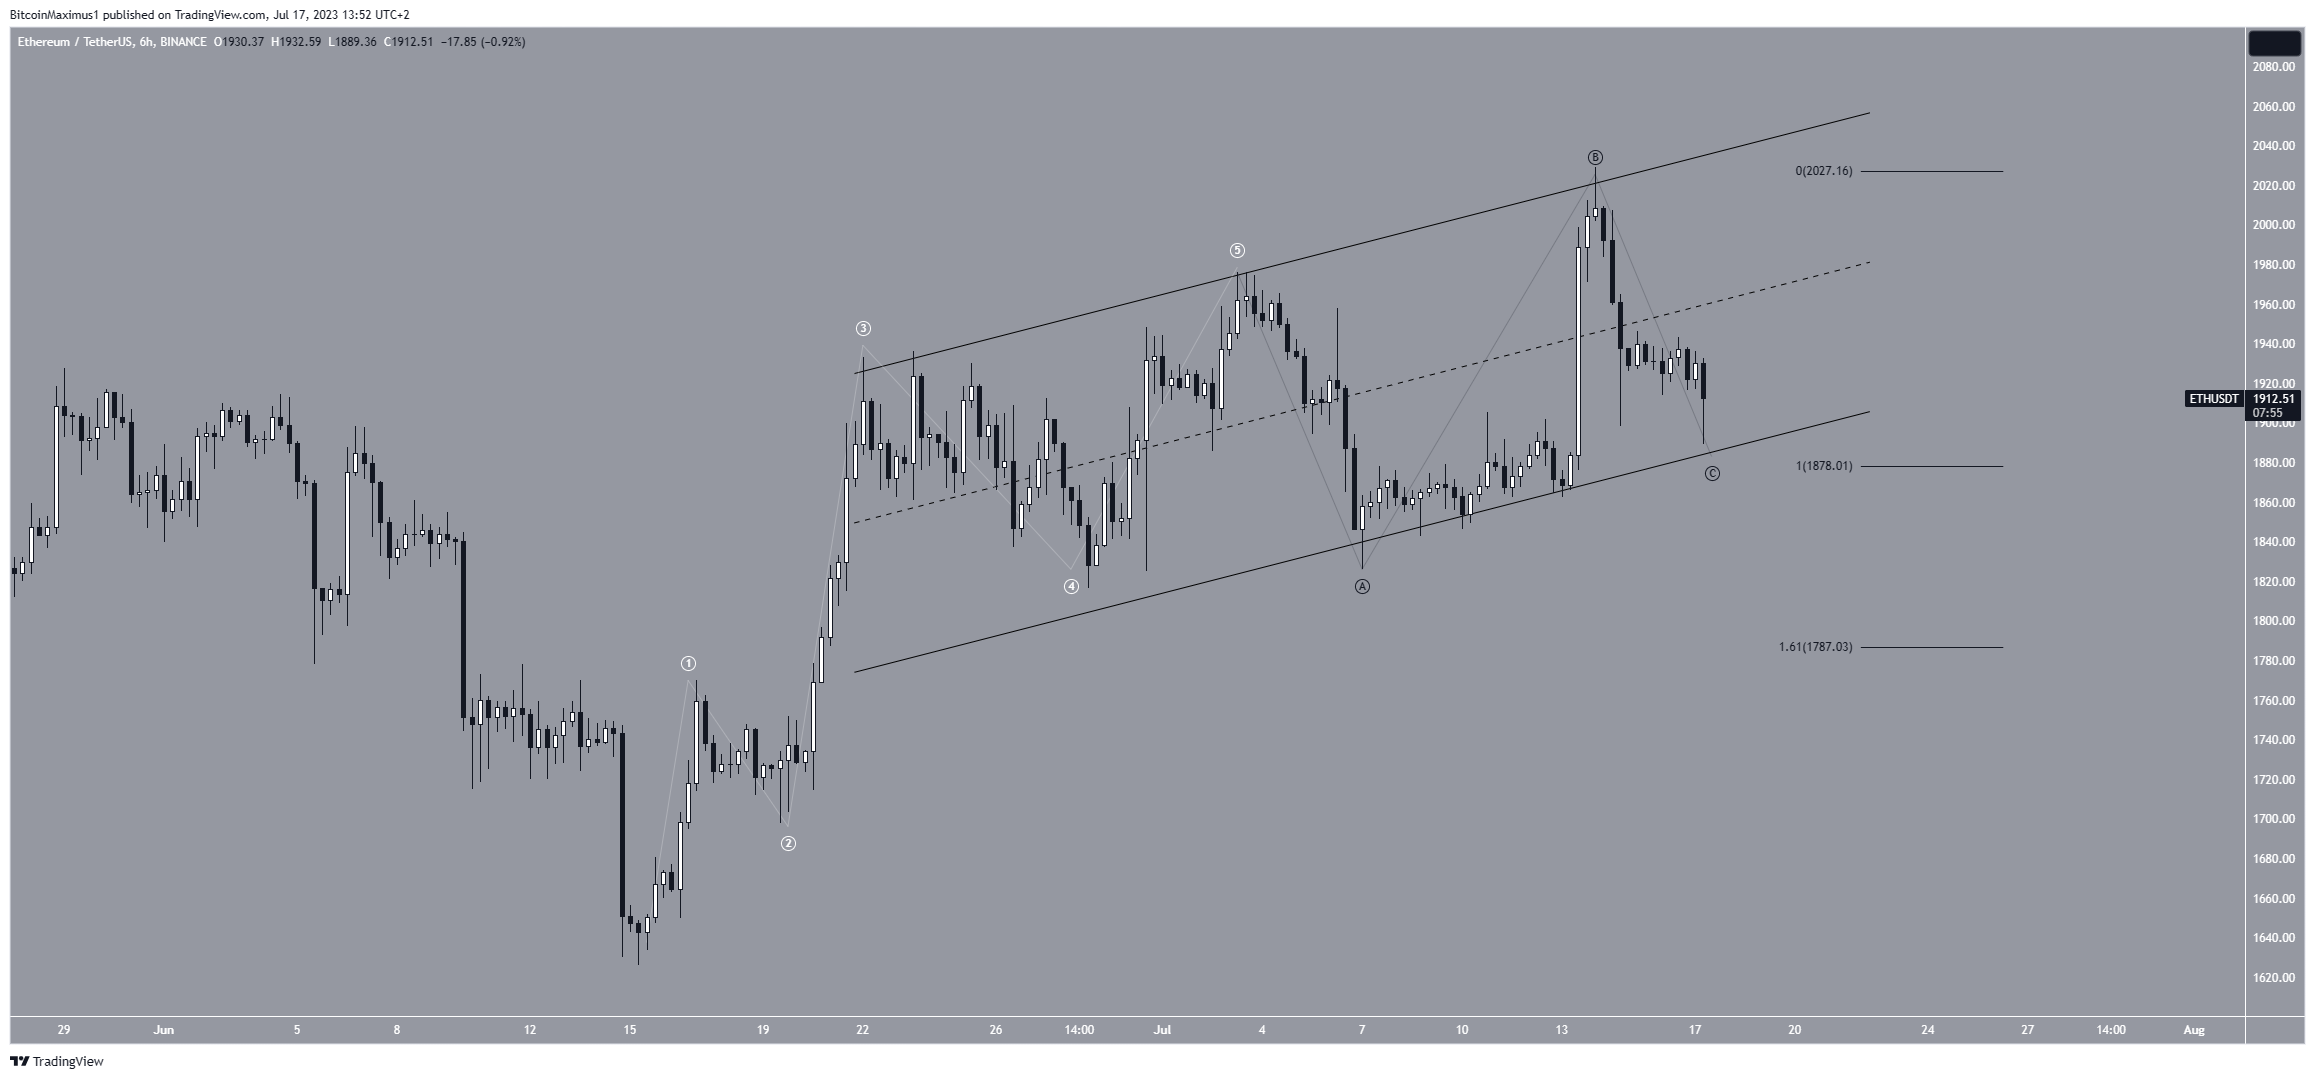
As a result, the future ETH price prediction will be determined by whether the token breaks down from the channel or bounces. In case of a breakdown, ETH could fall to $1,790.
However, if the price bounces, an increase to a new yearly high and the next resistance at $2,500 could occur.
Read More: How To Make Money in a Bear Market


