


The Ethereum (ETH) price has decreased since it deviated above the $1,950 horizontal resistance area in April. This is considered a decisively bearish sign.
While the ETH/USD chart gives a bearish reading, the opposite is true for the ETH/BTC chart. The latter shows a bullish pattern from which a breakout could transpire.
Ethereum Price Falls After Deviation
The technical analysis of the weekly time frame gives a mostly bearish reading. The main reason for this is the deviation (red circle) and decrease below the $1,950 resistance area. This is a bearish development that often leads to significant downward movements.
It means that buyers were unable to sustain the increase and that the breakout above $1,950 was illegitimate.
Step into the future of crypto with price predictions:
The price confirmed this bearish movement by validating the $1,950 area as resistance in the beginning of July (red icon).
If the decrease continues, there is a long-term ascending support line at $1,450. The line has been in place since June 2022. A drop towards it will amount to a decrease of 20%.
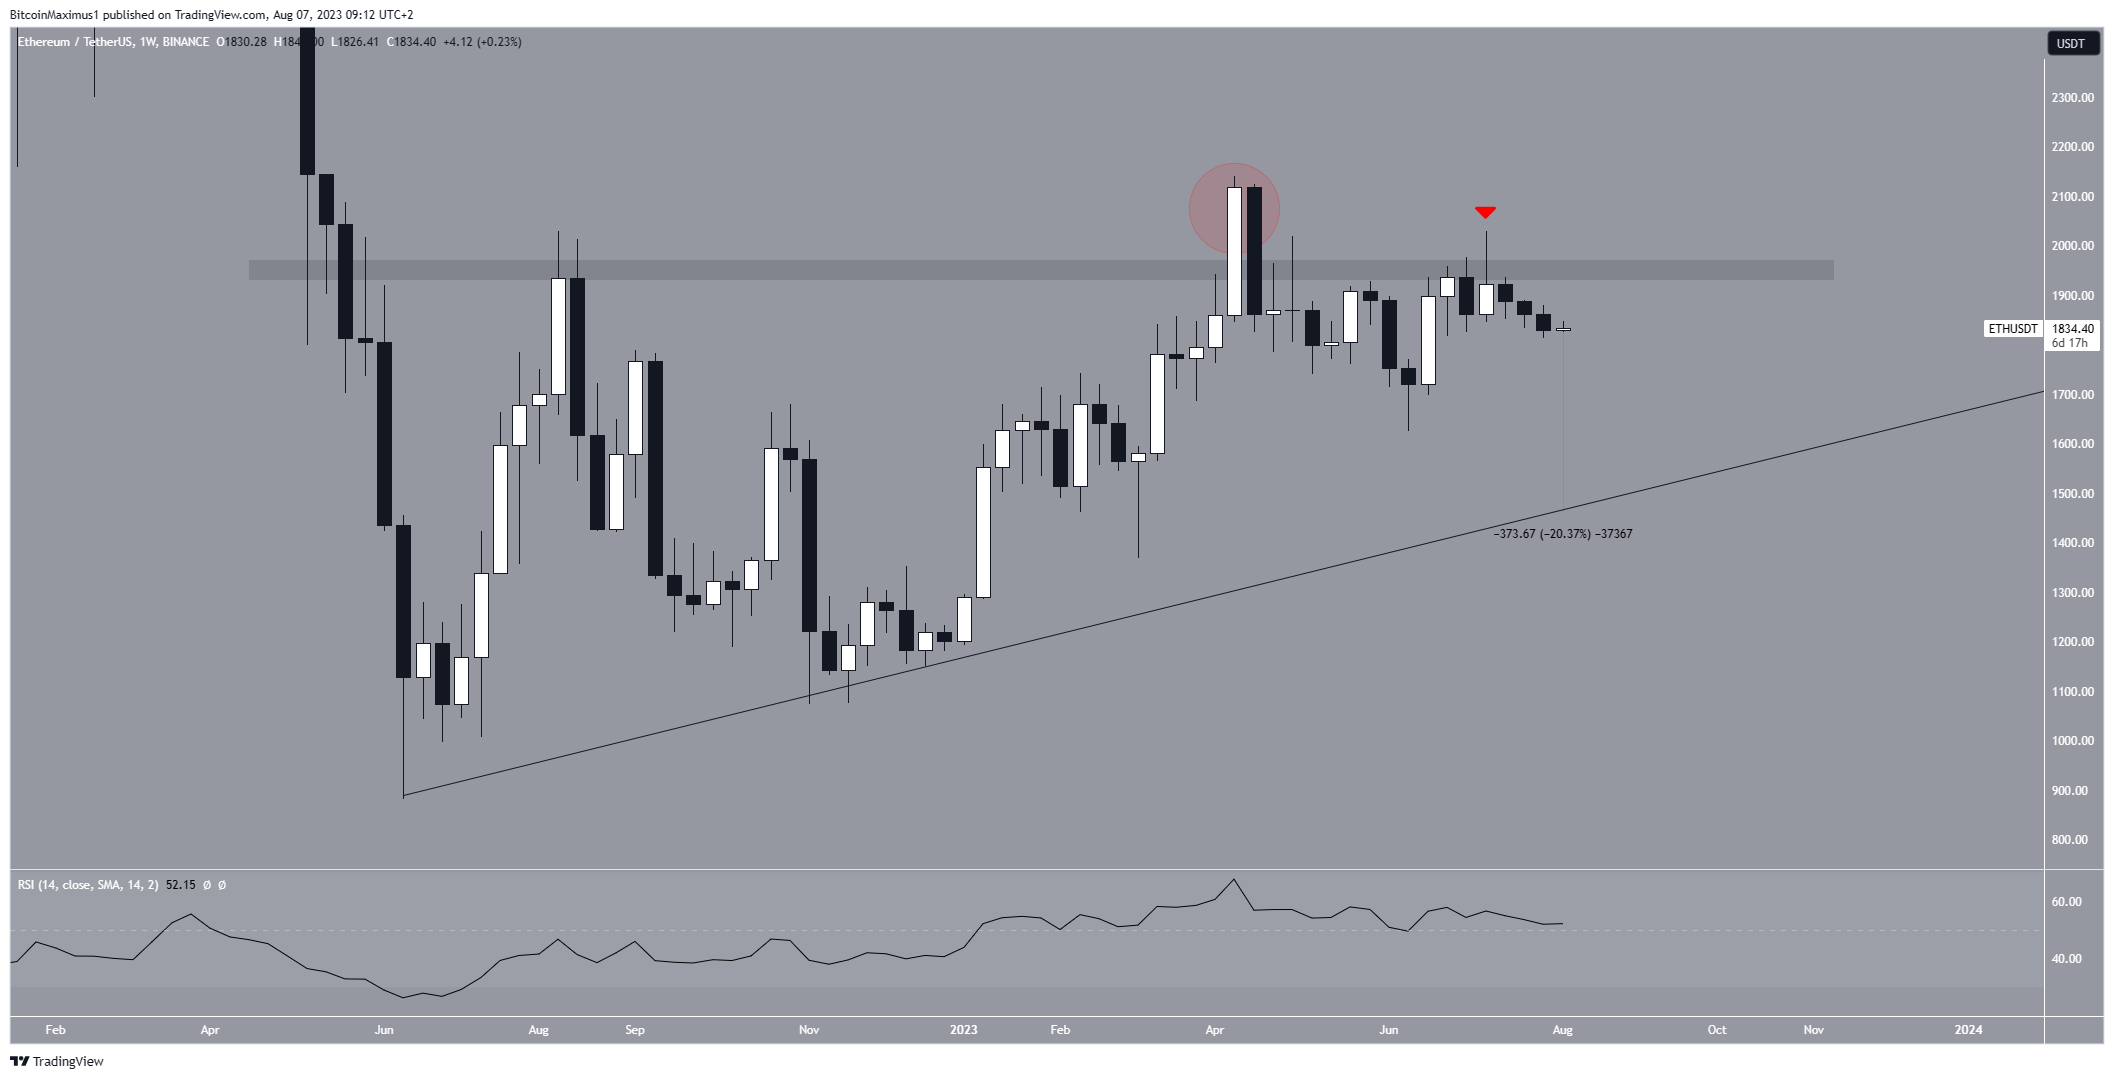
While the price action looks bearish, the weekly RSI is leaning bullish. The RSI is a momentum indicator used to determine overbought or oversold conditions in the market. Traders use it to determine if they should accumulate or start selling an asset.
An upward trend and a reading above 50 suggest that bulls still have strength on their side while the opposite is true for readings below 50.
The RSI hovering slightly above 50 but is not moving decisively in either direction. While this is a sign of a neutral trend, the fact that the indicator is above 50 is bullish.
Furthermore, it’s noteworthy to highlight that an ETH whale transferred $74 million into Coinbase over the past two weeks. This has compounded bearish concerns among Ethereum investors.
ETH Price Prediction: Will Price Outperform Bitcoin?
While the ETH/USD chart is leaning on bearish, the ETH/BTC one gives a mostly bullish outlook. There are three main reasons for this:
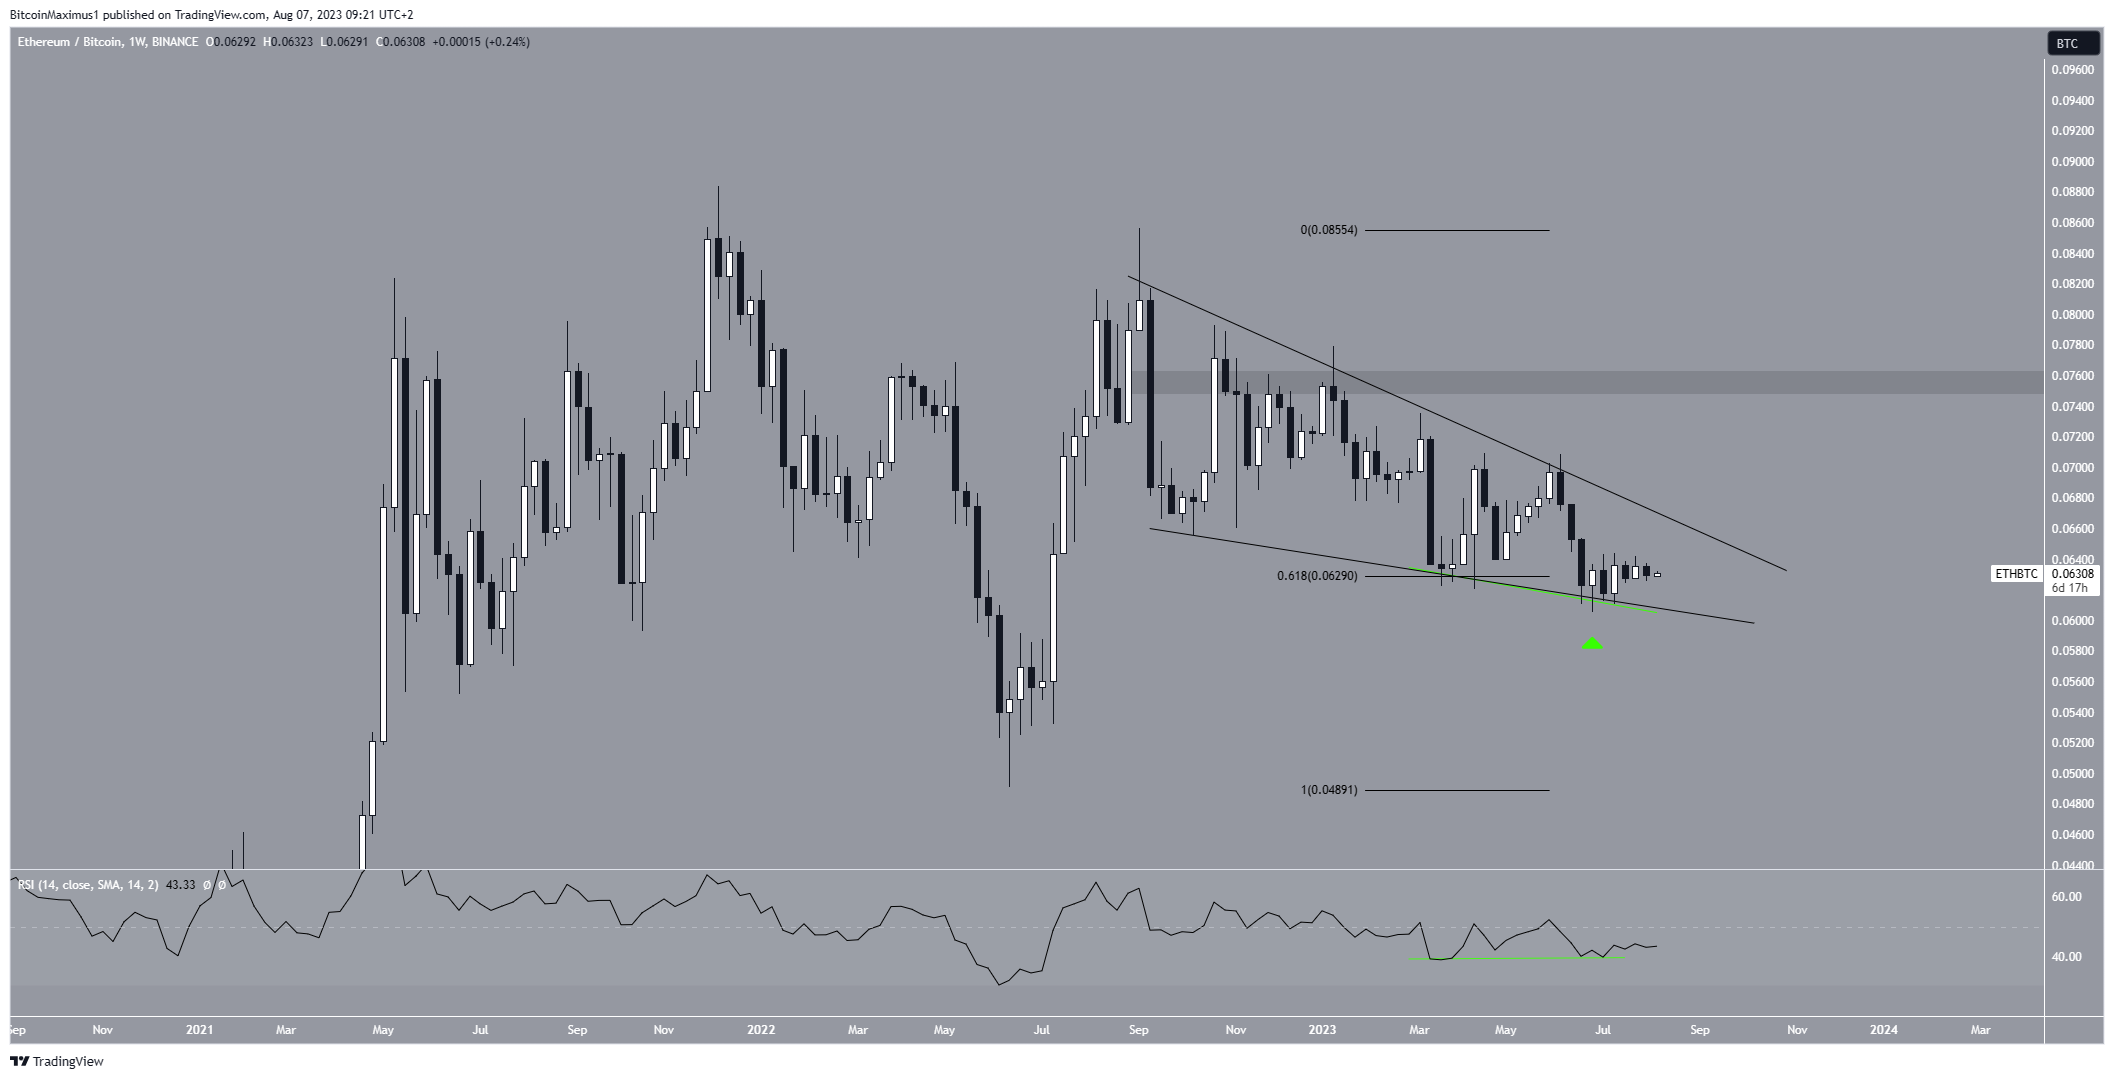
Firstly, the price has traded inside a descending wedge since September 2022. The descending wedge is considered a bullish pattern, meaning that it leads to breakouts most of the time.
Secondly, the price reclaimed the 0.618 Fib retracement support level after previously falling below it. The reclaim coincided with a bounce at the wedge’s support line (green icon). Similarly to how the deviation above the resistance area is considered bearish, the deviation below the Fib level is considered bullish.
Finally, the weekly RSI has generated bullish divergence (green line). This is a type of occurrence in which a momentum increase accompanied a price decrease. It is a bullish sign that means the decrease was not legitimate and it often leads to upward movements.
An increase to ₿0.076 will be likely if ETH breaks out. This would be an upward movement of 20%.
Therefore, the ETH/USD price prediction is bearish while ETH/BTC is bullish. Reclaiming the $1,950 resistance area will make the former bullish and could lead to an increase towards $2,300.
On the other hand, a close below the wedge’s support line will make the latter bearish and could lead to a price drop to ₿0.050.
Read More: How To Make Money in a Bear Market


