


The Ethereum (ETH) price has fallen since it moved above the $1,950 area in April and then fell below it, validating it as resistance three months later.
Even though the readings from the weekly timeframe are bearish, news regarding the Ethereum blockchain is overwhelmingly positive.
Ethereum Price Falls After Failure to Break Out
The weekly time frame technical analysis gives a mostly bearish reading. The main reason for this is the failed breakout above the $1,950 area and subsequent validation of the area as resistance (red circles).
These are considered decisive bearish signs since buyers could not sustain the momentum after the failed breakout. The ETH price has fallen since the second rejection.
The next closest long-term support is at $1,500, created by an ascending support line that has been in place since May.
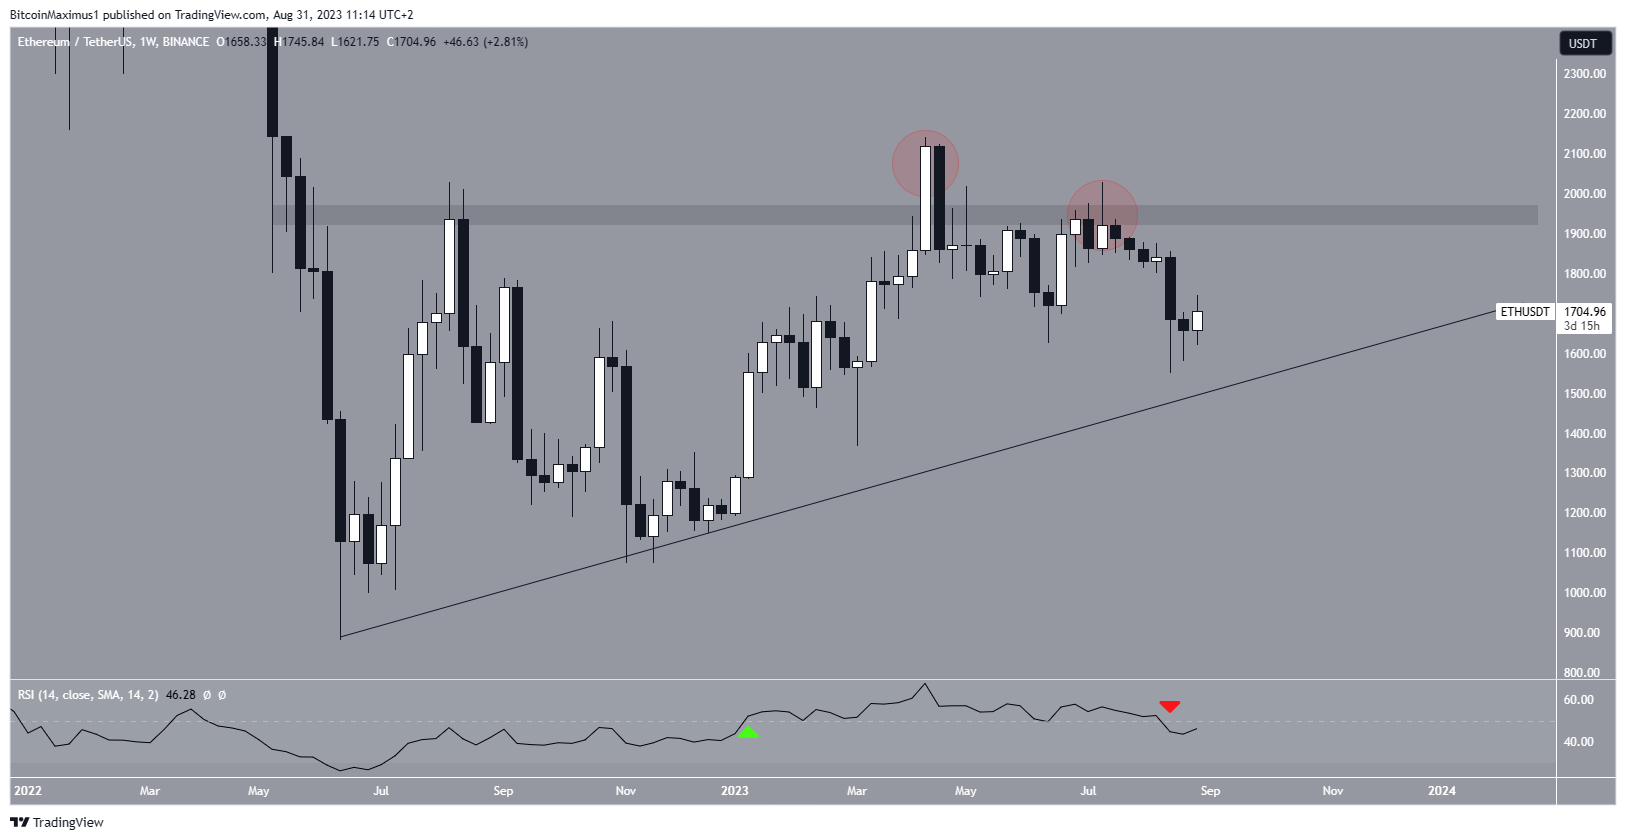
Similarly to the price action, the RSI gives a bearish reading. The RSI is a momentum indicator used by traders to evaluate whether a market is overbought or oversold and to determine whether to accumulate or sell an asset.
Readings above 50 and an upward trend suggest that bulls still have an advantage, while readings below 50 indicate the opposite. The indicator just fell below 50 (red icon). This is the first time it has done so since it moved above 50 in January (green icon). This indicates that the trend is turning bearish, and further decreases could follow.
Despite the bearish technical analysis, news about the Ethereum blockchain is positive. Robinhood is expanding into the Decentralized Finance (DeFi) sector by enabling Ethereum swap features. Robinhood also owns the fifth largest Ethereum wallet in the world, containing 1.49 million ETH tokens. Also, Ethereum staking has surged to 28 million ETH, twice the number of tokens available in exchanges.
This indicates that more long-term holders are staking ETH rather than short-term sellers liquidating their holdings.
Check out the 9 Best AI Crypto Trading Bots to Maximize Your Profits.
ETH Price Prediction: Can Price Reverse the Trend?
Unlike the weekly timeframe, which is bearish, the daily one gives mixed signs. Since the April above high, ETH has fallen inside a descending parallel channel. These channels usually contain corrective movements, meaning that an eventual breakout from it will be the most likely future price scenario.
On August 17, the ETH price bounced at the channel’s support line (green icon) and began the current upward movement. The bounce coincided with an oversold RSI reading (green circle). The daily RSI had not fallen into oversold territory since June 2022. At the time, a 130% increase followed. A similar increase would take the ETH price close to $4,000.
However, a more subdued increase towards the channel’s resistance line would amount to an increase of 14%. On the other hand, a breakdown from the channel could cause an 18% drop and take the price to the $1,400 horizontal support area.
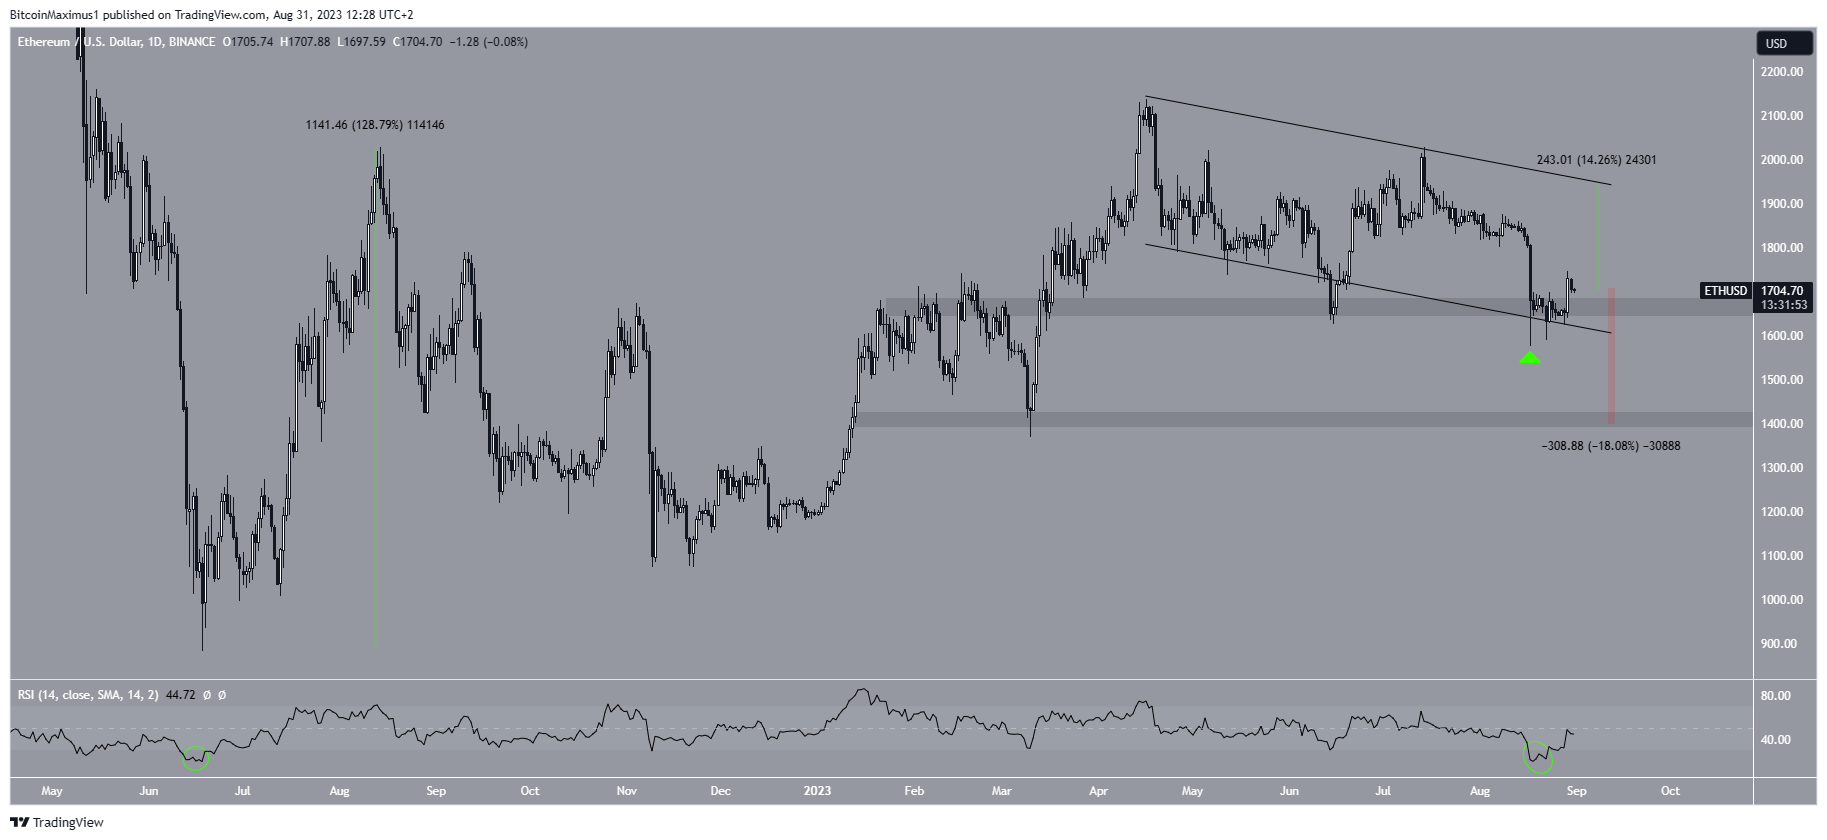
Therefore, the ETH price prediction will determine whether the price breaks down below the channel or continues the bounce at its support line. The former could lead to an 18% drop, while the latter can cause a 14% increase.
Looking to be profitable? Learn How To Make Money in a Bear Market.
For BeInCrypto’s latest crypto market analysis, click here.


