


On June 7, 2019, the Ethereum price (ETH) reached a high of $254. A gradual decrease ensued. On June 10, the price reached a low of $226.01. It has been increasing since.
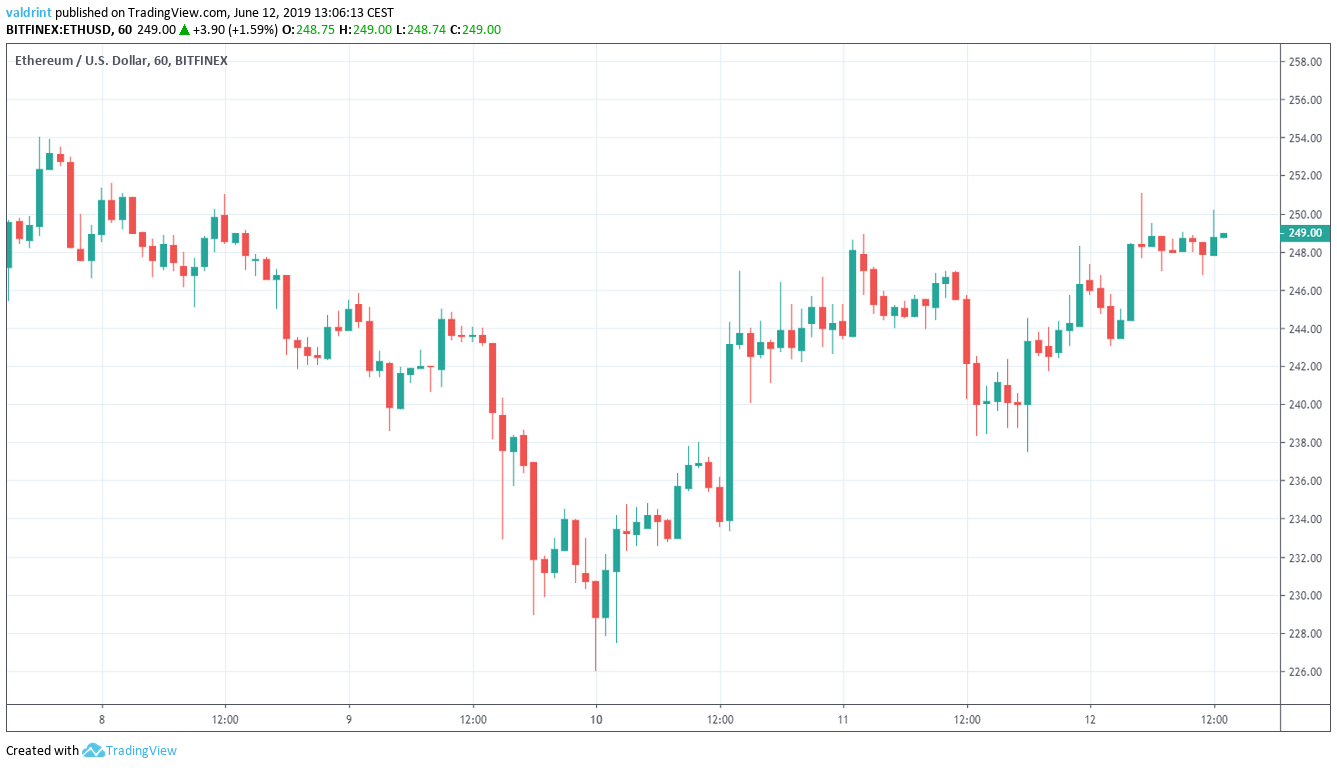
At the time of writing, the ETH price was struggling to break out above $250.
Below, we are going to analyze the Ethereum price (ETH) in different time-frames and alongside technical indicators, in order to try and predict future movement. You can read our previous analysis here.
Ethereum Price (ETH): Trends and Highlights for June 12
- ETH/USD reached a low on June 10
- It is trading inside a short-term ascending wedge.
- It is trading inside a longer-term descending wedge.
- A short-term bearish divergence has developed in the RSI.
- The 10- and 20-day moving averages have made a bearish cross.
- There is resistance near $270.
- There is support near $228.
Current Pattern
On June 9, the price of ETH/USD reached an hourly high of $245.0. A rapid decrease ensued and the ETH price made a low of $226.01 on June 10.
Since then, it has been increasing, creating the ascending wedge outlined below:
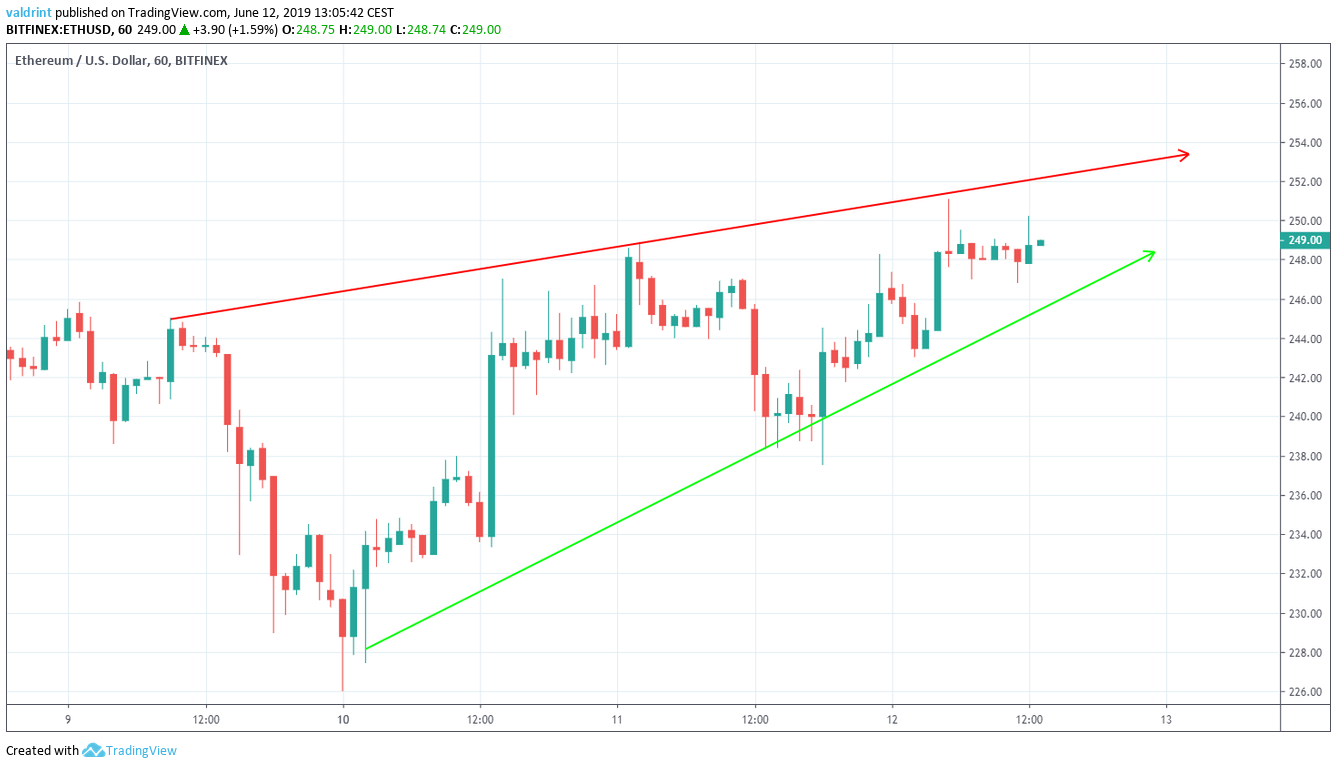
At the time of writing, the ETH price was trading in the middle of the wedge after making several unsuccessful attempts at a breakout.
However, Ethereum is trading inside a longer-term pattern. As is visible in the graph below, ETH has been trading in another descending wedge since May 31.
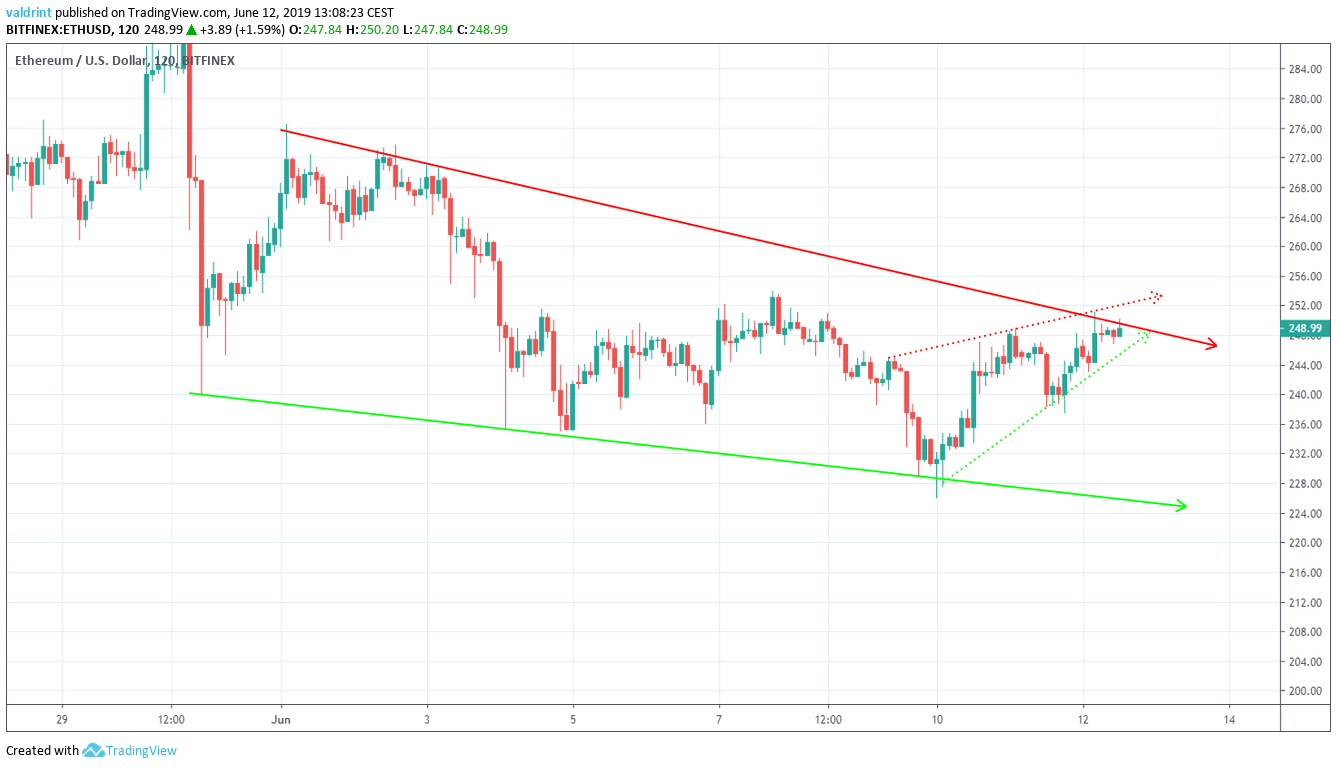
At the time of writing, the ETH price was trading close to the resistance line. On June 12, it made an unsuccessful attempt at a breakout.
Will it be successful in the future? Let’s look at technical indicators and try to answer this question.
Ethereum Price (ETH): RSI and Moving Averages
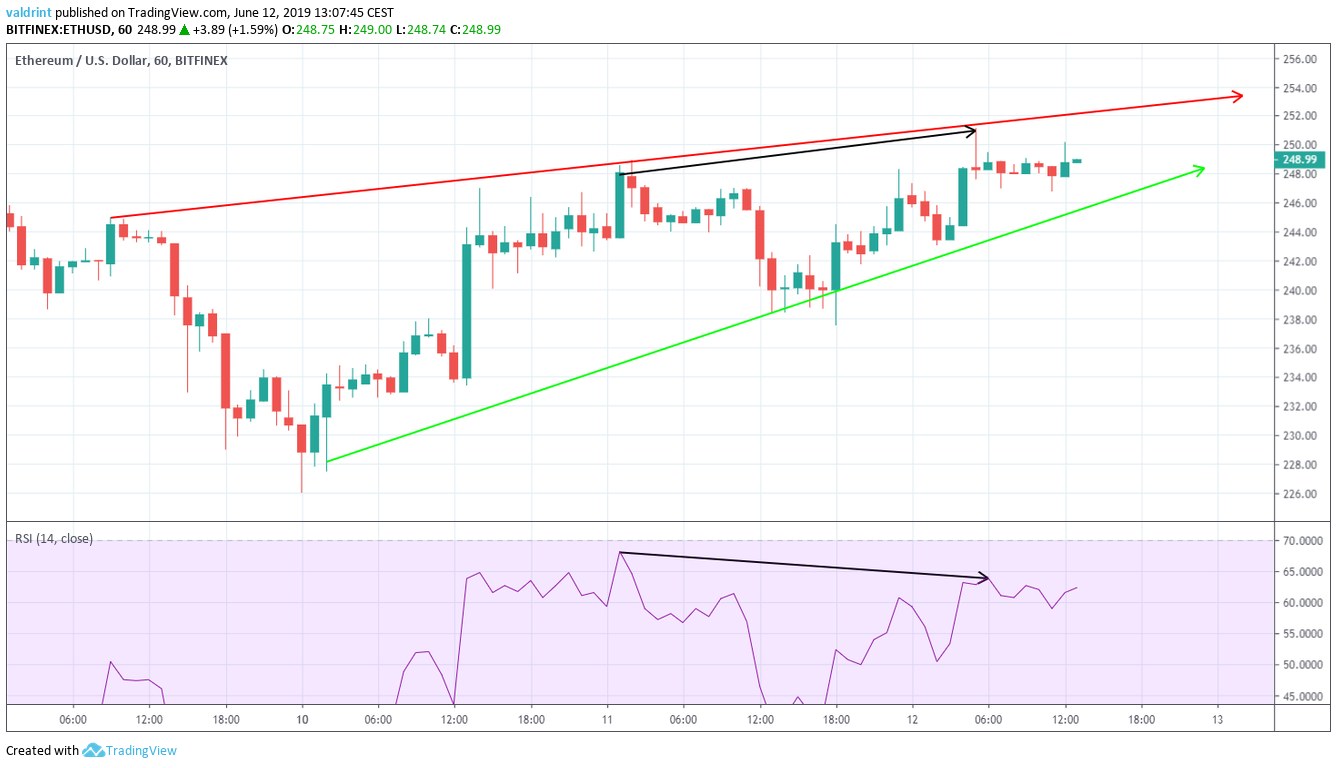
On June 11 and 12, the Ethereum price reached slightly higher highs near $250. During this time, the RSI generated successively lower values. This is known as bearish divergence and often precedes price decreases.
However, it is not very significant in value and is occurring only in short-term time-frames.
The daily moving averages give a bearish outlook.
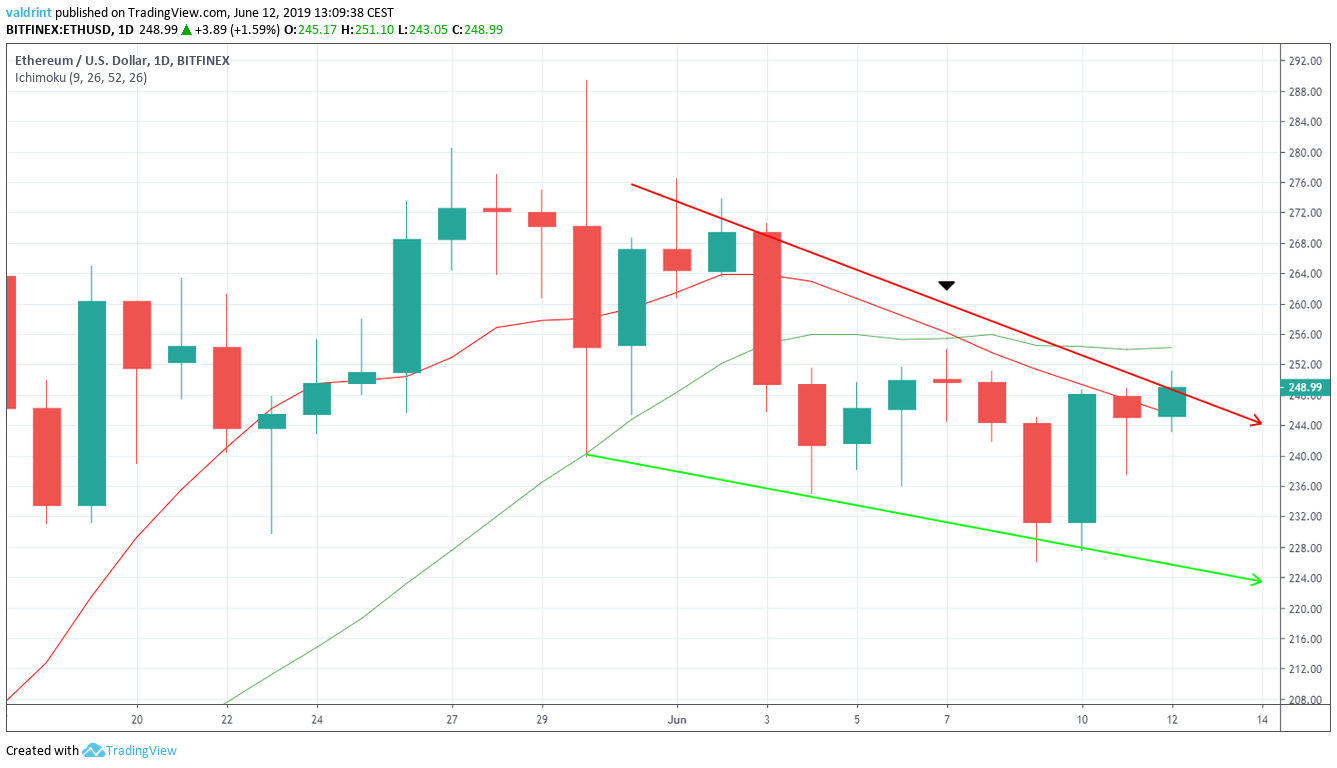
A bearish cross between the 10- and 20- day MAs occurred on June 7. This is often an indication that a downtrend has begun. Since then, the ETH price has failed to move past any of the MAs. At the time of writing, current prices are above the 10-day MA. However, we have not yet had a close above it.
The use of these indicators makes it likely that the Ethereum price (ETH) is in a downtrend. While breakouts are still possible, they would be short-term increases inside a long-term downtrend.
Ethereum Price (ETH): Reversal Areas
One resistance and one support area are traced for ETH/USD below:
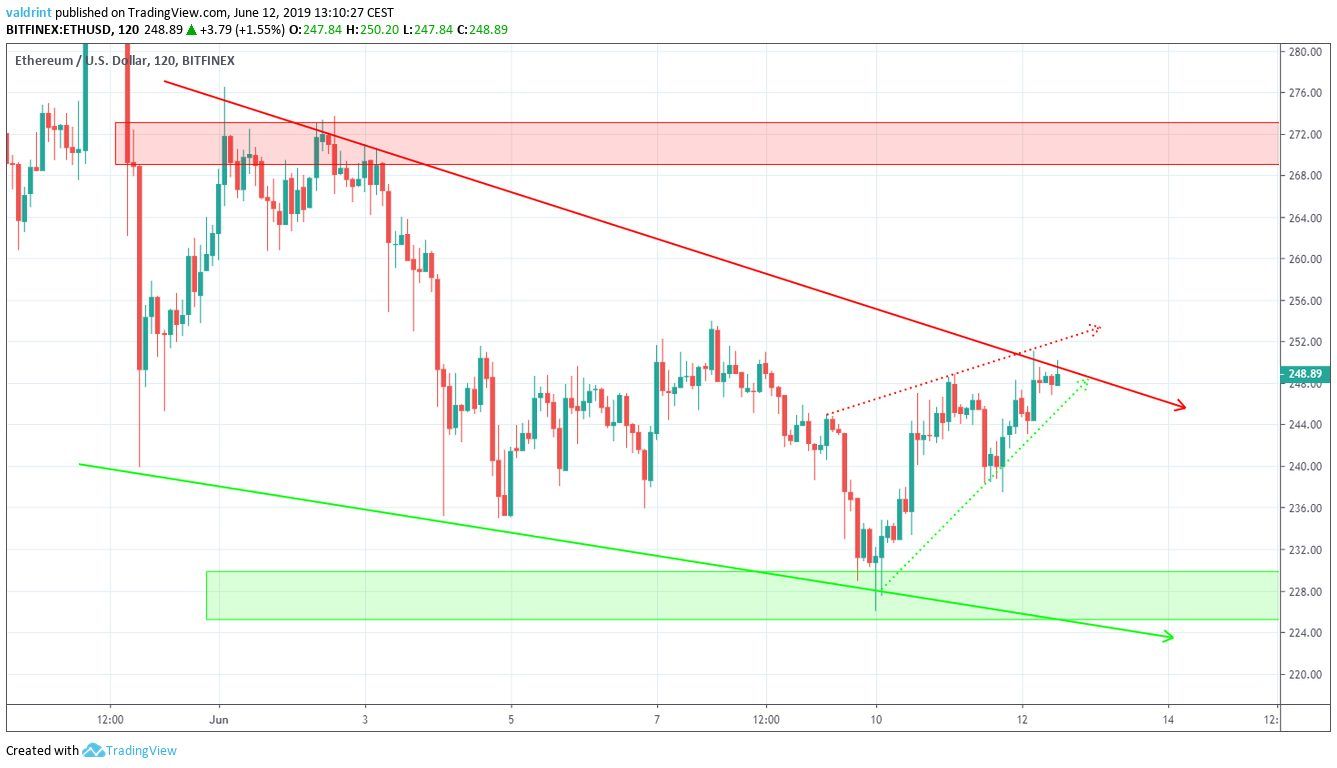
The closest resistance area is found near $272. If the Ethereum price (ETH) breaks out from the wedge, it is likely to reach this area.
The closest support area is found near $228. It coincides with the support line of the long-term wedge. If the price breaks down from the short-term ascending wedge, it is likely to reach this area. An analysis of technical indicators supports this possibility.
Summary
To conclude, the price of Ethereum (ETH) is trading inside a short-term ascending wedge. It is also trading inside a longer-term descending wedge. The technical indicators give a bearish outlook in the long-term.
Do you think the Ethereum price (ETH) will break down from the wedge? Let us know your thoughts in the comments below!



