

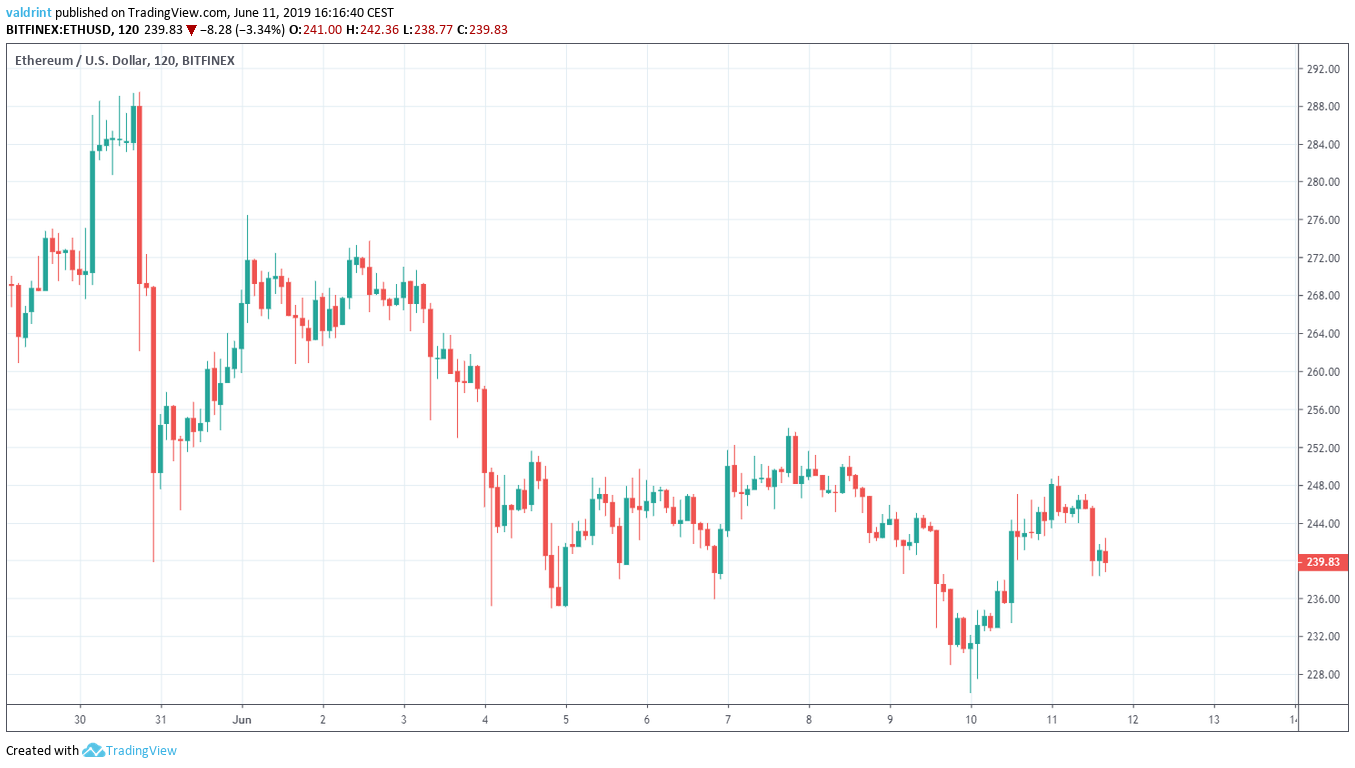
On May 30, 2019, the Ethereum price (ETH) reached a high of $289.42. A rapid decrease ensued. After a weak upward move, the price continued its downtrend, eventually reaching a low of $226.01 on June 10.

Below, we are going to analyze the Ethereum price (ETH) in different time-frames and alongside technical indicators, in order to try and predict future movement. You can read our previous analysis here.
Ethereum Price (ETH): Trends and Highlights for June 11
- ETH/USD reached a high on May 30.
- It broke out from a short-term descending wedge.
- It is trading inside a longer-term descending wedge.
- The 10- and 20-day moving averages have made a bearish cross.
- Long-term bearish divergence has developed in the RSI.
- There is resistance near $270.
- There is support near $200.
Descending Wedge
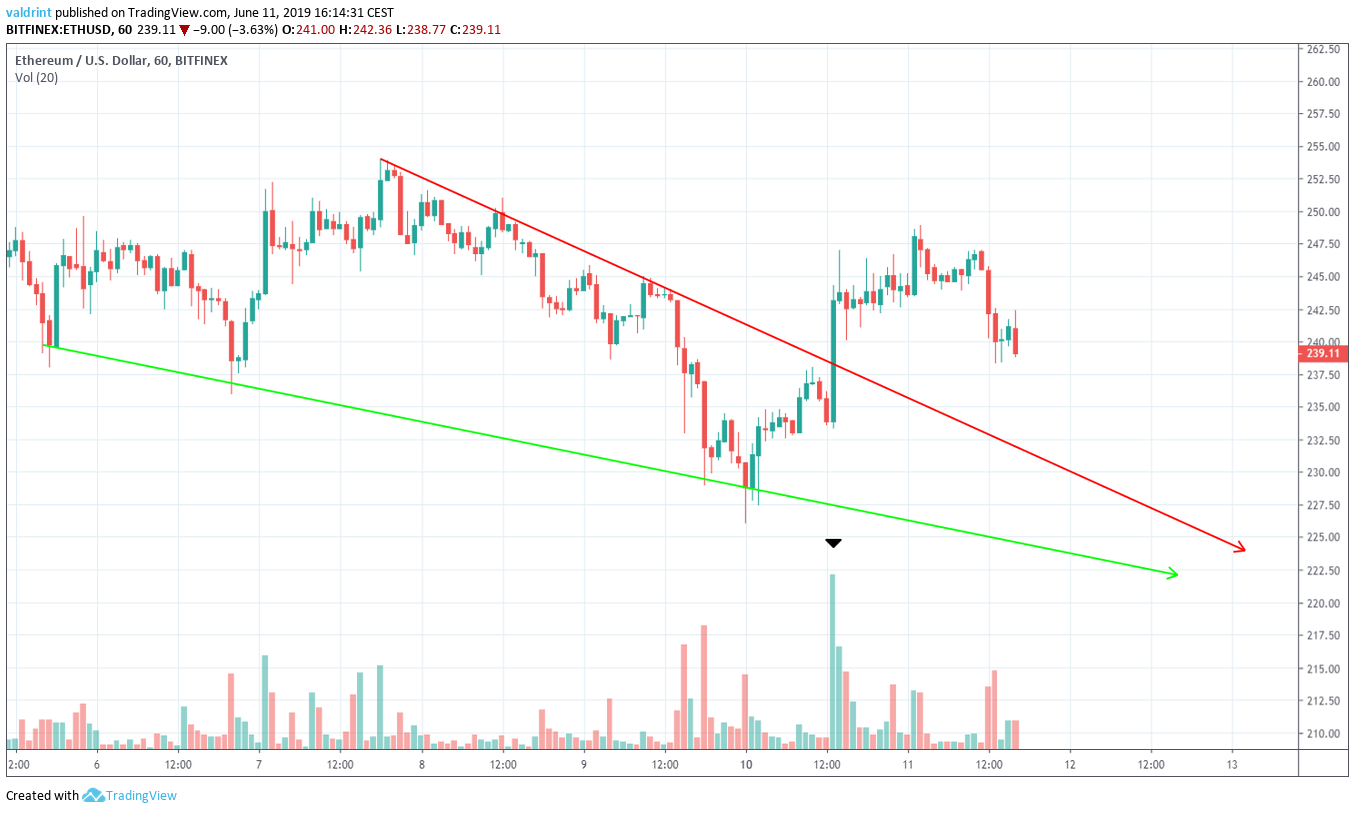
The Ethereum price (ETH) is analyzed at one-hour intervals from June 5 to June 11 in order to analyze its current pattern.
On June 5, ETH/USD reached a low of $238.05 A gradual upward move ensued and ETH’s price reached a high of $253.93 on June 7. Since then, it has been decreasing, creating the descending wedge outlined below:
Ethereum Price (ETH): RSI and Moving Averages
The price of ETH is analyzed at daily intervals alongside the RSI (First graph) and the 10- and 20-period moving averages (MA) (Second graph) below:
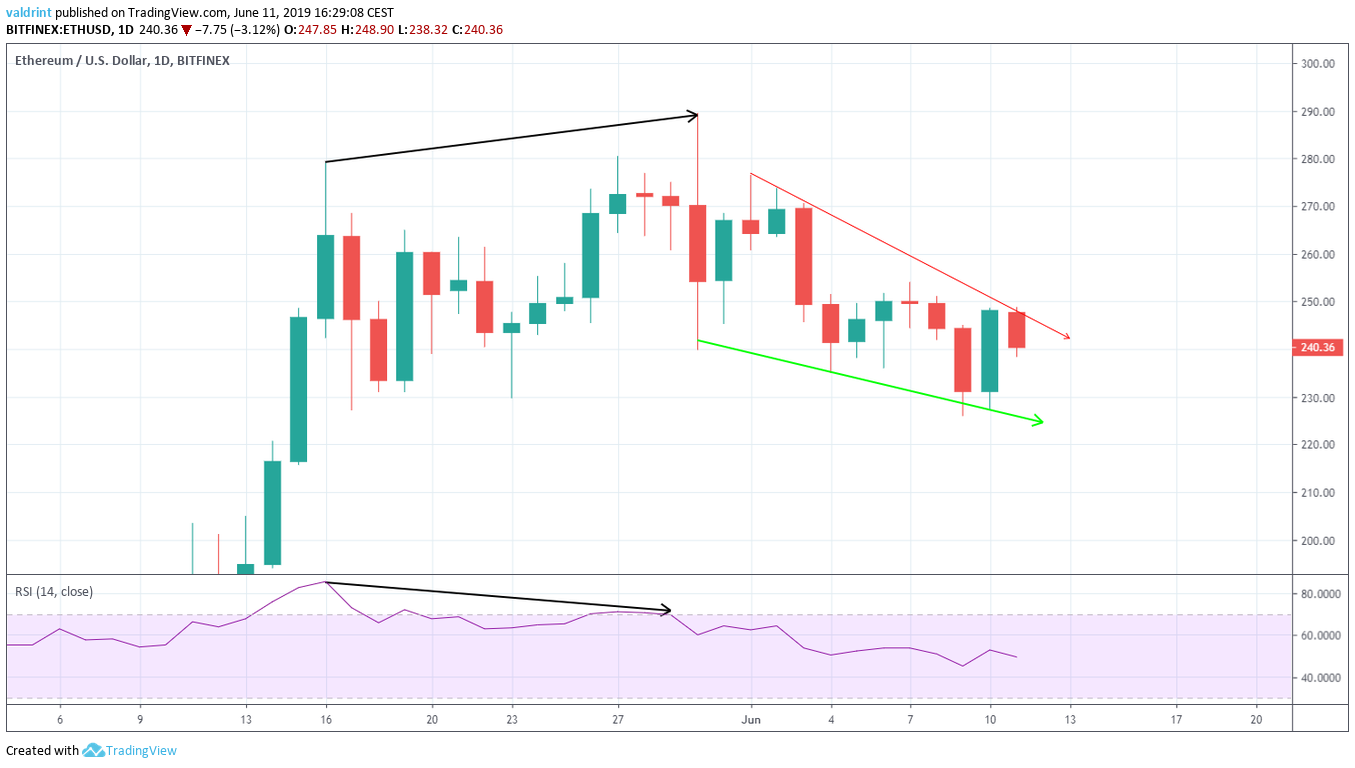 During the highs of May 16 and 30, the RSI generated lower highs. This is known as bearish divergence and often precedes price decreases.
In the case of ETH, a decrease followed shortly after, which began the creation of the descending wedge. This is a bullish pattern, somewhat reducing the significance of the divergence.
However, the moving averages give a similar bearish outlook.
During the highs of May 16 and 30, the RSI generated lower highs. This is known as bearish divergence and often precedes price decreases.
In the case of ETH, a decrease followed shortly after, which began the creation of the descending wedge. This is a bullish pattern, somewhat reducing the significance of the divergence.
However, the moving averages give a similar bearish outlook.
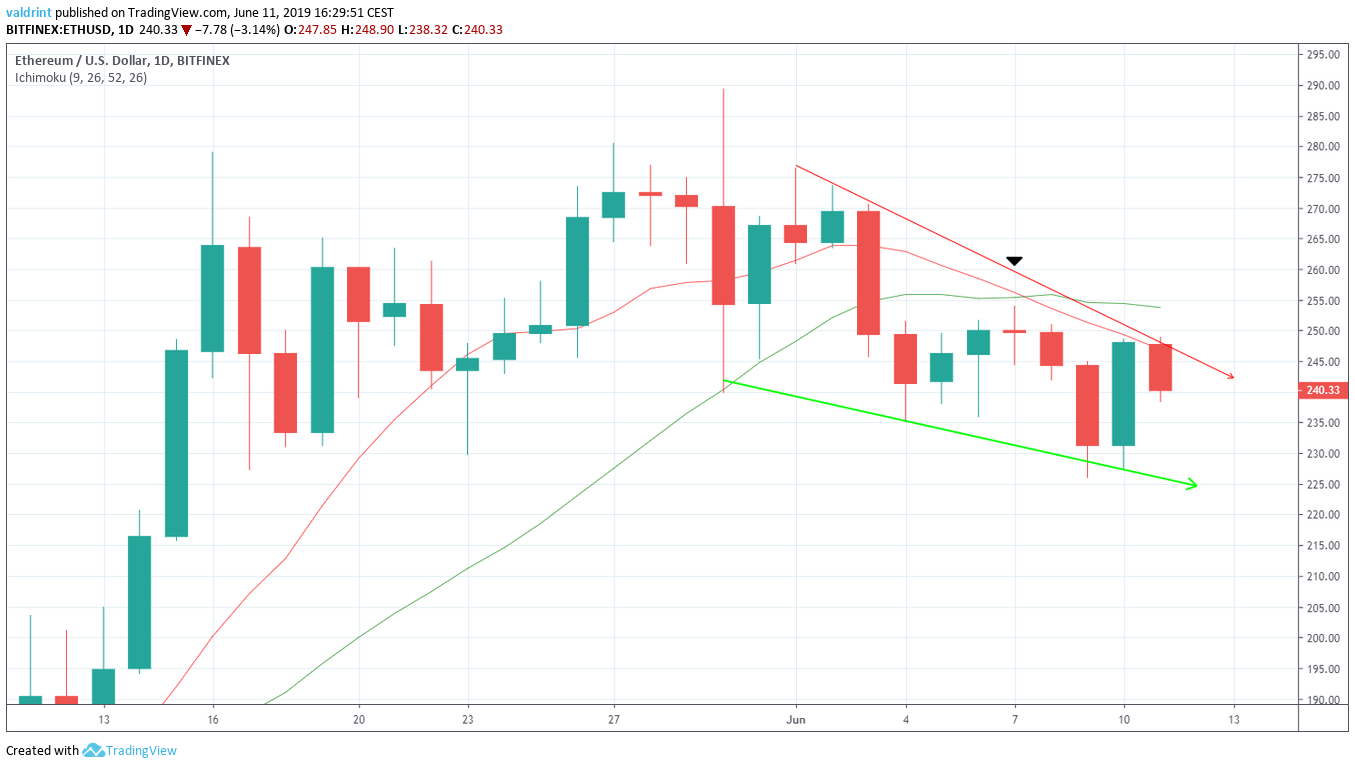 A bearish cross between the 10- and 20- day MAs also occurred on June 7. This is often an indication that a downtrend has begun. Since then, the price has failed to move past any of the MAs.
The use of these indicators makes it likely that the Ethereum price (ETH) will continue to decrease at the rate predicted by the wedge and possibly break down.
If a breakdown occurs, where will the price find support?
A bearish cross between the 10- and 20- day MAs also occurred on June 7. This is often an indication that a downtrend has begun. Since then, the price has failed to move past any of the MAs.
The use of these indicators makes it likely that the Ethereum price (ETH) will continue to decrease at the rate predicted by the wedge and possibly break down.
If a breakdown occurs, where will the price find support?
Ethereum Price (ETH): Reversal Areas
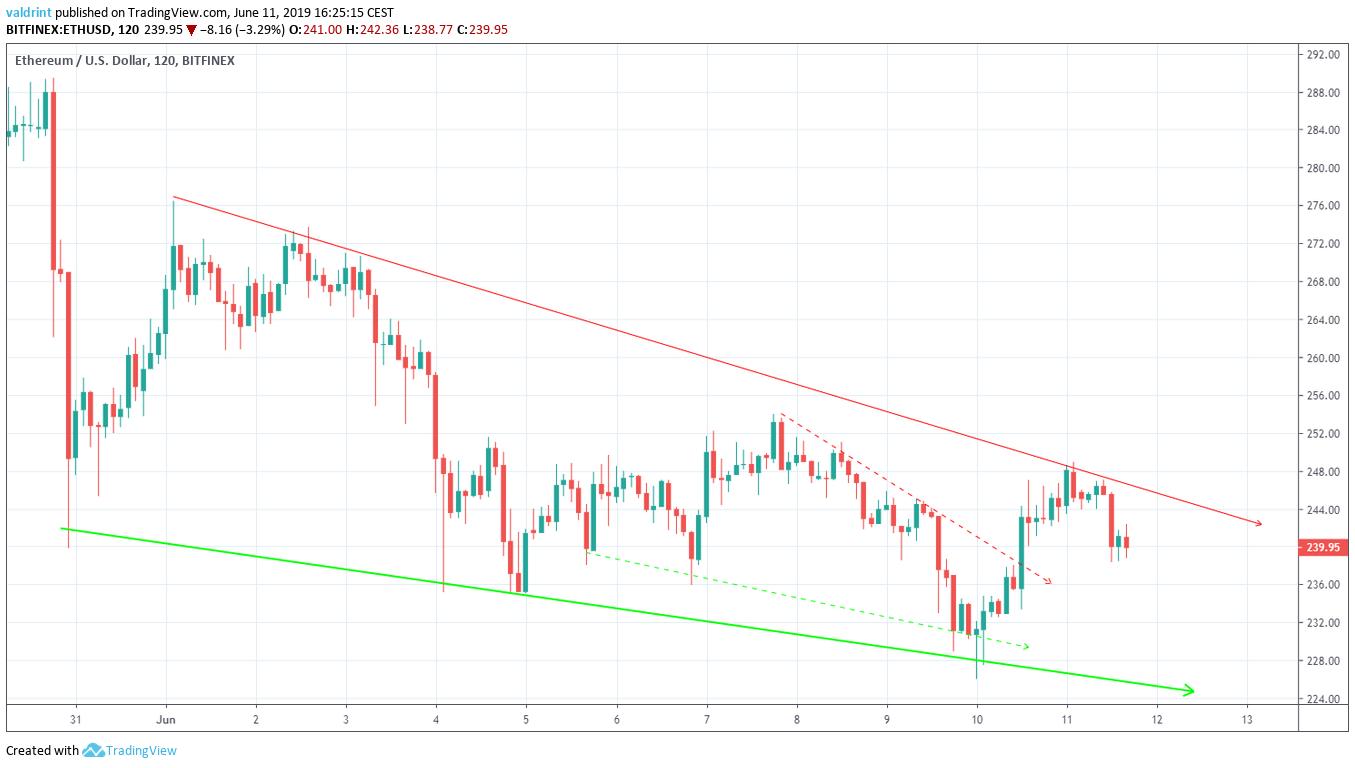
One resistance and one support area are traced for ETH/USD below: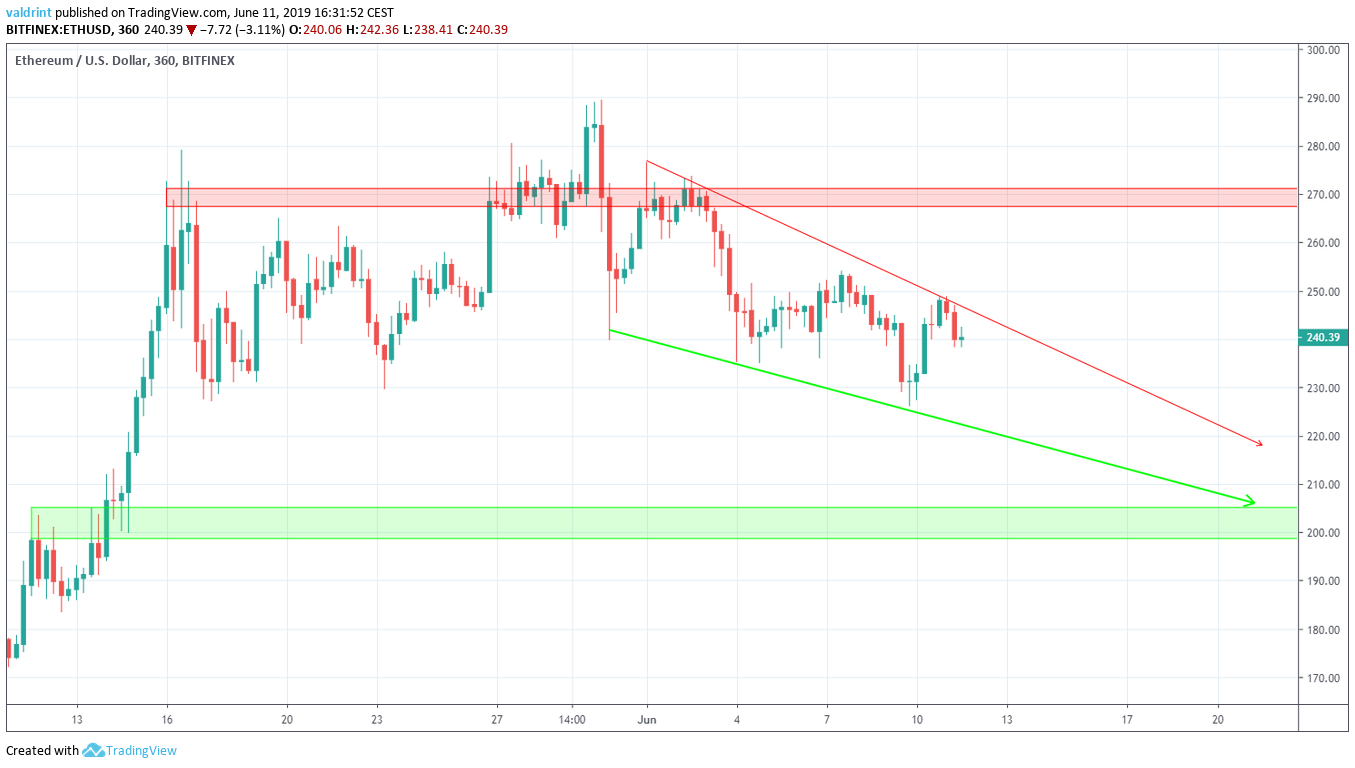 The closest resistance area is found near $270. If the Ethereum price (ETH) breaks out from the wedge, it is likely to reach this area.
The closest support area is found near $200. If the price breaks down from the wedge, it is likely to find support near this area. Furthermore, if it continues to decrease at the rate predicted by the wedge, it should reach this area after June 20. The analysis of technical indicators support this possibility.
The closest resistance area is found near $270. If the Ethereum price (ETH) breaks out from the wedge, it is likely to reach this area.
The closest support area is found near $200. If the price breaks down from the wedge, it is likely to find support near this area. Furthermore, if it continues to decrease at the rate predicted by the wedge, it should reach this area after June 20. The analysis of technical indicators support this possibility.
Summary
To conclude, the price of Ethereum (ETH) has recently broken out of a descending wedge. It is currently trading inside another descending wedge. The technical indicators give a bearish outlook and support price decreases towards the support area outlined above. Do you think the Ethereum price (ETH) will break down from the wedge? Let us know your thoughts in the comments below! Disclaimer: This article is not trading advice and should not be construed as such. Always consult a trained financial professional before investing in cryptocurrencies, as the market is particularly volatile.
Top crypto platforms in the US
Disclaimer
In line with the Trust Project guidelines, this price analysis article is for informational purposes only and should not be considered financial or investment advice. BeInCrypto is committed to accurate, unbiased reporting, but market conditions are subject to change without notice. Always conduct your own research and consult with a professional before making any financial decisions. Please note that our Terms and Conditions, Privacy Policy, and Disclaimers have been updated.

Valdrin Tahiri
Valdrin discovered cryptocurrencies while he was getting his MSc in Financial Markets from the Barcelona School of Economics. Shortly after graduating, he began writing for several different cryptocurrency related websites as a freelancer before eventually taking on the role of BeInCrypto's Senior Analyst.
(I do not have a discord and will not contact you first there. Beware of scammers)
READ FULL BIO
Sponsored
Sponsored