


On July 16, 2019, the ETH price hit lows of ₿0.020. An upward move began and the price reached highs of ₿0.0224 the next day. After a slight decrease, the price reached similar highs on July 25.
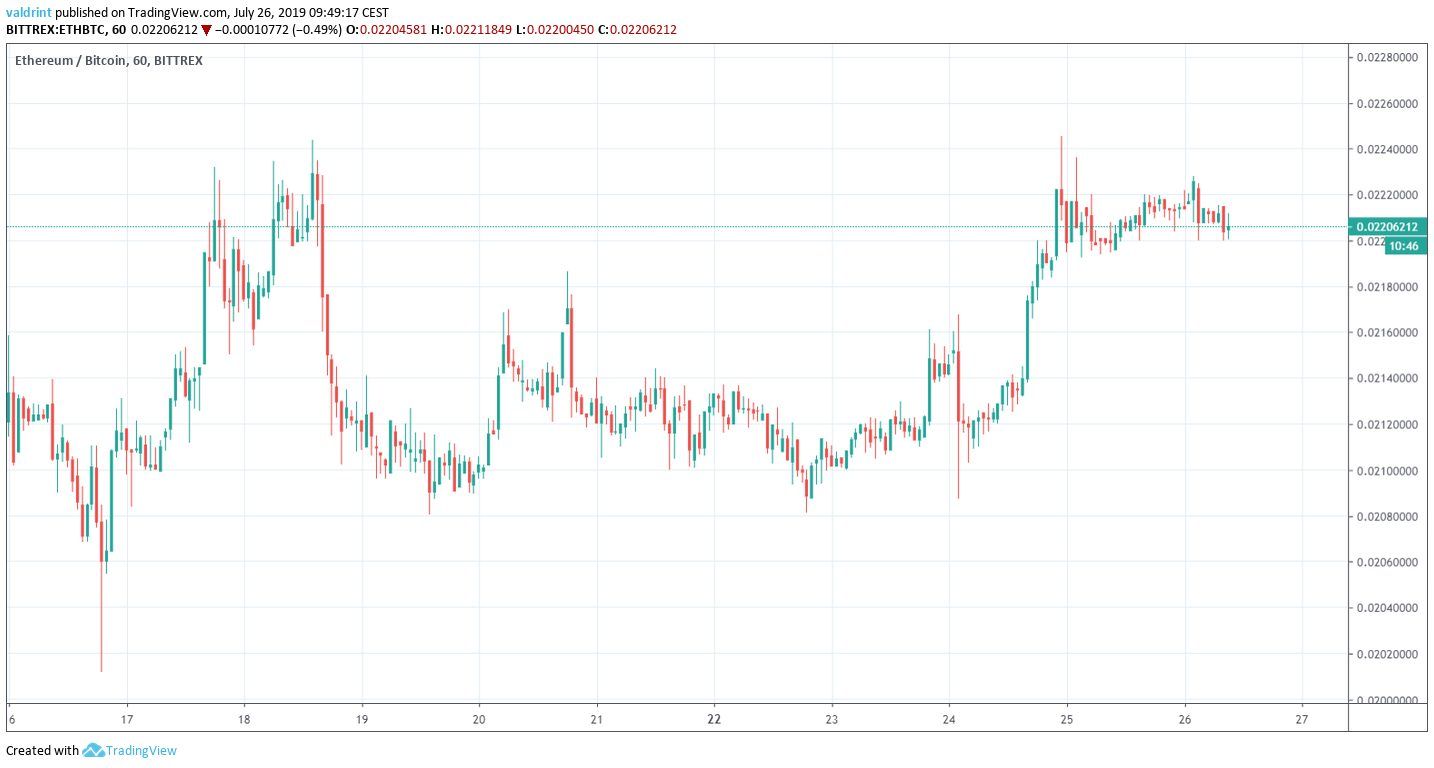
Will Ethereum continue to increase? To answer that question, we are going to analyze the ETH price in different time-frames alongside technical indicators.
For our previous analysis, click here.
If you are interested in trading Ethereum (ETH) with a multiplier of up to 100x on our new partner exchange with the lowest fees, follow this link to get a free StormGain account!
Ethereum Price: Trends and Highlights for July 26
- ETH/BTC is trading inside a horizontal channel.
- Short-term bearish divergence has developed.
- It is trading inside a longer-term descending channel.
- There is resistance near ₿0.0235.
- There is support near ₿0.0215.
ETH Price Previous & Current Pattern
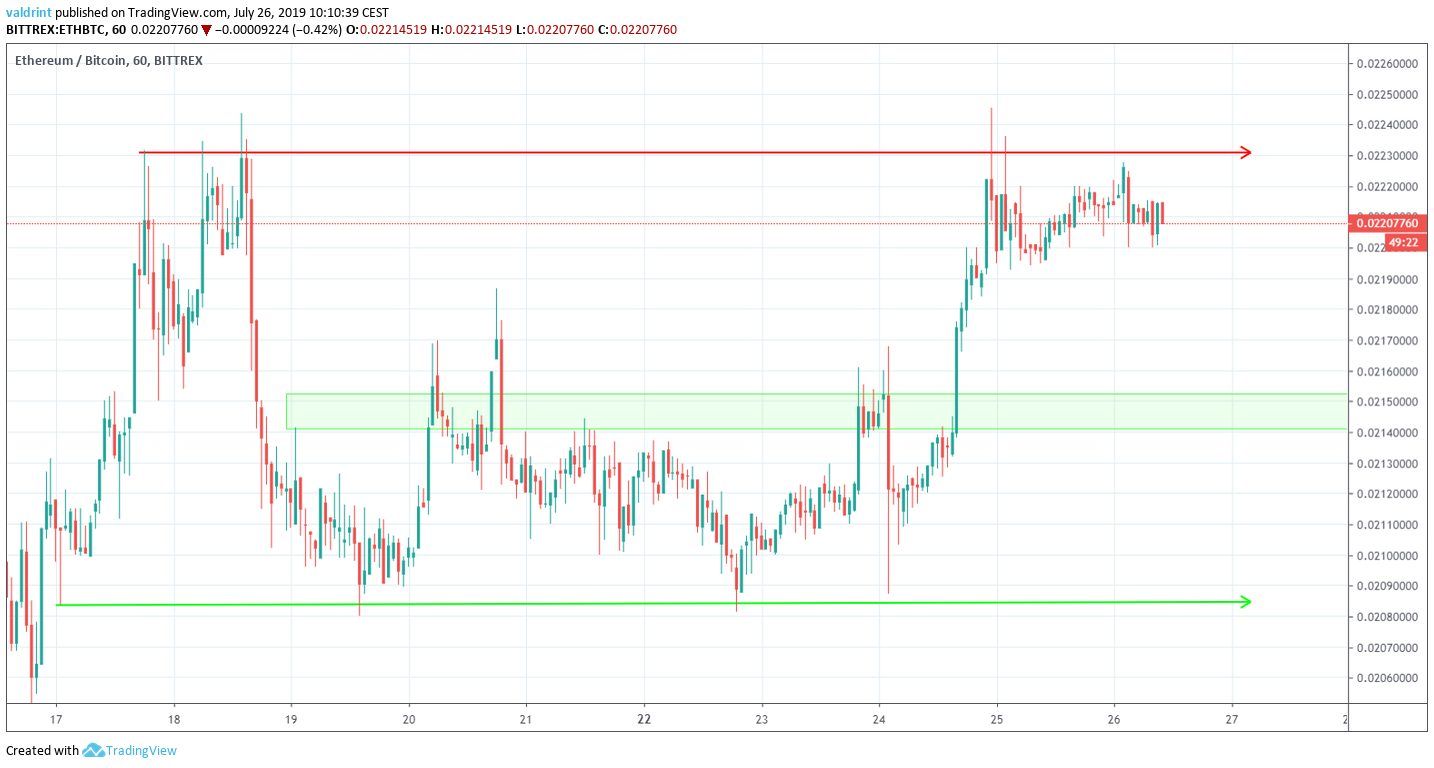
In the period from July 17 to 25, ETH was trading inside a short-term horizontal channel, with resistance at ₿0.0216.
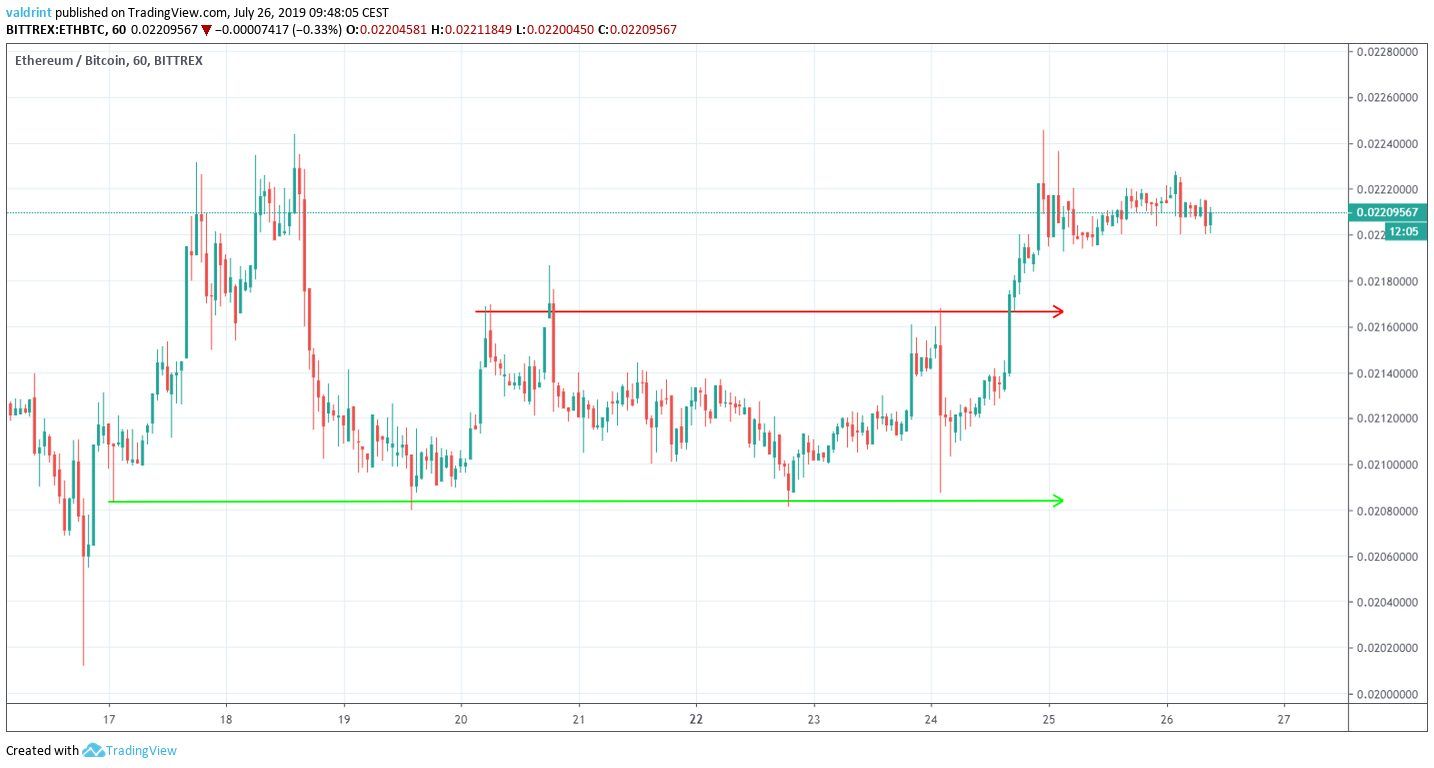
On July 24, the Ethereum price broke out above this resistance.
Currently, it has created a different horizontal channel with resistance at ₿0.024.
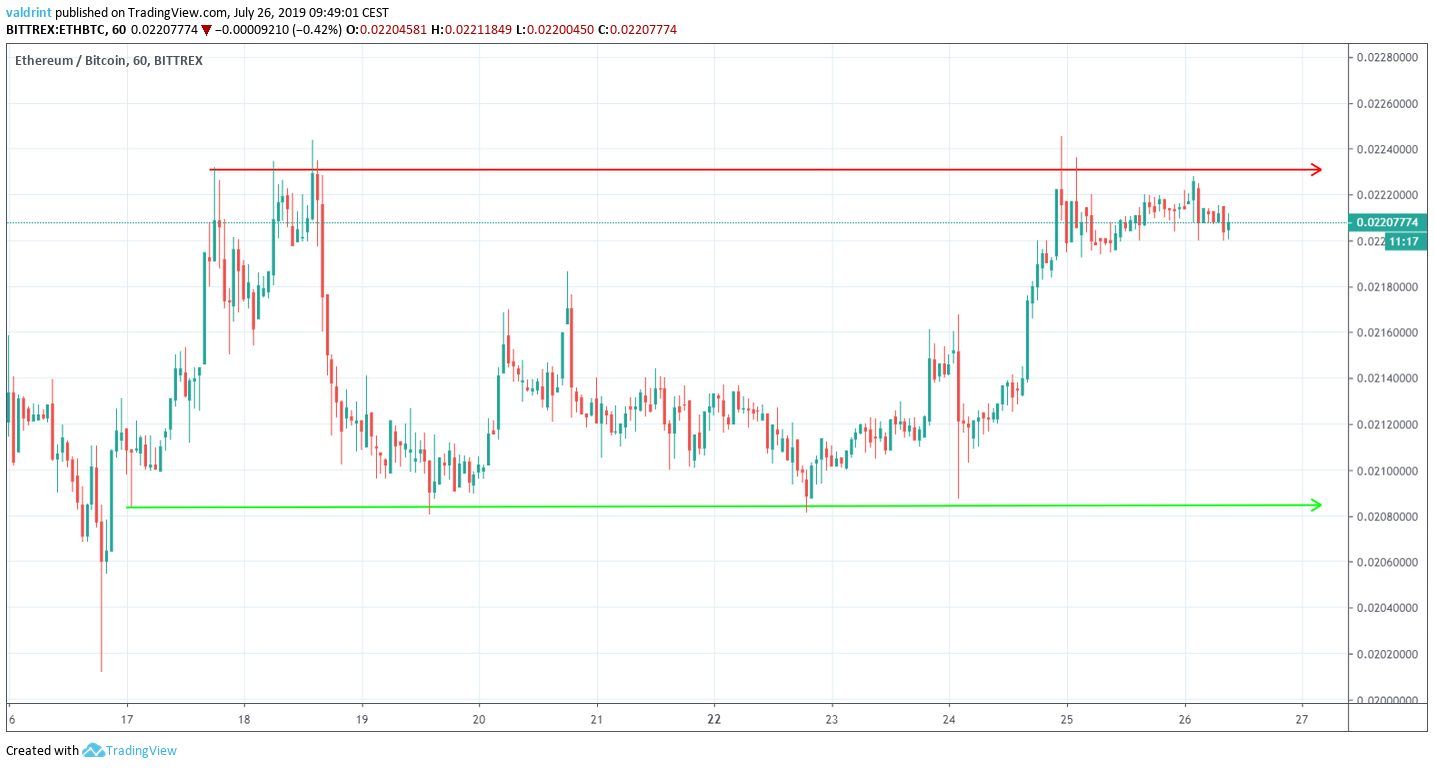
At the time of writing, it was trading right on the resistance line.
Will it break out?
Double Top
On July 25 and 26, the ETH Price created a double top near ₿0.0224.
The double top is considered a bearish reversal pattern.
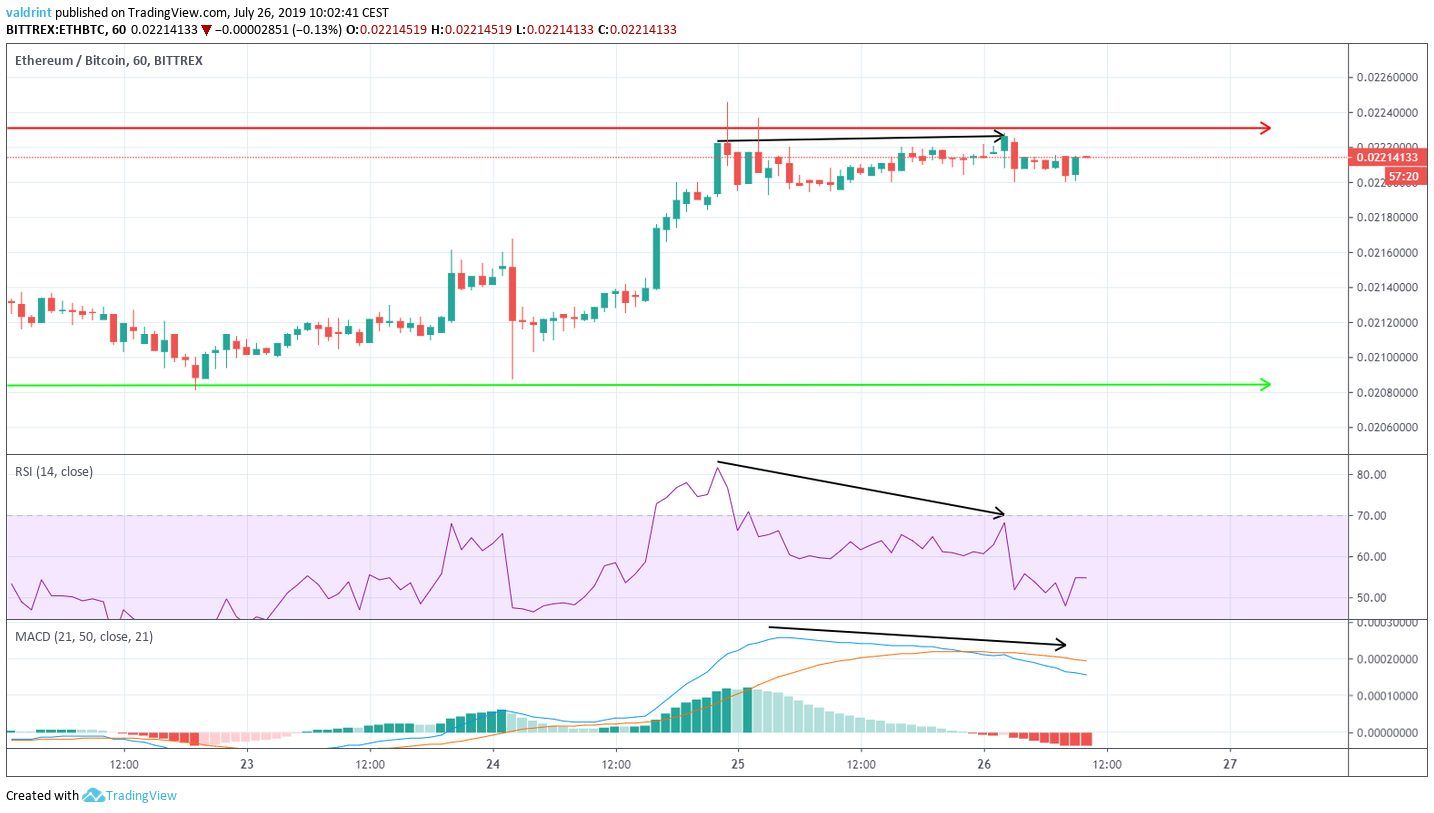
Additionally, this pattern has been accompanied by bearish divergence in both the RSI and the MACD.
The divergence is very significant.
However, it is not present in long-term time-frames.
Therefore, a decrease towards the support line seems likely.
While we are not certain it will reach it, it should at least reach the support area outlined below:
Long-Term
A look at the daily time-frame shows that the price has been trading inside a descending channel since the beginning of 2019.
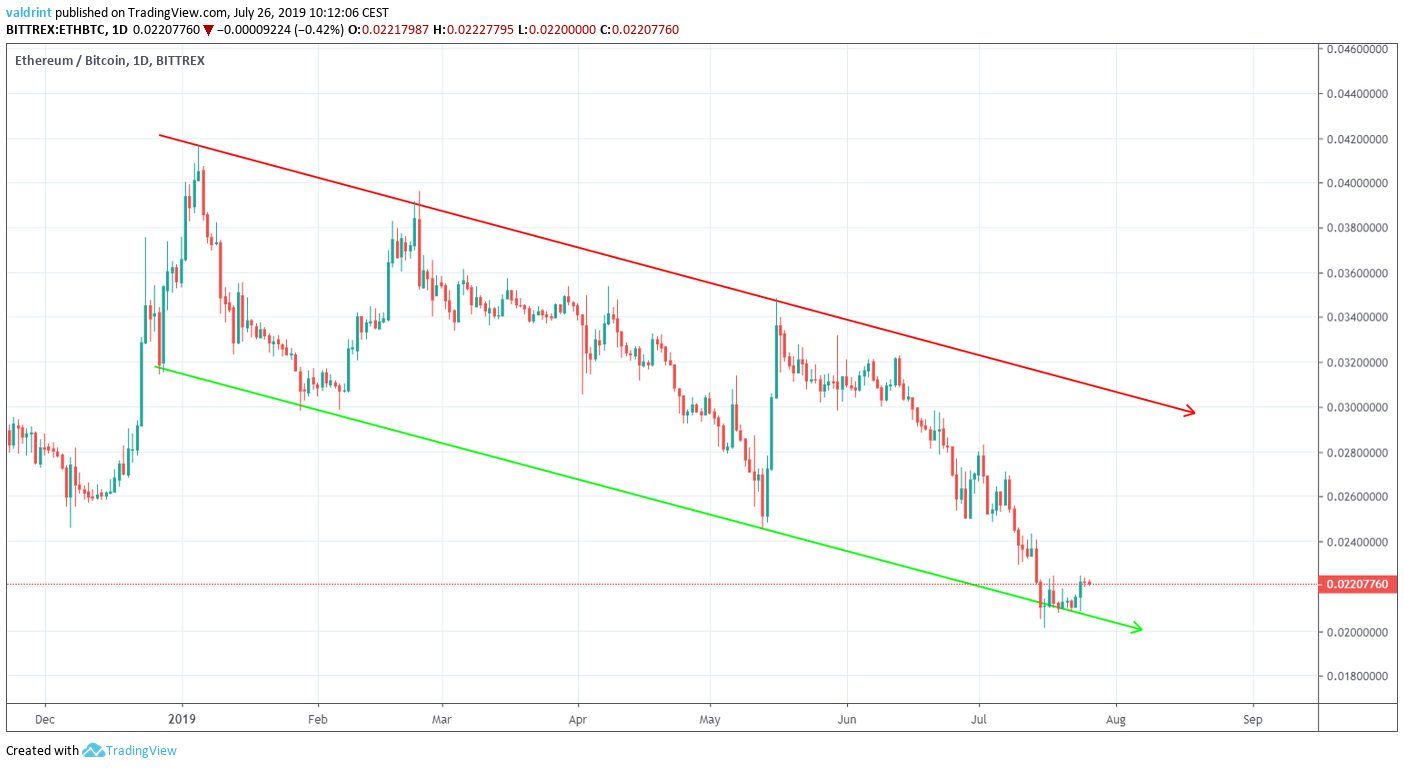
At the time of writing, it was trading very close to the support line of the channel.
A look at the RSI shows that there has been a very significant bullish divergence developing.
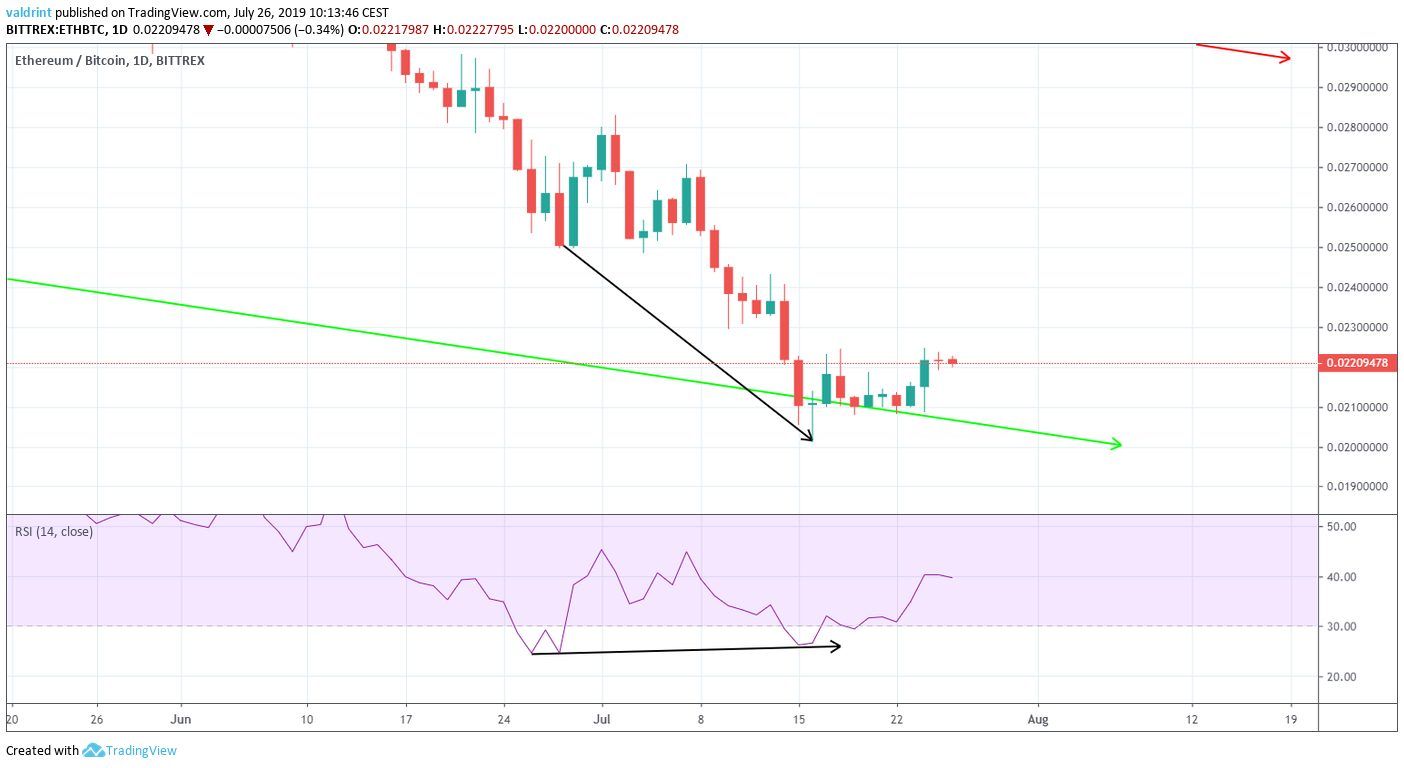
This divergence makes us believe that the ETH price will begin an uptrend towards the resistance line.
Therefore, while we expect short-term decreases, the price should eventually begin an uptrend.
Reversal Areas
If the Ethereum price breaks out from the short-term channel, one resistance area is outlined below.
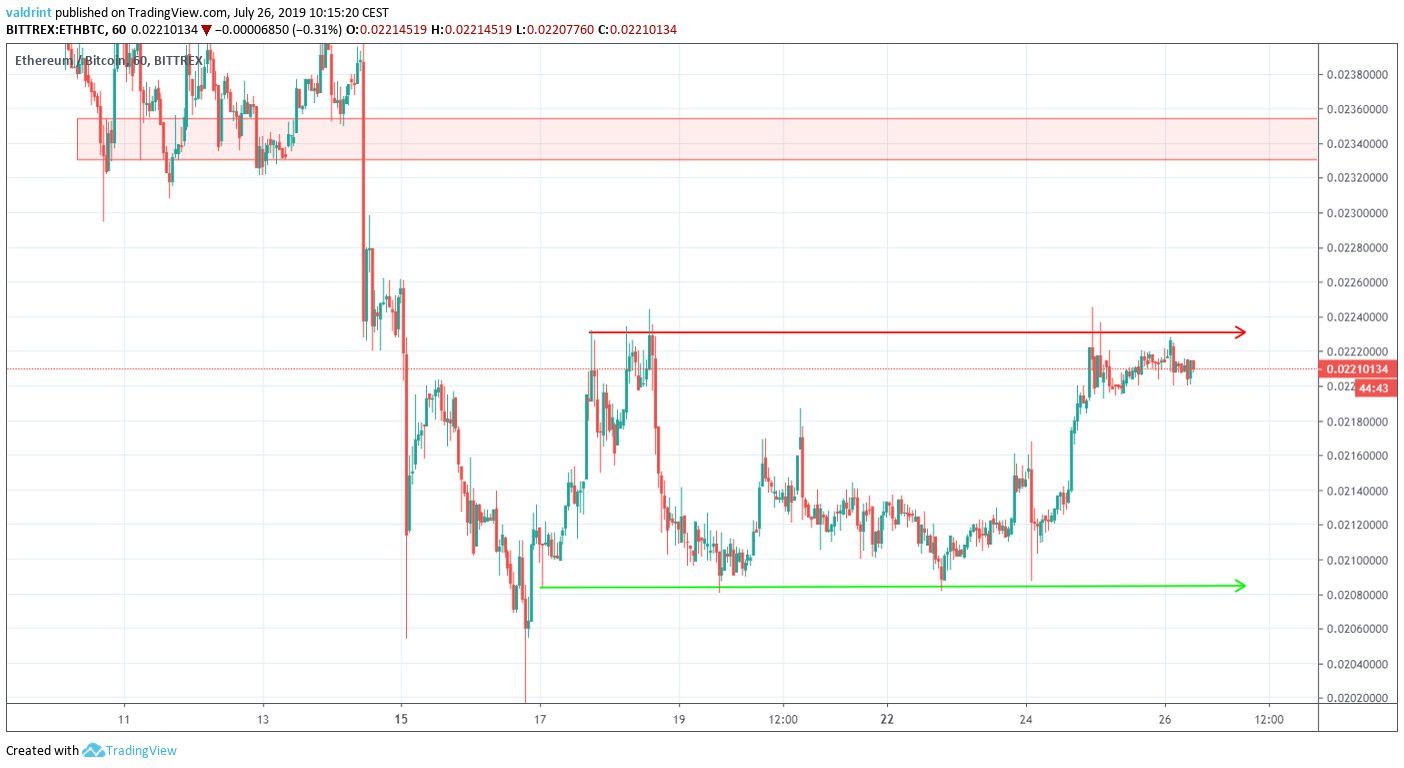
It is found near ₿0.0235.
While we do not believe the current breakout attempt will be successful, the price should eventually reach the resistance area.
Summary
The Ethereum price is trading inside a horizontal channel.
According to our analysis, it is likely to decrease in the short-term before resuming its upward movement.
Do you think Ethereum will break out from the channel? Let us know in the comments below.
Disclaimer: This article is not trading advice and should not be construed as such. Always consult a trained financial professional before investing in cryptocurrencies, as the market is particularly volatile.
Images are courtesy of Shutterstock, TradingView.


