


Ethereum (ETH) has nearly doubled in price since its June 18 lows. It is possible that a local bottom is in place.
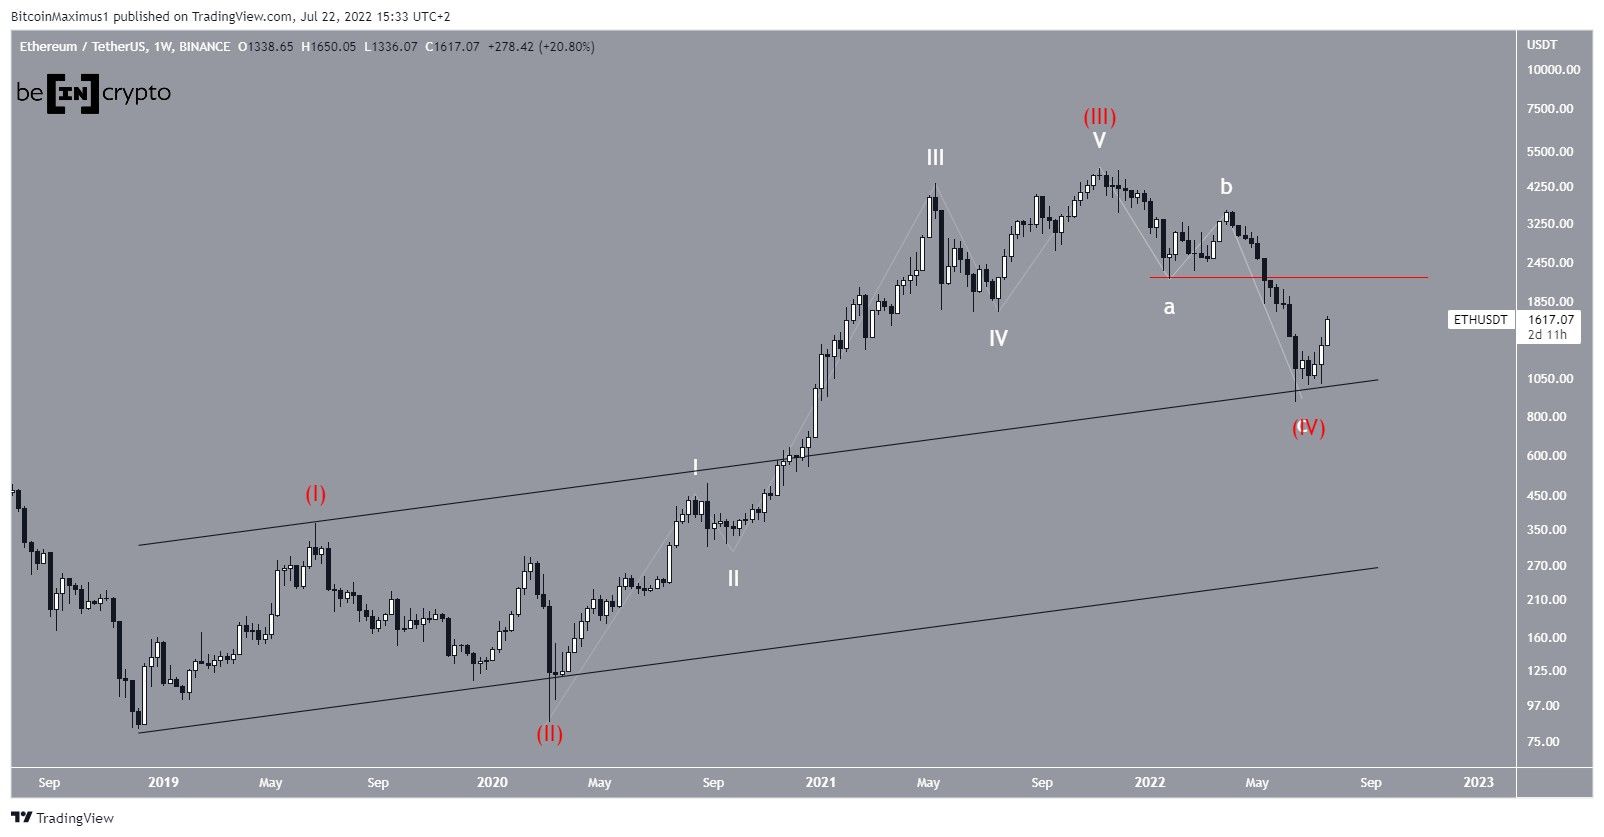
The most likely long-term count suggests that ETH completed a five-wave upward movement (white) between March 2020 and Nov 2021. Afterward, it seems to have completed an A-B-C corrective structure.
In the longer-term, the aforementioned increase was likely part of wave three (red), while the ensuing correcting part of wave four, which in turn developed into a fourth-wave pullback (red).
If the count is correct, the price has begun a new upward movement that will eventually lead to a new all-time high price. In order for the count to be confirmed, Ethereum has to move above the wave one low (red line) at $2,159.
Ongoing ETH breakout
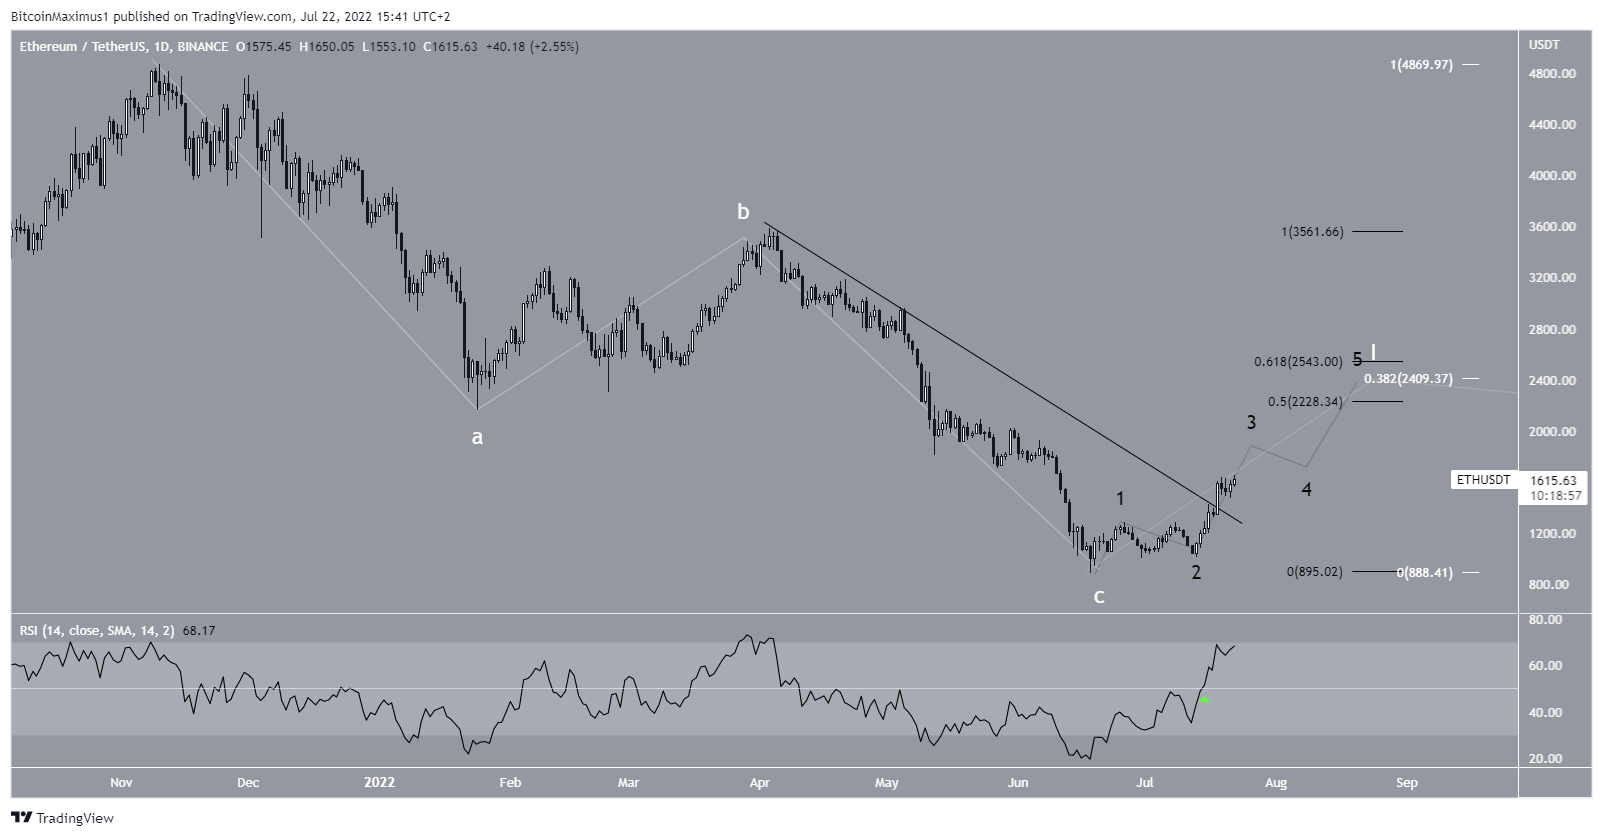
The daily chart also provides a bullish outlook, since it shows that the price has already broken out from a descending resistance line that had been in place since April 5. Additionally, the daily RSI has moved above 50 (green icon), in what is considered a sign of bullish trends.
If the previously outlined count is correct, ETH is currently in wave one of a new five-wave upward movement (white). The sub-wave count is given in black.
The most likely area to act as the local top is between $2,230 and $2,540. It is created by the short-term 0.5-0.618 Fib retracement resistance area (black) and the long-term 0.382 retracement resistance.
Short-term movement
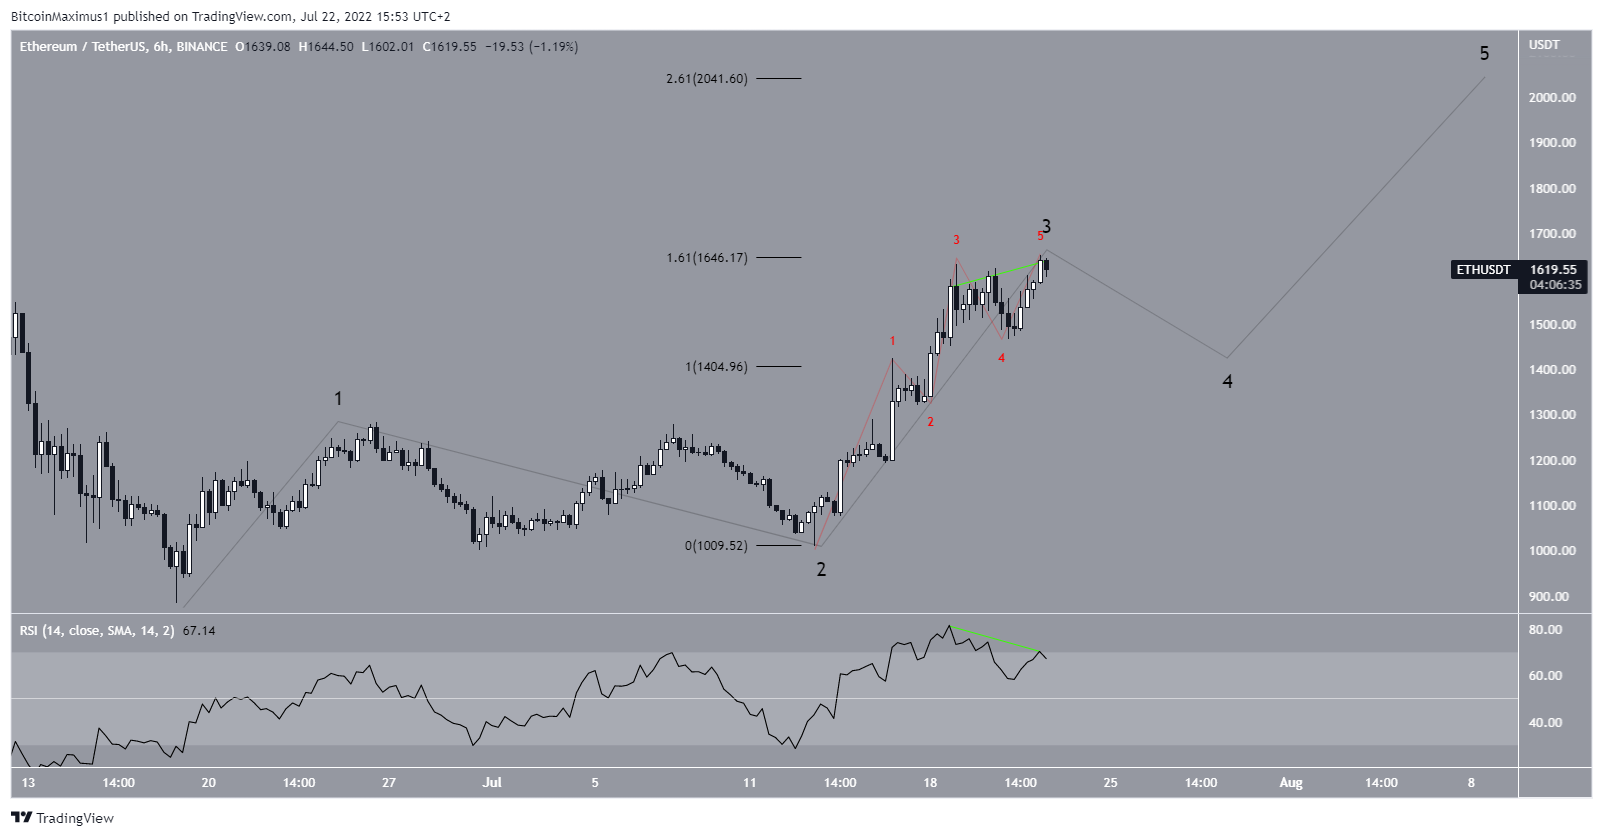
Finally, a closer look at the previously outlined sub-wave count shows that ETH is likely in wave three of a five-wave upward movement. So far, sub-wave three has had 1.61 times the length of sub-wave one, which is common in such structures.
As a result, a short-term drop could follow prior to the fifth and final sub-wave.
The possibility of a drop is also supported by the six-hour RSI, which has generated bearish divergence (green line)
For Be[in]Crypto’s latest Bitcoin (BTC) analysis, click here


