


Bitcoin (BTC) has broken out from both short and long-term resistance levels and could soon accelerate toward the next closest resistance near $30,000.
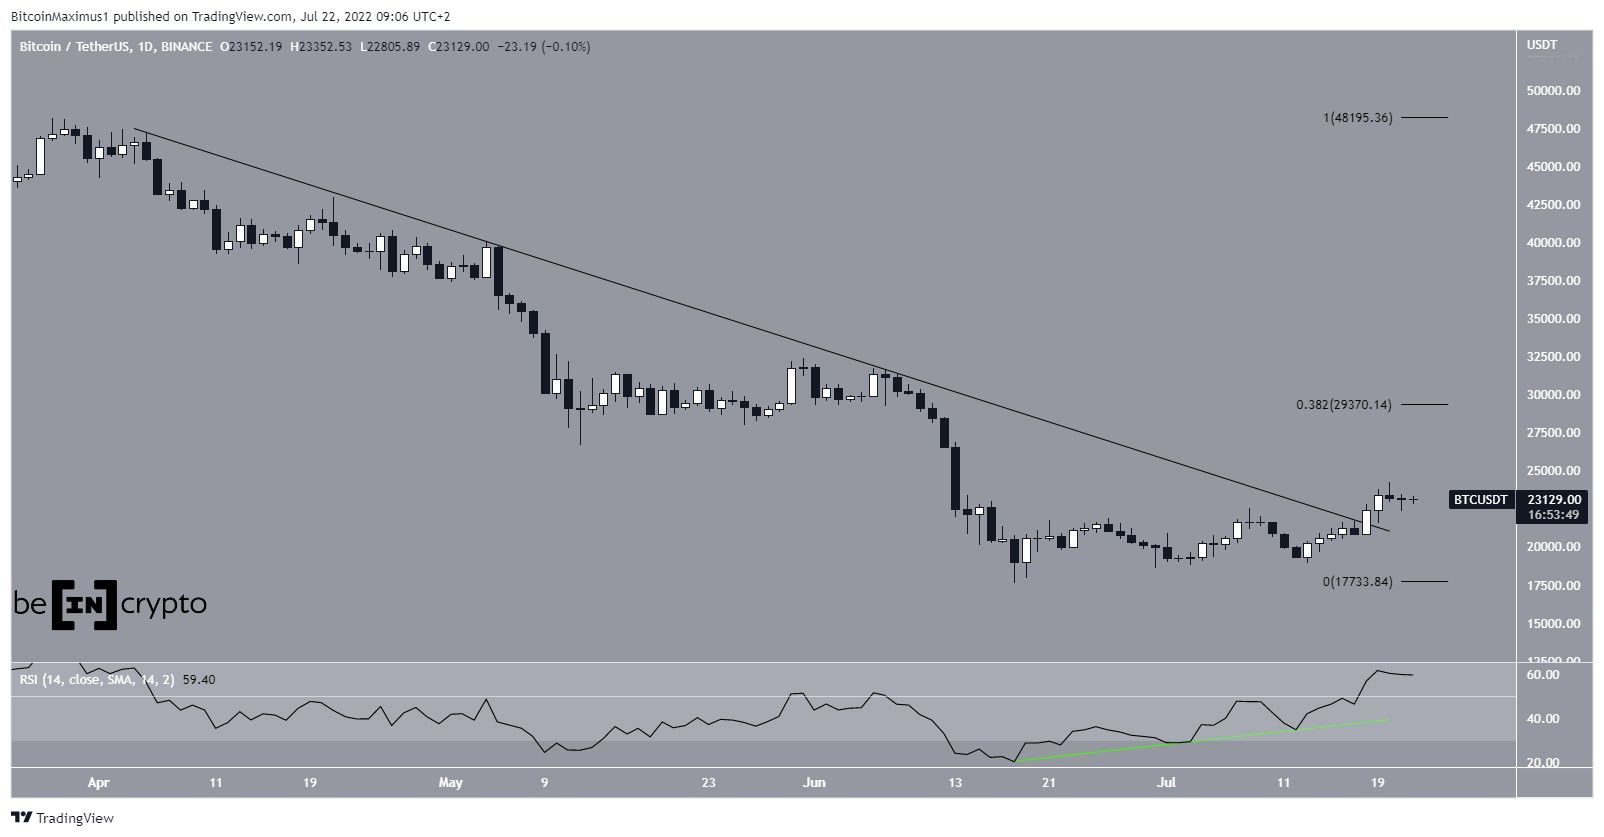
Bitcoin had been trading underneath a long-term descending resistance line since April 5. The line recently caused a rejection on June 6, leading to a local low price of $17,622 on June 18.
The price has been moving upwards since and broke out from the descending resistance line on July 18. While it has yet to initiate a significant upward move, Bitcoin is still hovering above the resistance line.
Additionally, the daily RSI supports the continuation of the upward move. The indicators are following an ascending support line (green line), which is still intact. Moreover, it has moved above 50 — often a strong sign of a bullish trend.
If the increase continues, the next closest resistance area would be found at $29,400. This target is the 0.382 Fib retracement resistance level.
Short-term breakout
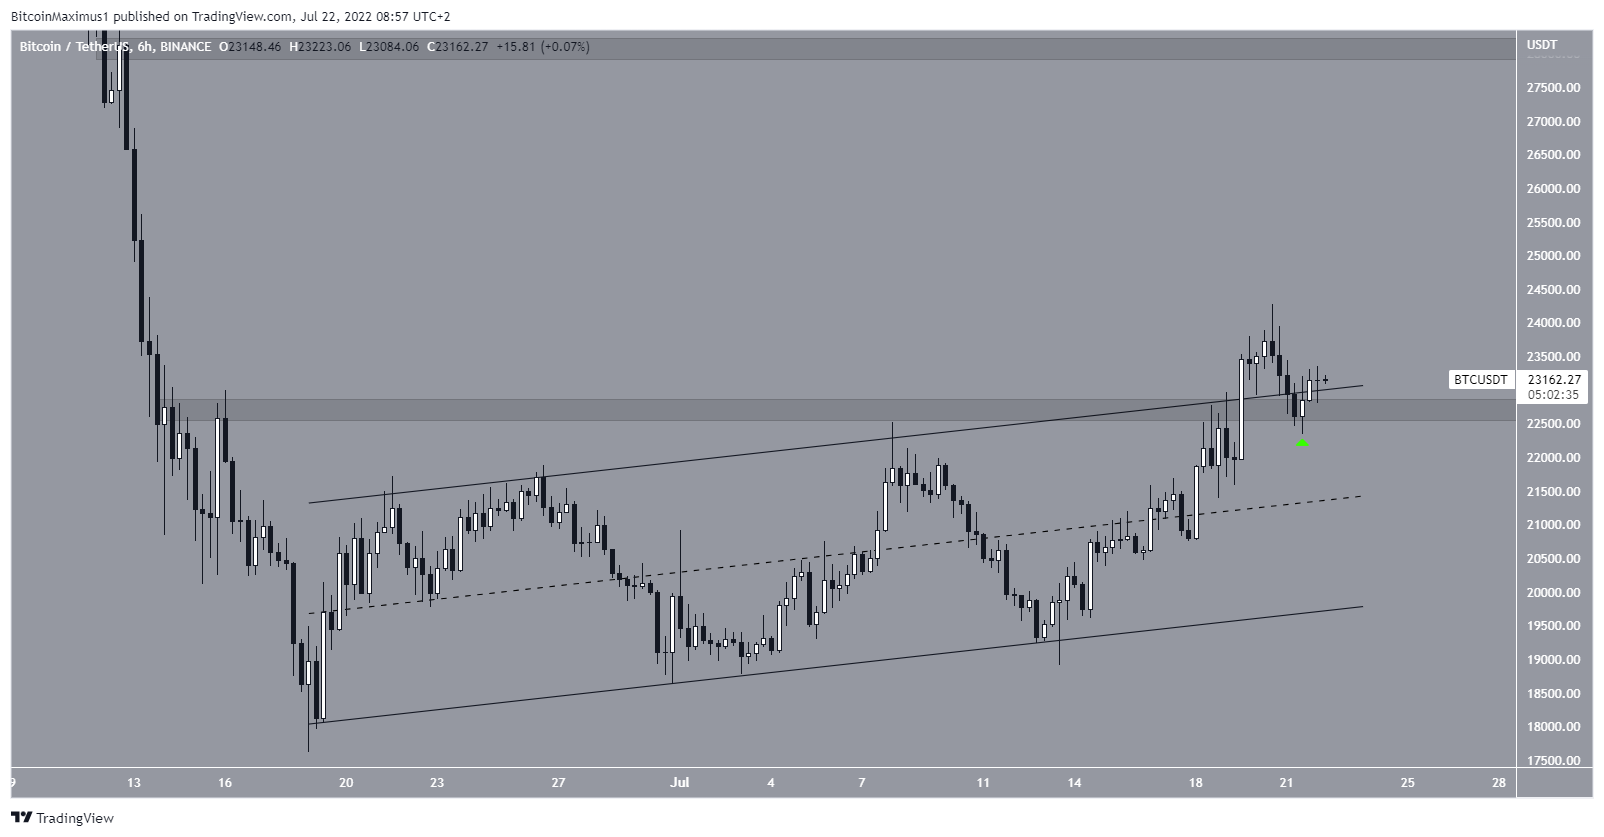
The six-hour chart supports the readings from the daily time-frame, indicating that the upward move is likely to continue.
The main reason for this is that BTC has already broken out from an ascending parallel channel and is currently in the process of validating it as support (green icon). Also, it’s in the process of validating the $22,600 horizontal area as support.
If successful, BTC would be expected to increase towards the previously outlined resistance area near $30,000.
BTC wave count analysis
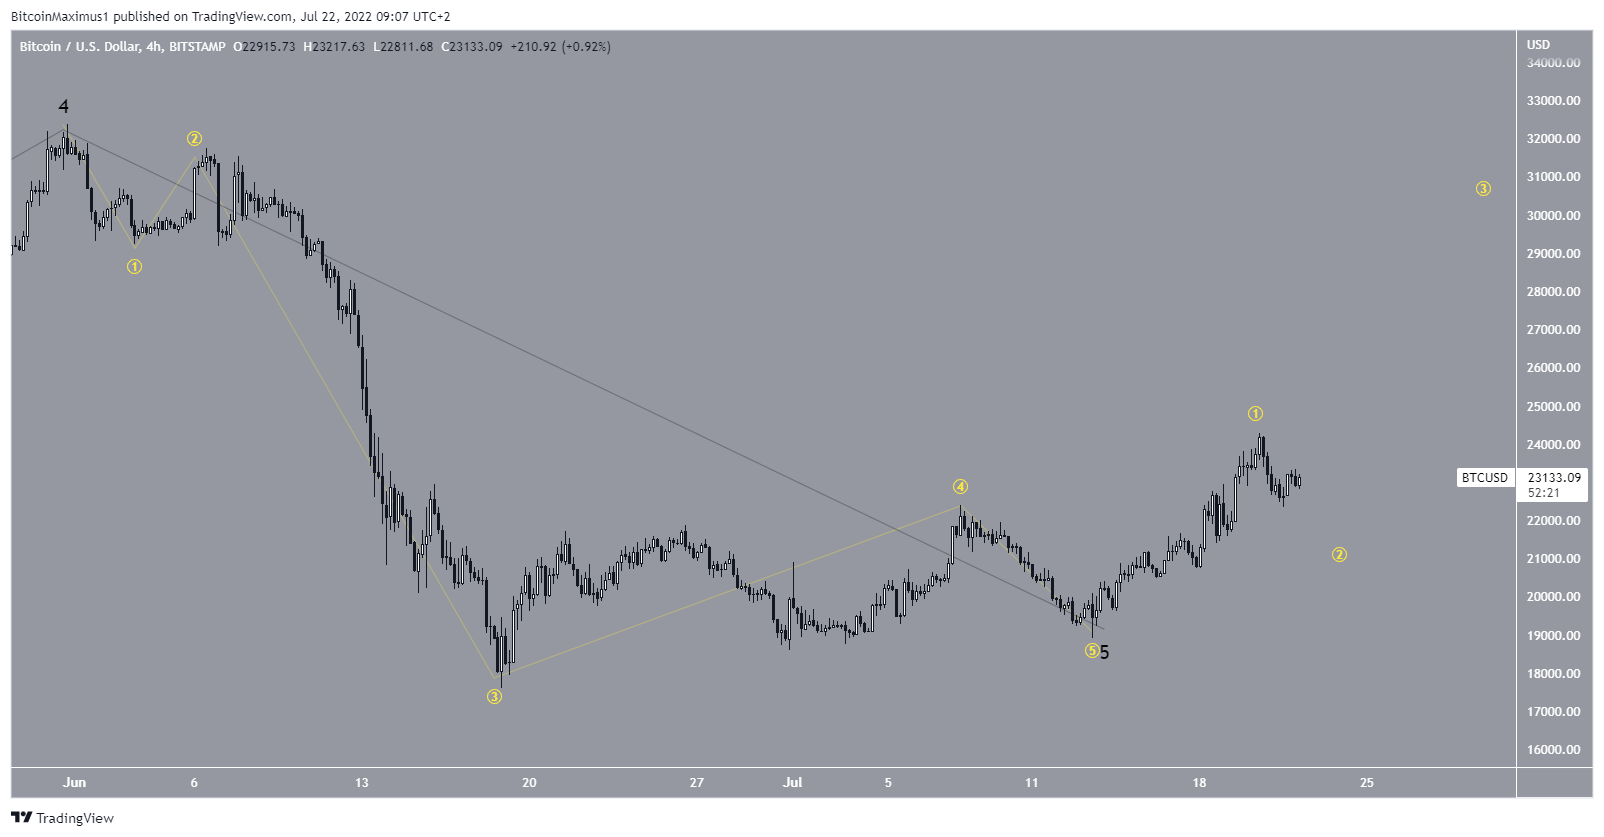
Finally, the wave count also supports the possibility that Bitcoin will continue to increase. The most likely count indicates that the price has completed a five-wave downward move (yellow). In it, the fifth and final wave was truncated.
If true, Bitcoin has likely begun a new upward trend and has completed the first wave of this increase.
For Be[in]Crypto’s previous bitcoin (BTC) analysis, click here


