
The Ethereum (ETH) price is trading slightly above a crucial resistance level at $1,664. Reclaiming it would be a positive signal for the future price.
ETH is the native token of the Ethereum blockchain, created by Vitalik Buterin. After the release of Ethereum 2.0, it moved to a proof-of-stake (PoS) consensus mechanism. Ethereum developers launched the Shanghai and Capella Fork on the Zhejiang testnet on Feb. 7. They launched at epoch 1350 and will improve the Ethereum network execution and Beacon Chain consensus layers.
Despite the network upgrade, futures traders are betting on a dip since more and more of them are switching to shorts.
Ethereum Price Reaches Critical Level
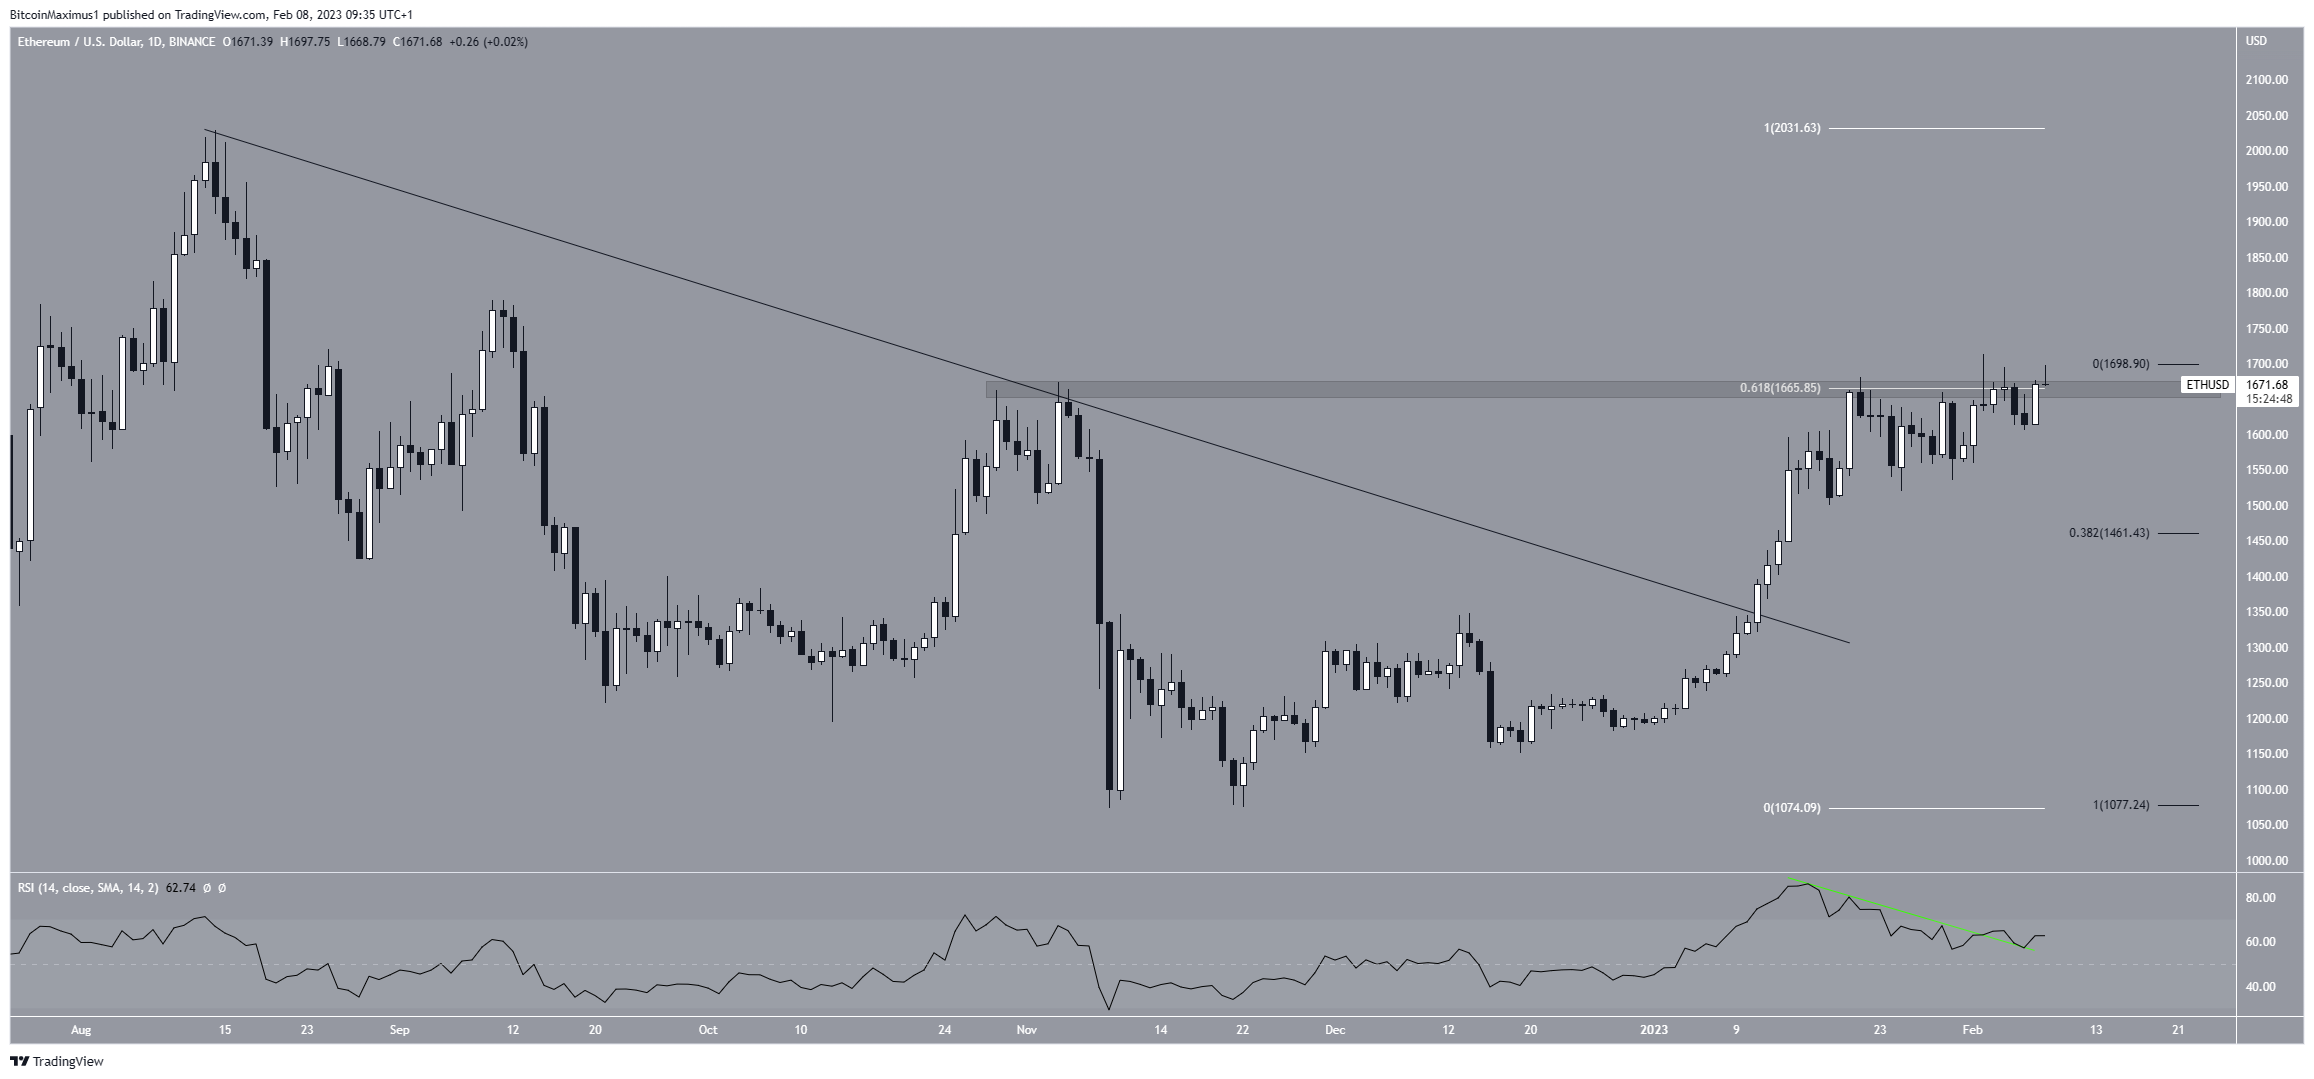
Ethereum price has increased rapidly since breaking out from a descending resistance line on Jan. 11. The increase led to a high of $1,712 on Feb. 2. However, the ETH token price created a shooting star candlestick (red icon), validating the $1,664 level as resistance. This is a crucial resistance area since it is the 0.618 Fib retracement resistance level and a horizontal resistance area.
However, the Ethereum price regained its footing and is making another breakout attempt by creating a bullish candlestick on Feb. 7.
The daily RSI reading is very interesting. It seems that the ETH price broke out from its bearish divergence trend line (green). If so, reclaiming the $1,664 resistance area and moving toward $2,000 is likely.
On the other hand, another rejection from the resistance area could lead to a fall toward the closest Fib support at $1,461.
Short-Term Pattern Crucial for Future Trend
The technical analysis from the six-hour time frame shows that the ETH price has traded inside an ascending parallel channel since Jan. 18. Even though such channels are considered bearish patterns, the price is trading in its upper portion, allowing for the possibility of a breakout.
Since the channel also coincides with the crucial resistance area from the daily time frame, whether the ETH price breaks out or down from it can determine the future trend.
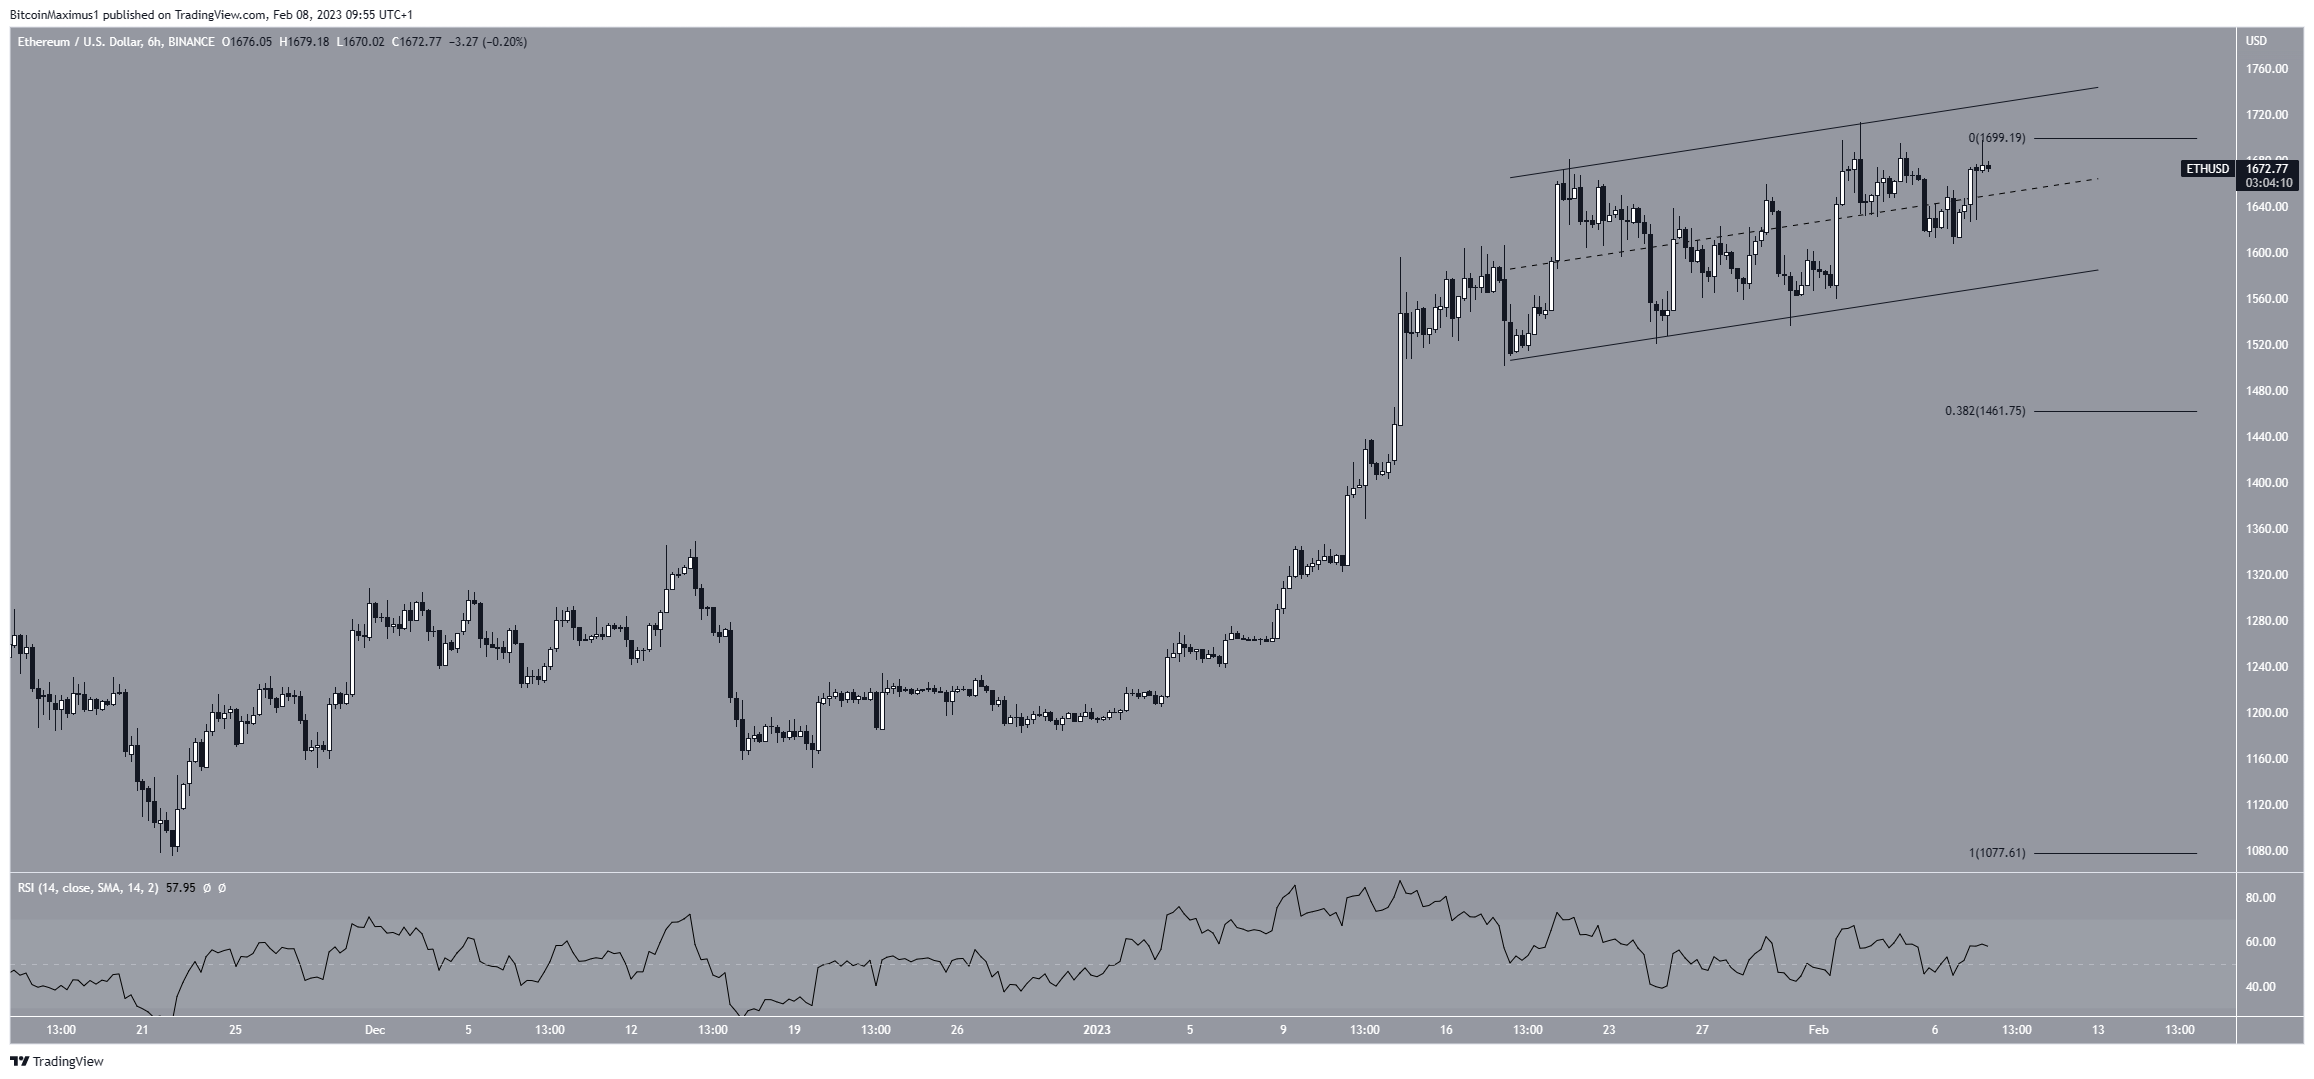
To conclude, the direction of Ethereum’s future movement is still unclear. Whether the price breaks out or down from the current pattern will be crucial in determining it. A breakout could lead to highs near $2,000, while a breakdown could lead to a retest of $1,461.
For BeInCrypto’s latest crypto market analysis, click here.
