
Be[In]Crypto takes a look at the five cryptocurrencies that increase the most last week, more specifically, from July 15 to 22.
These cryptocurrencies are:
- Lido DAO (LDO) : 77.13%
- Ethereum Classic (ETC) : 75.76%
- Bitcoin Gold (BTG) : 44.46%
- Apecoin (APE) : 42.24%
- Ethereum (ETH) : 32.04%
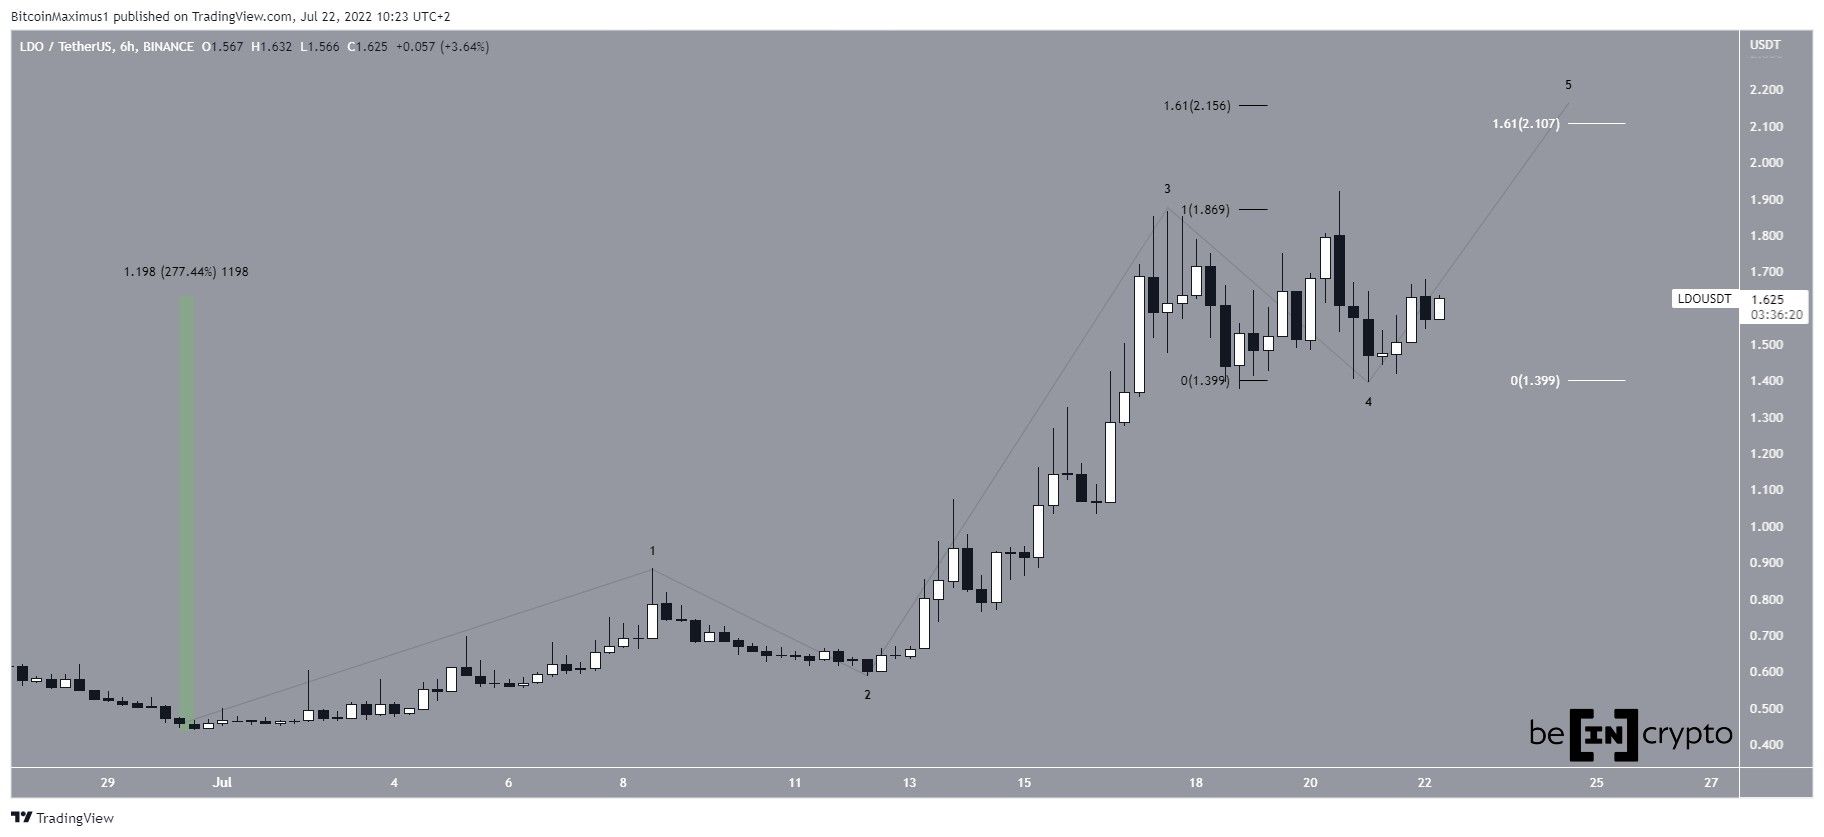
LDO
LDO has been increasing rapidly since reaching a low of $0.43 on June 30. So far, it has moved upwards by 275%.
The entire increase resembles a five-wave upward movement, in which LDO is currently in wave four.
If wave four is complete, the main target for the fifth and final wave would be between $2.10 and $2.15. The target is found by using an 1.61 external Fib retracement on wave four (black) and the 1.61 length of wave one (white).
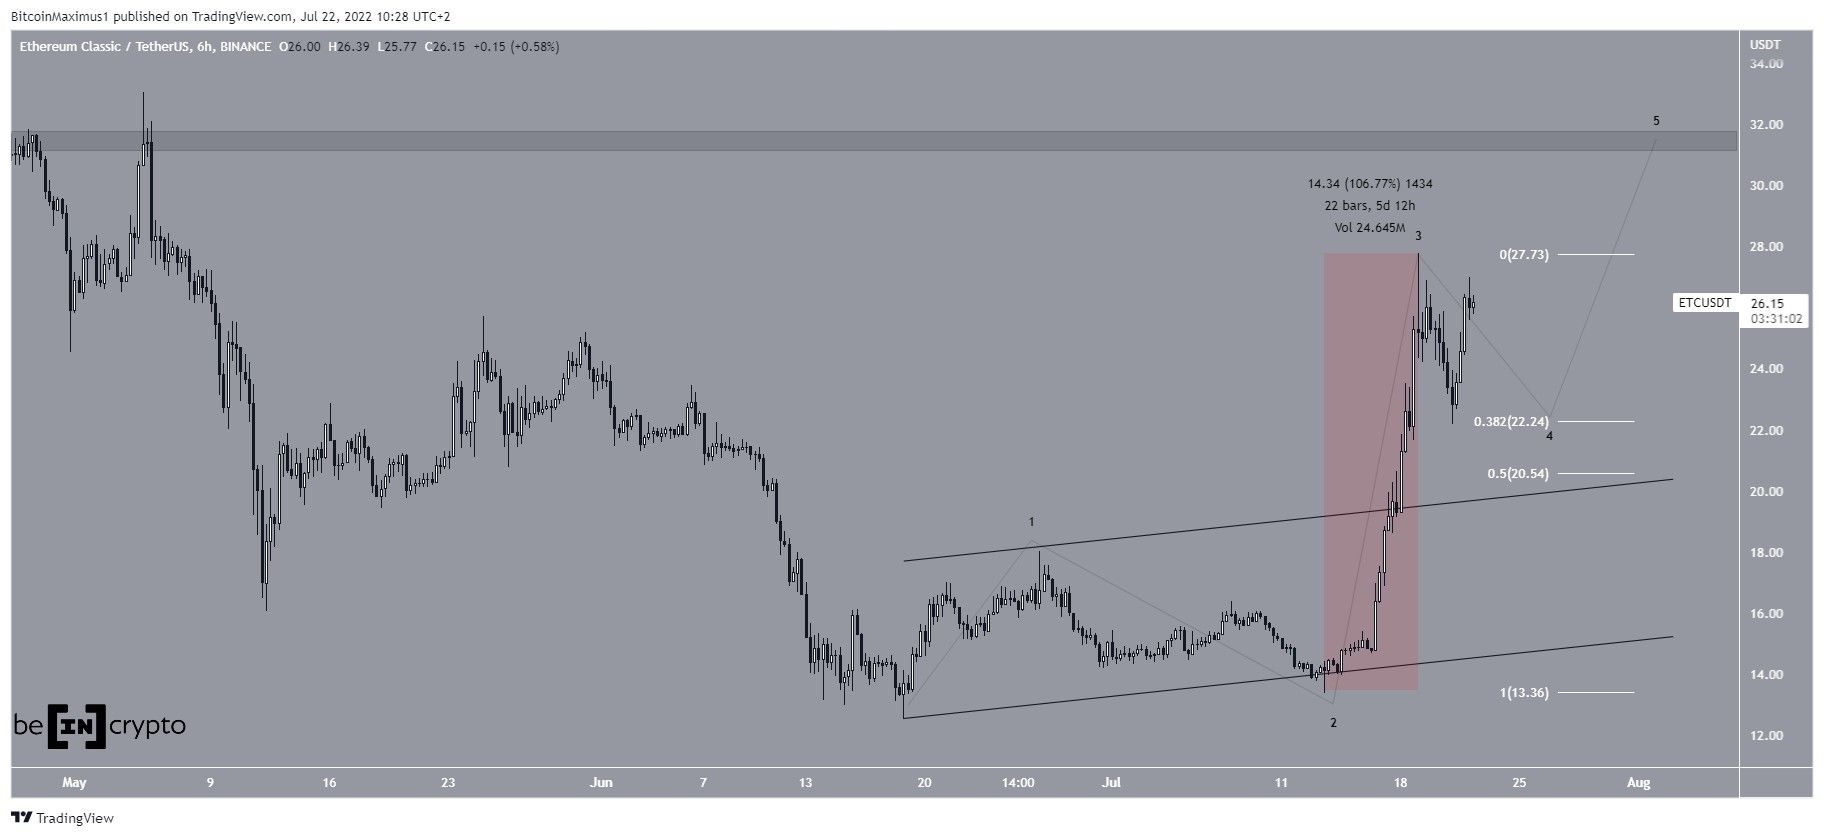
ETC
ETC has been moving upwards since June 19. it accelerated its rate of increase after creating a higher low on July 13 and broke out from an ascending parallel channel afterwards. In a span of five days, ETC increased by 107%, leading to a high of $27.77 on July 19.
ETC has been retracing since in what is likely to be wave four.
Since the wave two retracement was deep, the wave four one is expected to be shallow due to the concept of alternation. So, the retracement is likely to end either at the 0.382 or 0.5 Fib retracement support levels at $22.20 or $20.50, respectively.
Afterward, the fifth and final wave could take ETC to the $31.50 horizontal resistance area.
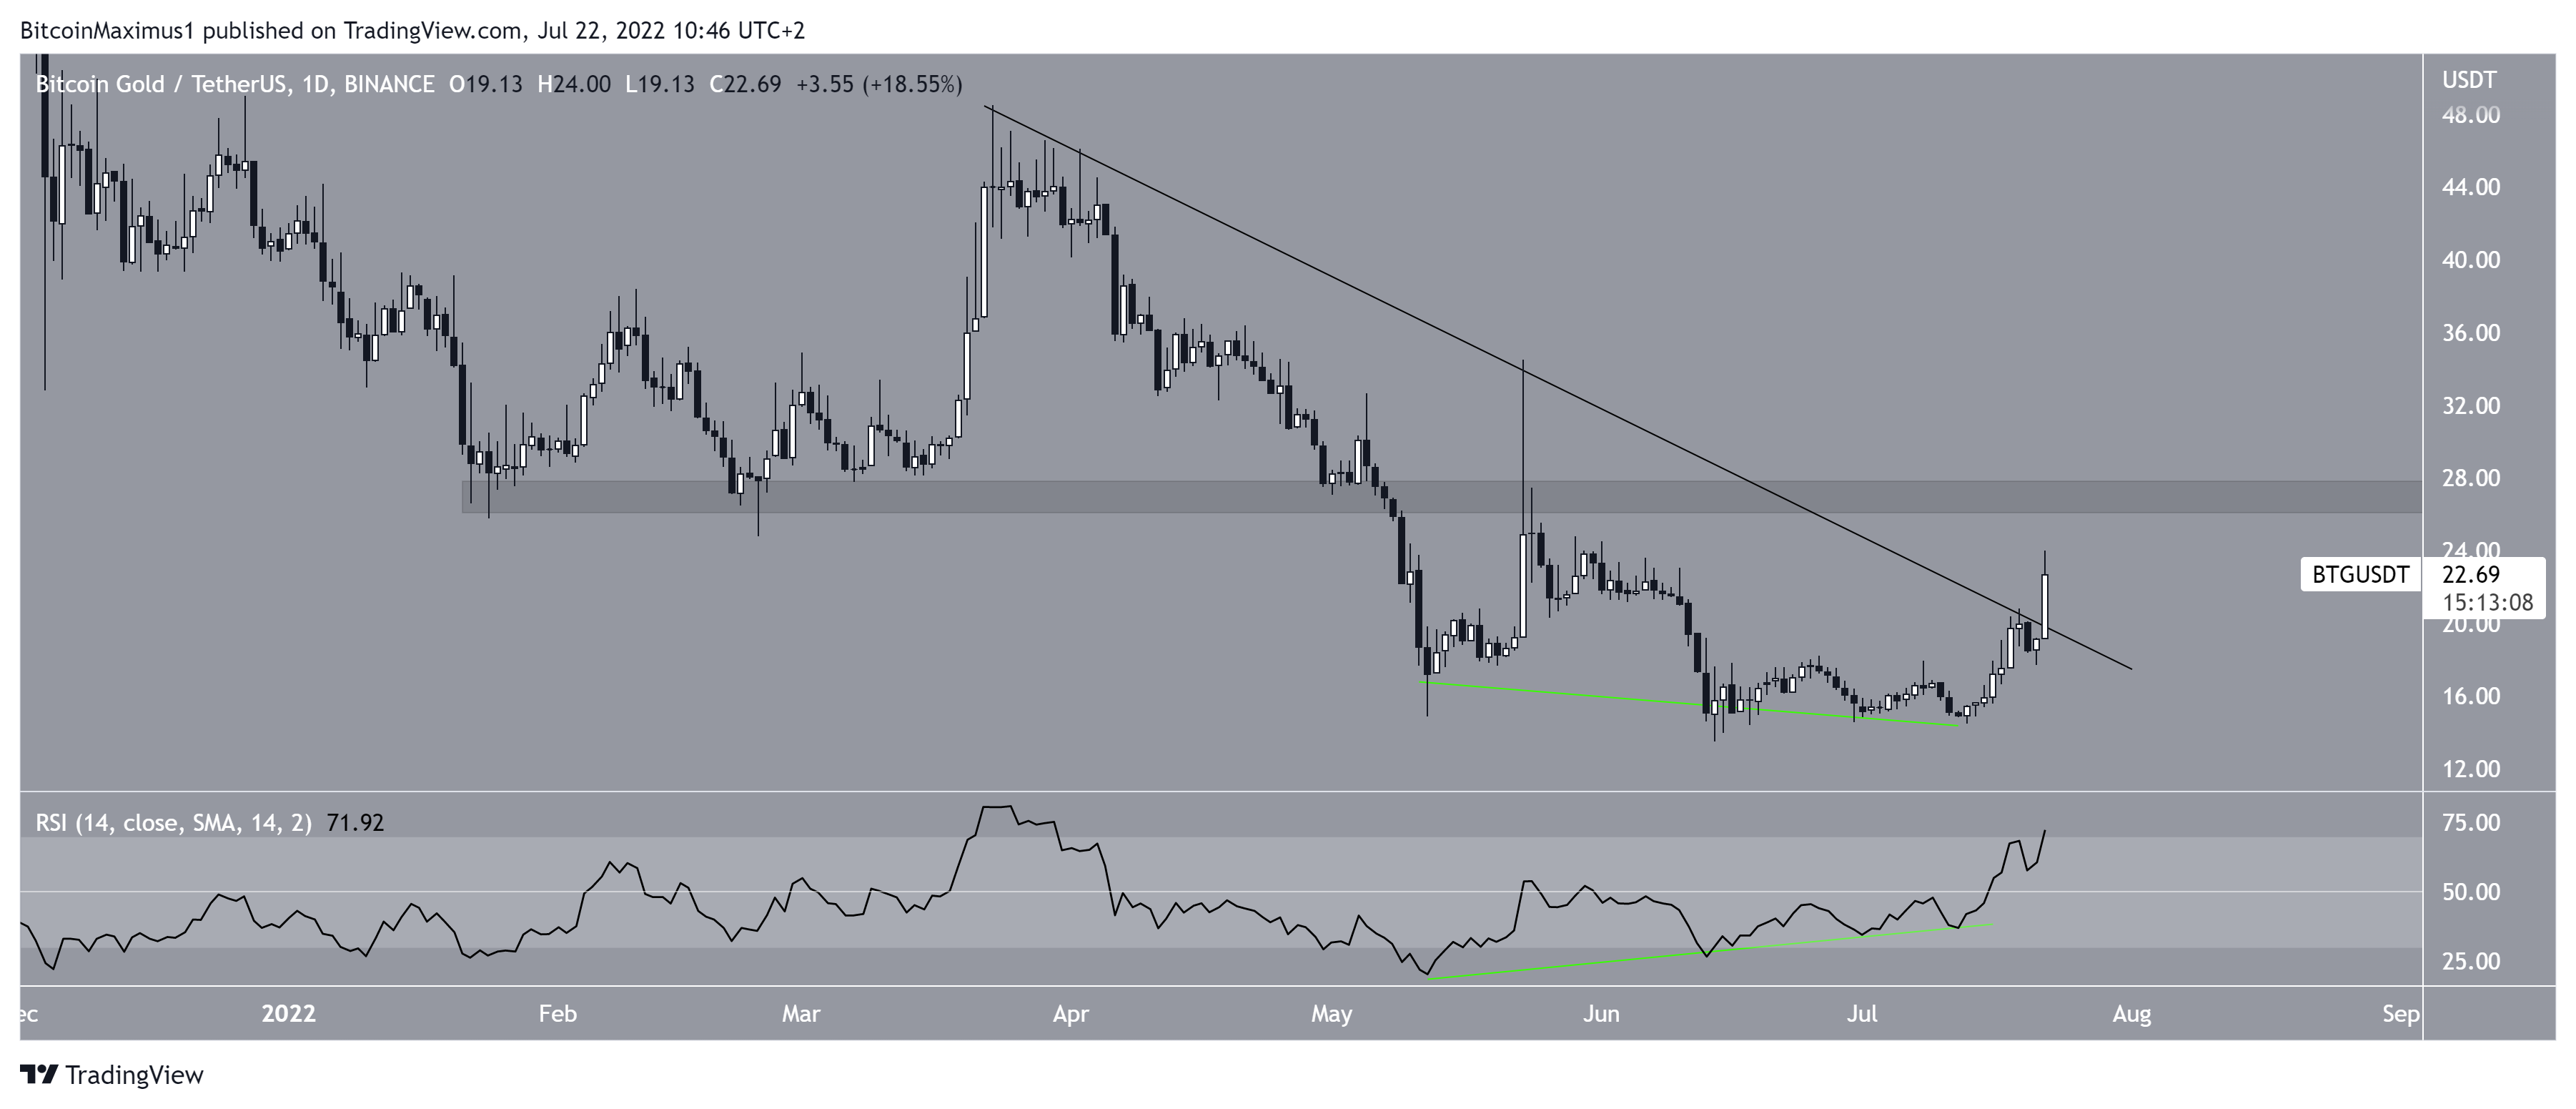
BTG
BTG had been decreasing underneath a descending resistance line since March 23. Beginning in May, it created a triple bottom pattern, which was combined with bullish divergence in the RSI. The triple bottom is considered a bullish pattern, and the RSI reading further increases its legitimacy.
Afterward, BTG initiated an upward movement on July 12 and is currently in the process of breaking out from the resistance line. Moreover, the daily RSI has moved above 50, in what is considered a sign of a bullish trend.
If the upward movement continues, the next closest resistance area would be at $27.
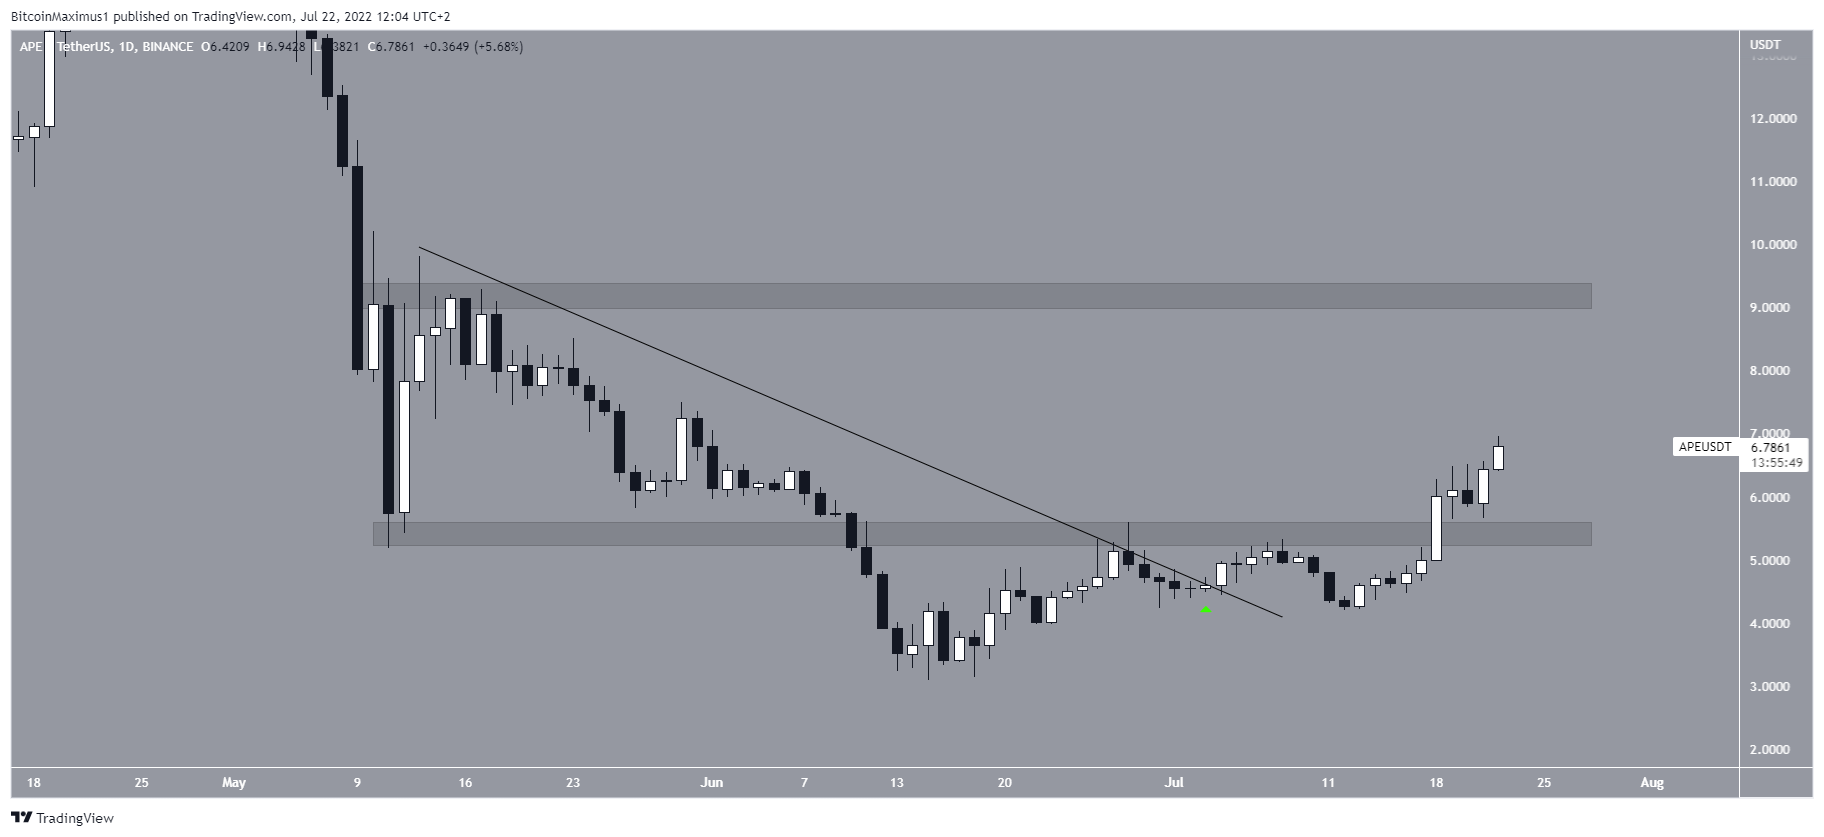
APE
APE has been moving upwards since June 15 and broke out from a descending resistance line on July 3 (green icon). After a slight retracement, it resumed its upward movement and reclaimed the $5.40 horizontal area on July 18.
If the upward movement continues, the next closest resistance would be at $9.25.
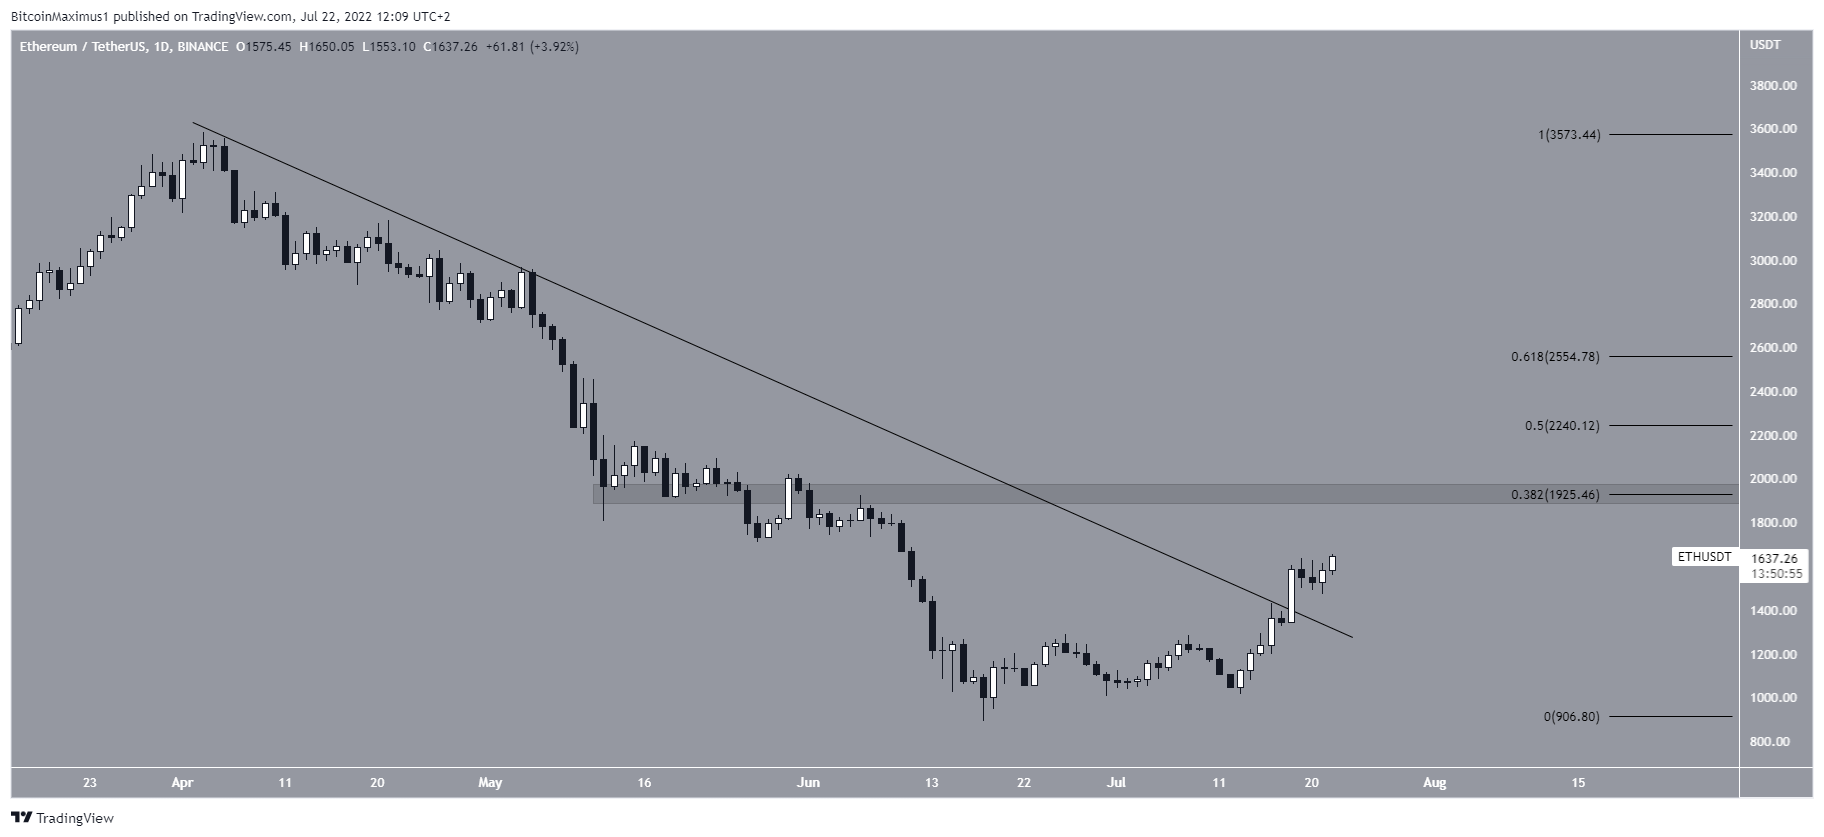
ETH
ETH has been moving upwards since June 18, and broke out from a descending resistance line on July 18.
If the upward movement continues, the closest resistance would be at $1,925. This is the 0.382 Fib retracement resistance level and a horizontal resistance area.
The long-term wave count also indicates that a bottom has been reached, thus supporting the continuation of the upward movement.
For Be[in]Crypto’s latest Bitcoin (BTC) analysis, click here
