

Be[in]Crypto takes a look at the five cryptocurrencies that increased the most from March 18 to 25.
These cryptocurrencies are:
- Ethereum Classic (ETC) : 79.31%
- Loopring (LRC) : 55.95%
- Axie Infinity (AXS) : 47.91%
- Qtum (QTUM) : 45.68%
- Cardano (ADA) : 36.99%
ETC
ETC had been decreasing alongside a descending resistance line since Sept 6. This led to a low of $21.20 on Jan 22.
ETC has been moving upwards since and broke out from the resistance line on March 18. Two days later, it managed to reclaim the $35 horizontal area, which was a crucial resistance level.
Currently, ETC is attempting to break out from the 0.5 fib retracement resistance level at $49.30. Doing so would likely accelerate the rate of increase towards $77.

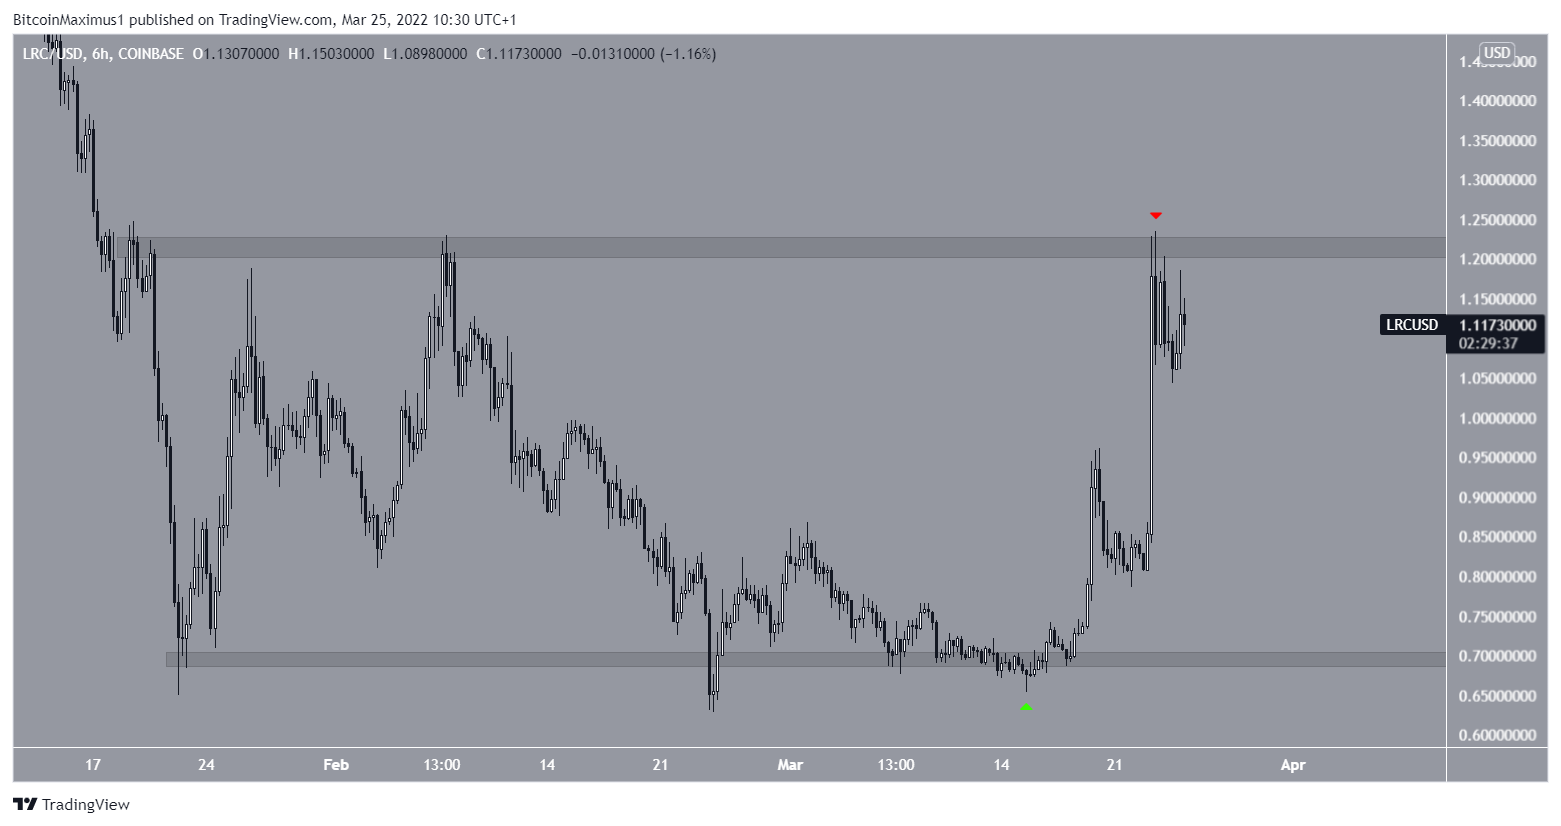
LRC
LRC has been trading in a range between $0.7 and $1.22 since Jan 20. More recently, it began an upward movement on March 15 (green icon) and reached the $1.22 resistance area on March 23 (red icon).
Despite the rapid increase, a breakout above this level would be required in order for the trend to be considered bullish.
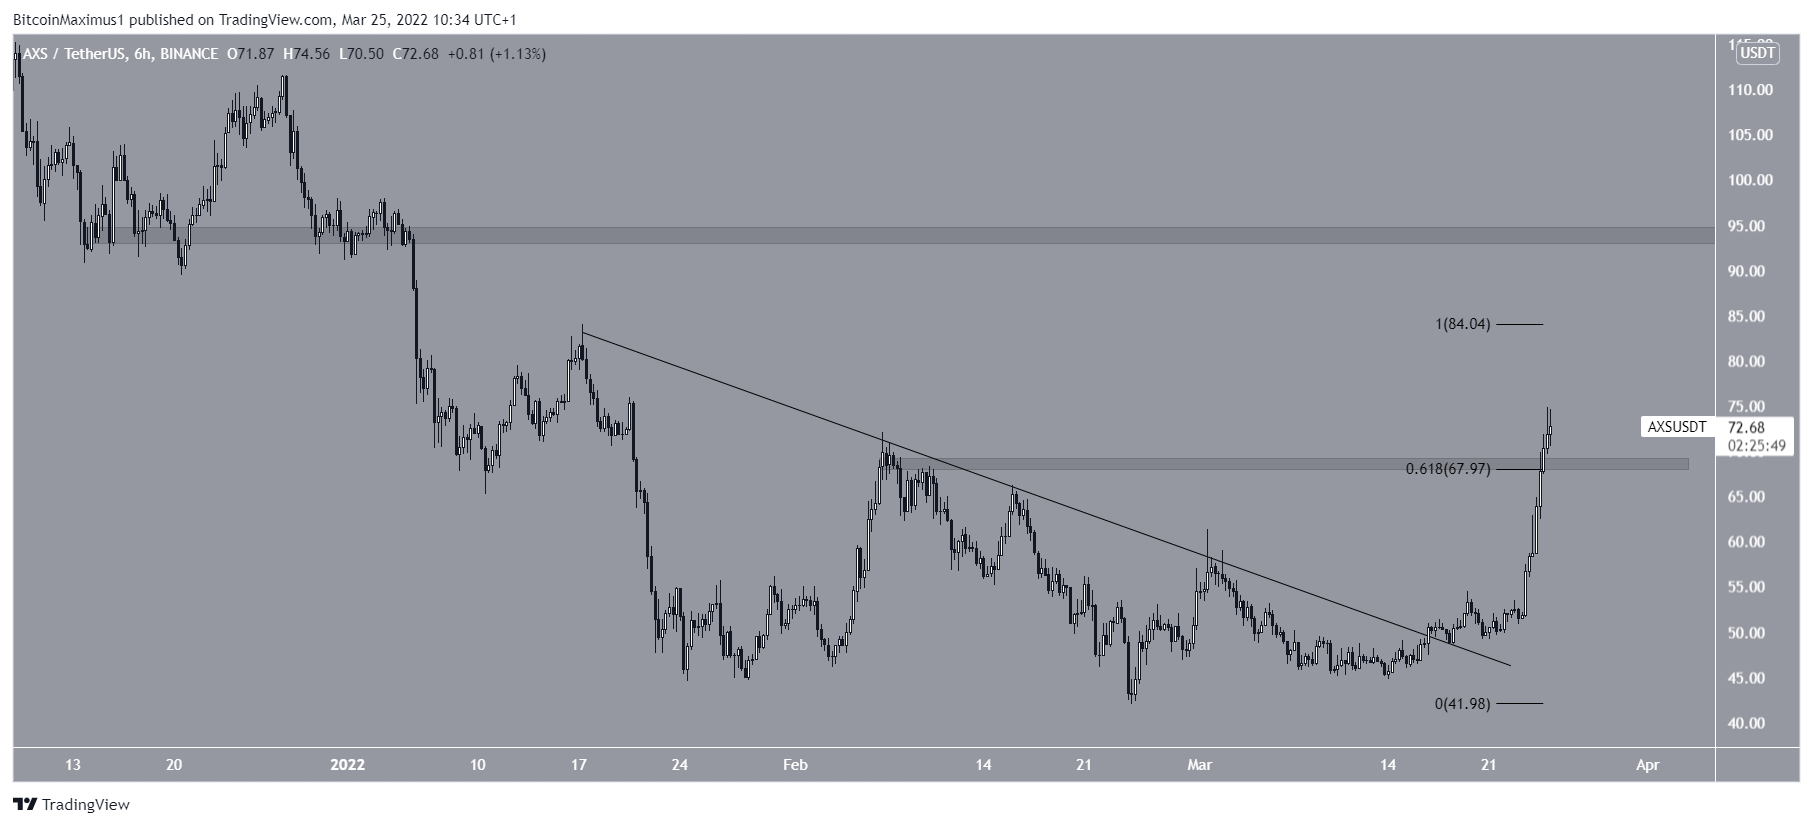
AXS
On March 16, AXS broke out from a descending resistance line that had previously been in place since Jan 17. It initiated a rapid upward movement afterwards and reclaimed the $68 resistance area on March 24.
This is an important resistance area, since it is also the 0.618 fib retracement resistance level.
If the upward movement continues, the next important resistance would be all the way at $94.
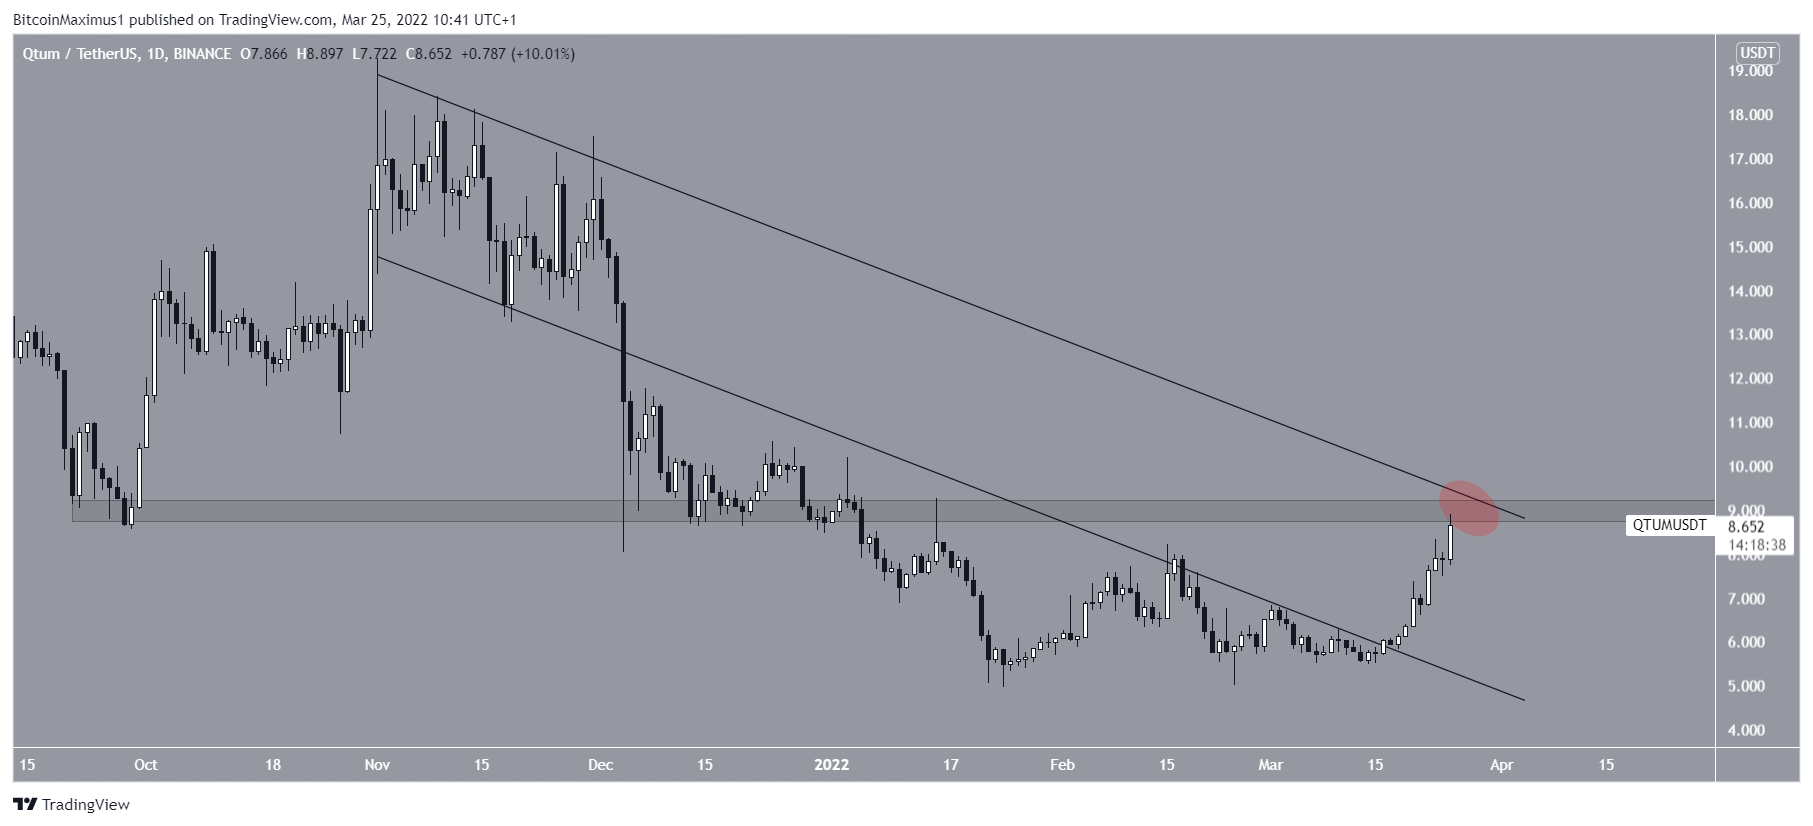
QTUM
QTUM has been moving upwards since Feb 24. So far, it hit a high of $8.90 on March 25.
However, the price has reached a confluence of resistance levels, created by the $8.80 horizontal resistance area and the resistance line of a descending parallel channel (red circle)
Until this area is reclaimed, the trend cannot be considered bullish.
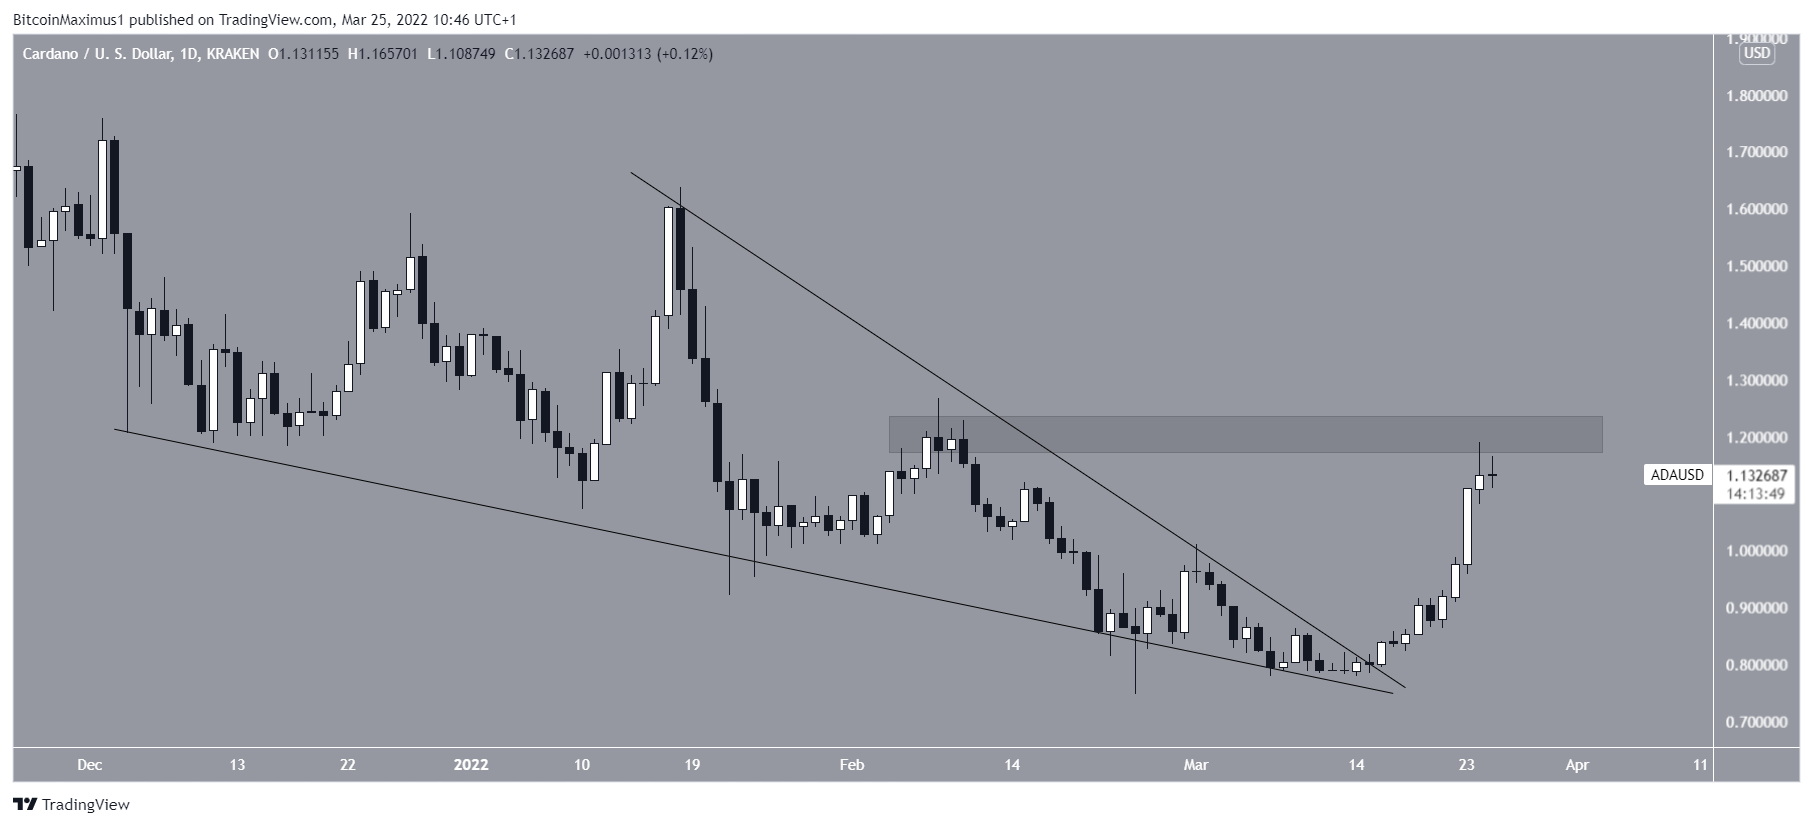
ADA
ADA had been decreasing inside a descending wedge since Dec 4. The downward movement led to a low of $0.74 on Feb 24.
However, ADA broke out on March 18 and has been moving upwards since. So far, it has reached a high of $1.19 on March 24.
Currently, ADA is attempting to break out from the $1.21 horizontal resistance area. Doing so would be expected to accelerate the rate of increase.
For BeInCrypto’s latest Bitcoin (BTC) analysis, click here
Disclaimer
In line with the Trust Project guidelines, this price analysis article is for informational purposes only and should not be considered financial or investment advice. BeInCrypto is committed to accurate, unbiased reporting, but market conditions are subject to change without notice. Always conduct your own research and consult with a professional before making any financial decisions. Please note that our Terms and Conditions, Privacy Policy, and Disclaimers have been updated.
