
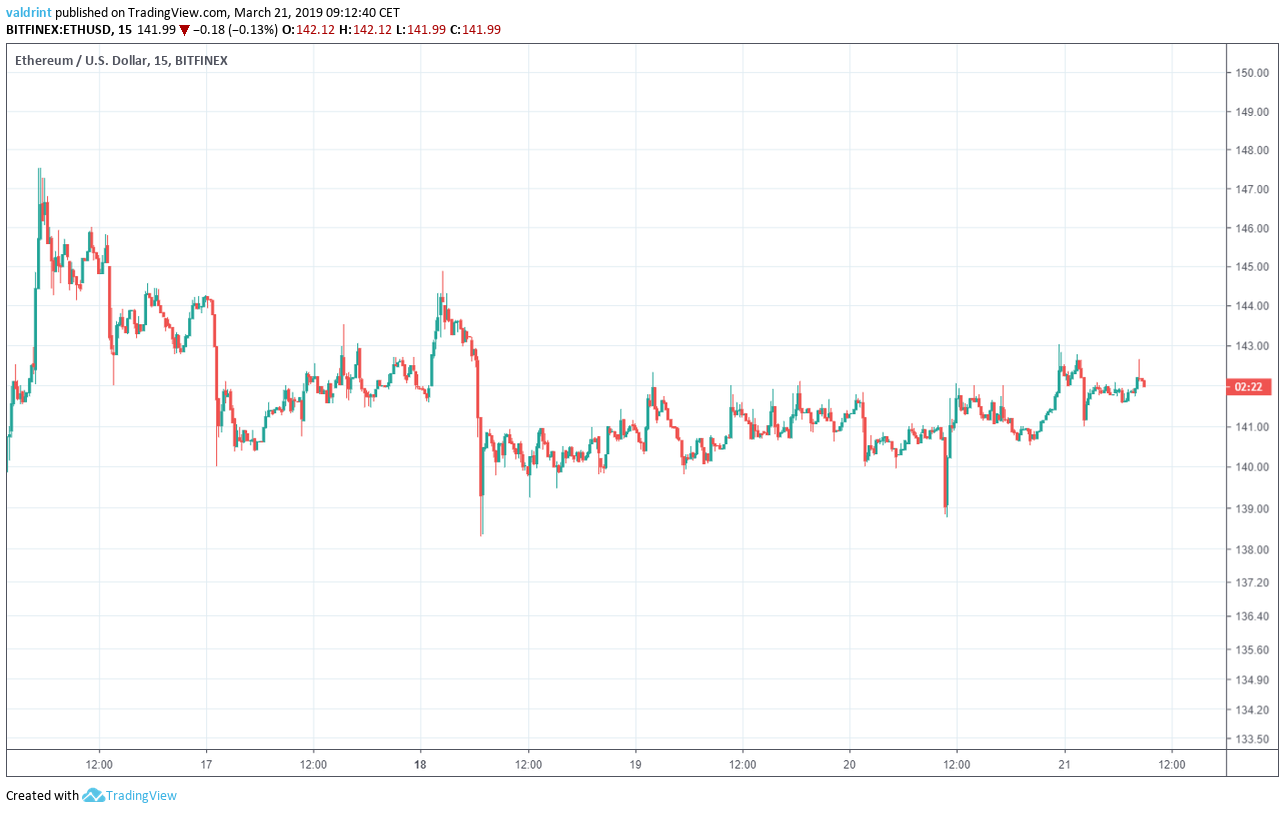
On Mar 16, 2019, Ethereum (ETH) reached a high of nearly $148. A gradual downtrend followed. Since reaching a low of almost $138 on Mar 18, it has been slowly increasing.
Will this increase continue? How high will Ethereum get?
Ethereum (ETH): Trends and Highlights for March 21, 2019
- The price of Ethereum has been on an uptrend since Mar 18.
- It recently broke out of a symmetrical triangle.
- There are resistance areas near $153 and $145.
- There are support areas near $134 and $128.
- There is short-term bearish divergence developing in the RSI.
Previous Breakout
The price of ETH on Bitfinex was analyzed at fifteen-minute intervals from Mar 16 to Mar 21. On Mar 16, the price reached a high of $147.50. Since then, several market cycles have been completed—with each high being lower than the previous one. Tracing these highs gives us a descending resistance line. The price made a low of $138.30 on Mar 18 before immediately rebounding to $139.30. Since then, a gradual uptrend followed with each low being slightly higher than the preceding one. Tracing these lows gives us an ascending support line.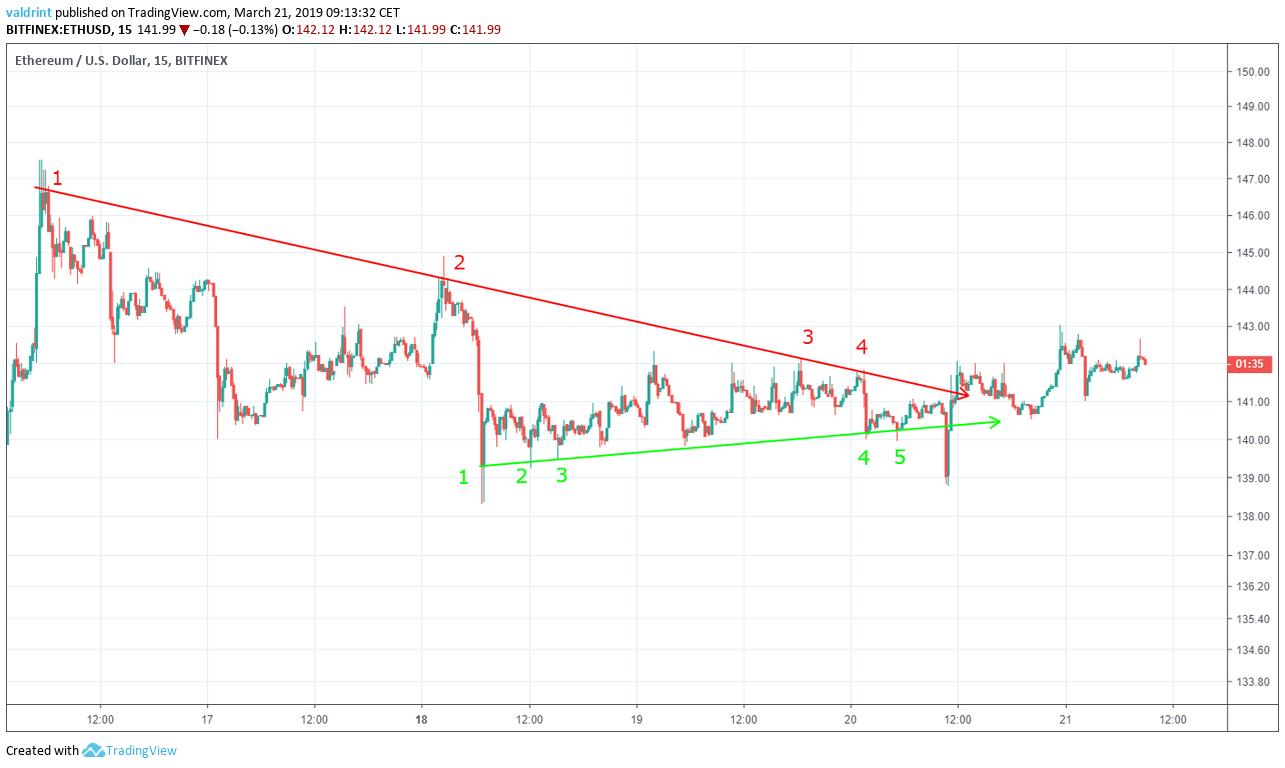
Ascending Channel
On Mar 19, the price made a high of $142.34. Since then, it has been making slightly higher highs. Tracing these highs gives us an ascending resistance line.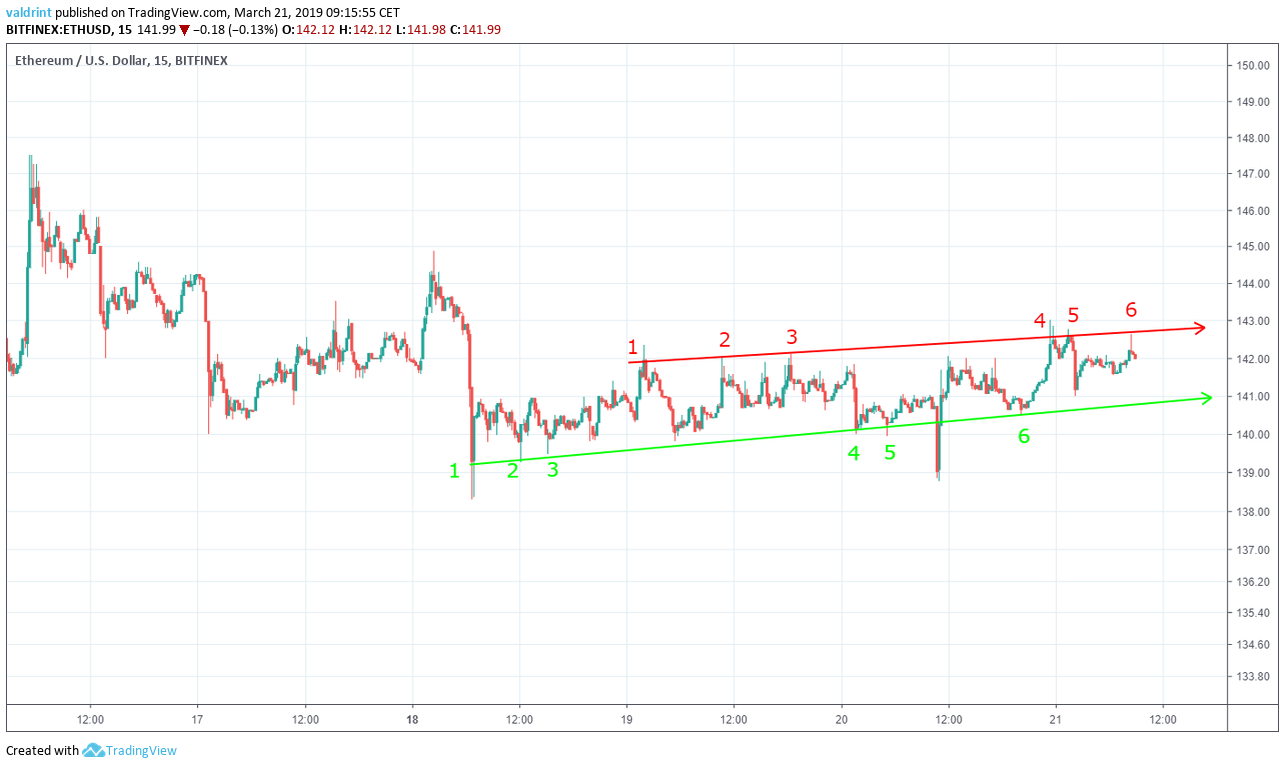 The resistance line can act as a ceiling to price, preventing further upward movement. It theoretically traces the upper limits of price movement.
Combined with the support line found in the previous section, it creates an ascending channel. TPrice is likely to trade within this channel for the foreseeable future with new highs and lows experienced.
Both are expected to grow successively larger as price continues to increase at the rate determined by channel. is a neutral pattern, making price increases and decreases equally likely.
It is likely that the price moves inside the confines of the channel until a decisive upward or downward move occurs. The channel alone is not sufficient in attempting to predict when that move will occur.
The resistance line can act as a ceiling to price, preventing further upward movement. It theoretically traces the upper limits of price movement.
Combined with the support line found in the previous section, it creates an ascending channel. TPrice is likely to trade within this channel for the foreseeable future with new highs and lows experienced.
Both are expected to grow successively larger as price continues to increase at the rate determined by channel. is a neutral pattern, making price increases and decreases equally likely.
It is likely that the price moves inside the confines of the channel until a decisive upward or downward move occurs. The channel alone is not sufficient in attempting to predict when that move will occur.
Looking Out For Divergence
Combining the relative strength index (RSI) bullish/bearish divergence with support/resistance essentially predicts future price fluctuations. RSI is an indicator which calculates the size of price changes to highlight oversold or overbought conditions in the market. On Mar 20, the price made a high of $143.02. It revisited the same level two other times. Similarly, the RSI made the first high on Mar 20 and has created lower highs since.
This is known as bearish divergence and often precedes price decreases.
However, the divergence is rather insignificant and has occurred in a neutral trading pattern. Given that former trading patterns may not be accurate indicators of future price, we can only say that price decreases are possible—but not certain.
One possible situation would include continued movement within the channel followed by a breakdown below the current support. However, such price decreases would likely lead to higher lows than previously experienced. Such an occurrence might generate new resistance or support lines.
On Mar 20, the price made a high of $143.02. It revisited the same level two other times. Similarly, the RSI made the first high on Mar 20 and has created lower highs since.
This is known as bearish divergence and often precedes price decreases.
However, the divergence is rather insignificant and has occurred in a neutral trading pattern. Given that former trading patterns may not be accurate indicators of future price, we can only say that price decreases are possible—but not certain.
One possible situation would include continued movement within the channel followed by a breakdown below the current support. However, such price decreases would likely lead to higher lows than previously experienced. Such an occurrence might generate new resistance or support lines.
Resistance and Support Areas
The price of ETH on Bitfinex was analyzed at two-hour intervals from Feb 18 to Mar 21 to determine possible future resistance and support areas in the case of a breakout or breakdown situation.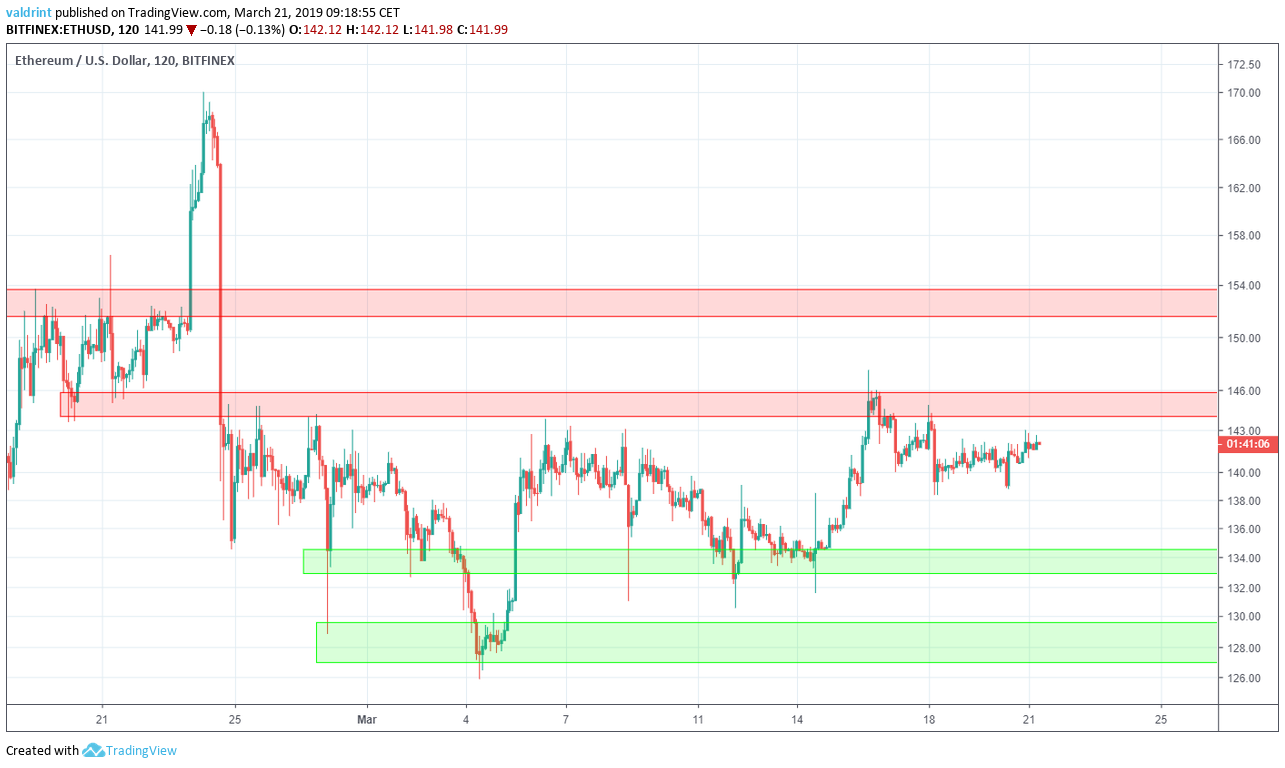 Resistance and support areas are created when the price revisits the same level several times.
The first resistance area is located near $145. It was validated when an unsuccessful breakout attempt occurred on Mar 15. A second resistance area is found near $153. If the price were to break out of the channel, these two would provide likely reversal areas. Further price increases could lead to prices close to $145 in the not-too-distant future.
The closest support area is found near $134, with the second being found at $128. According to our analysis, it is unlikely that the price will reach this level in the near future.
Resistance and support areas are created when the price revisits the same level several times.
The first resistance area is located near $145. It was validated when an unsuccessful breakout attempt occurred on Mar 15. A second resistance area is found near $153. If the price were to break out of the channel, these two would provide likely reversal areas. Further price increases could lead to prices close to $145 in the not-too-distant future.
The closest support area is found near $134, with the second being found at $128. According to our analysis, it is unlikely that the price will reach this level in the near future.
Summary of Analysis
Based on this analysis, the price of ETH may decrease slightly and consolidate inside the confines of the channel. It could also breakdown below support before a reversal leads to new price increases. If the price touches the support line, this prediction will be validated. This prediction would be invalidated by a breakout above the resistance line of the channel. Do you think ETH will experience significant movement? Let us know your thoughts in the comments below. Disclaimer: This article is not trading advice and should not be construed as such. Always consult a trained financial professional before investing in cryptocurrencies, as the market is particularly volatile.
Top crypto projects in the US | April 2024
Trusted
Disclaimer
In line with the Trust Project guidelines, this price analysis article is for informational purposes only and should not be considered financial or investment advice. BeInCrypto is committed to accurate, unbiased reporting, but market conditions are subject to change without notice. Always conduct your own research and consult with a professional before making any financial decisions. Please note that our Terms and Conditions, Privacy Policy, and Disclaimers have been updated.

Valdrin Tahiri
Valdrin discovered cryptocurrencies while he was getting his MSc in Financial Markets from the Barcelona School of Economics. Shortly after graduating, he began writing for several different cryptocurrency related websites as a freelancer before eventually taking on the role of BeInCrypto's Senior Analyst.
(I do not have a discord and will not contact you first there. Beware of scammers)
READ FULL BIO
Sponsored
Sponsored