
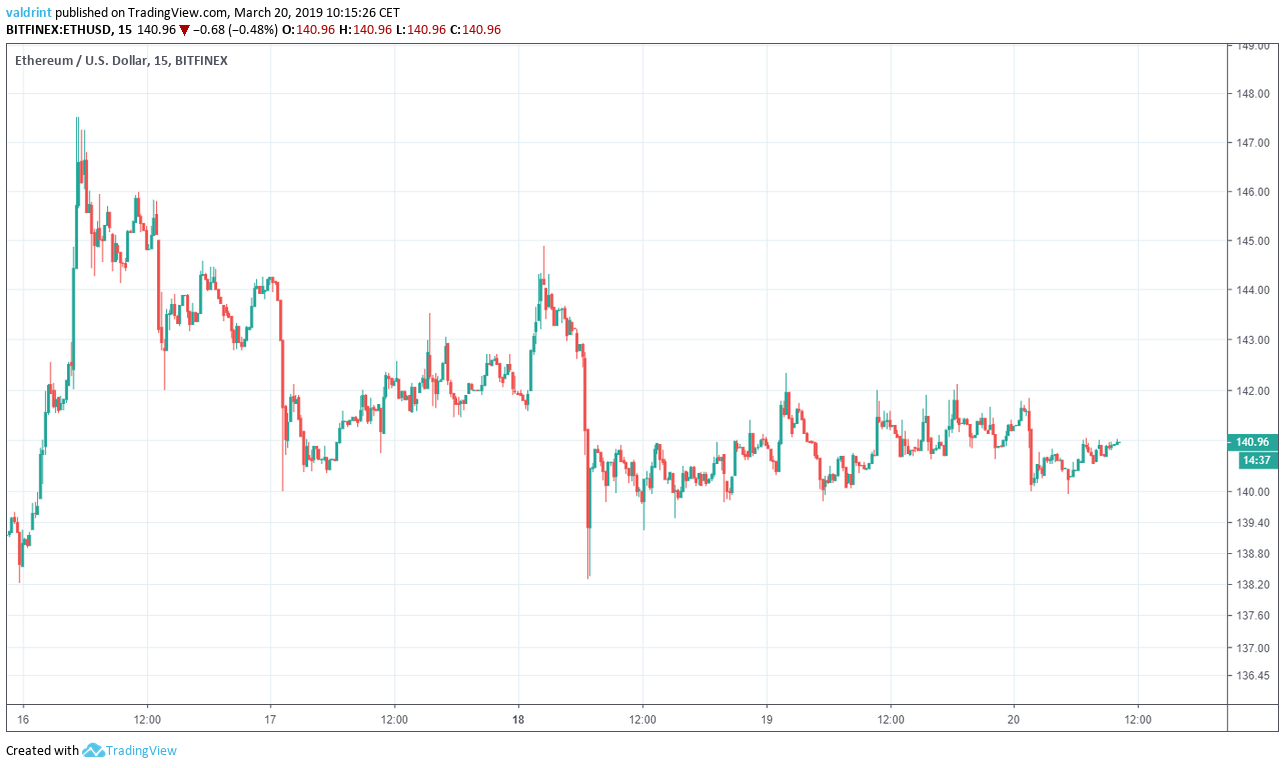
On Mar 16, 2019, Ethereum (ETH) reached a high of nearly $148. Since then, it has been on a gradual downtrend—alternating between gradual and sharp downward moves. However, the price has been showing signs of strength recently.
Is Ethereum about to make a reversal? Can we expect highs for ETH in the near future?
Before we answer these questions, let’s first take a look at Ethereum’s prices between Mar 16 and 20:
 In our Mar 19 analysis of ETH, we predicted that Ethereum’s price might drop to support before eventually initiating a breakout above resistance. While the price did not drop all the way to the support line, a slight decrease was observed. This seems to suggest partial validation of our prediction.
Based on today’s analysis, we believe Ethereum’s price could very soon break out of the resistance line leading to increased prices.
If you’re curious about how we made this prediction, check out our analysis below:
In our Mar 19 analysis of ETH, we predicted that Ethereum’s price might drop to support before eventually initiating a breakout above resistance. While the price did not drop all the way to the support line, a slight decrease was observed. This seems to suggest partial validation of our prediction.
Based on today’s analysis, we believe Ethereum’s price could very soon break out of the resistance line leading to increased prices.
If you’re curious about how we made this prediction, check out our analysis below:
Ethereum (ETH): Trends and Highlights for March 20, 2019
- The price of Ethereum has been on a downward trend since March 16.
- ETH has been trading inside a short-term symmetrical triangle.
- There are resistance areas near $153 and $145.
- There are support areas near $134 and $128.
- There is short-term bullish divergence developing in the RSI.
Tracing Support
The price of ETH on Bitfinex was analyzed at fifteen-minute intervals from Mar 16 to Mar 20. On Mar 16, the price reached a high of $147.5. It has been on a downtrend since. Several market cycles have been completed, with each high being lower than the previous one. Tracing these highs gives us a descending resistance line.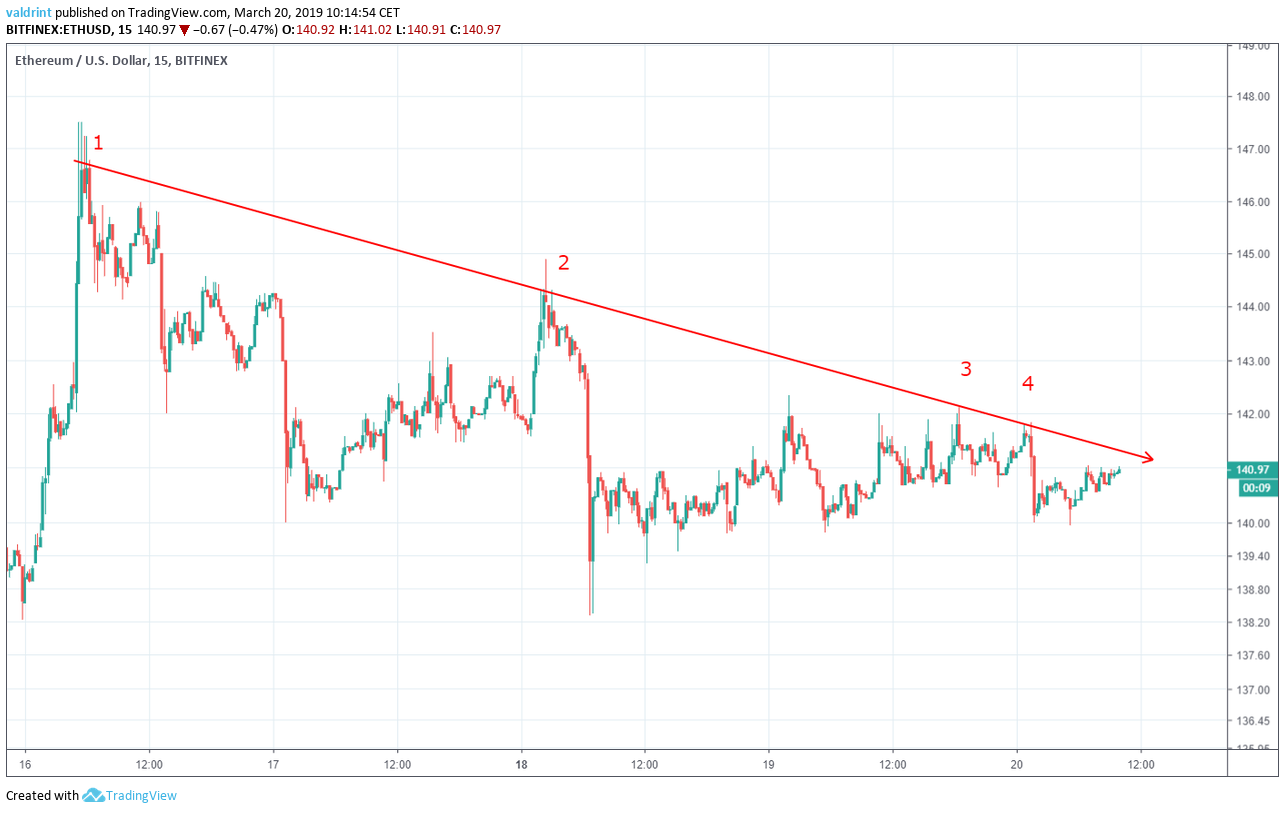 The resistance line can act as a ceiling to price. It should theoretically trace the upper limits of price over a period of time. It also serves to measure the price’s rate of decrease.
Ethereum’s price has decreased at the same rate as predicted by the resistance line. On Mar 17, however, a rapid decrease was initiated right after price touched the resistance line.
Furthermore, when price touched the resistance line on Mar 19 and Mar 20, the price decreases were smaller—indicating that ETH may not be following previous patterns.
It is likely that the price keeps decreasing at the same rate as predicted by the line—unless a breakout occurs. The resistance line alone is not sufficient in determining if a breakout will occur. However, if observed patterns are no longer trustworthy, these predictions may not be entirely accurate. We will have to assess the accuracy of Ethereum’s trading patterns in this and future analyses of the cryptoasset.
The resistance line can act as a ceiling to price. It should theoretically trace the upper limits of price over a period of time. It also serves to measure the price’s rate of decrease.
Ethereum’s price has decreased at the same rate as predicted by the resistance line. On Mar 17, however, a rapid decrease was initiated right after price touched the resistance line.
Furthermore, when price touched the resistance line on Mar 19 and Mar 20, the price decreases were smaller—indicating that ETH may not be following previous patterns.
It is likely that the price keeps decreasing at the same rate as predicted by the line—unless a breakout occurs. The resistance line alone is not sufficient in determining if a breakout will occur. However, if observed patterns are no longer trustworthy, these predictions may not be entirely accurate. We will have to assess the accuracy of Ethereum’s trading patterns in this and future analyses of the cryptoasset.
Symmetrical Triangle
The price made a low of $138.30 on Mar 18 before rebounding close to prices around $139.30. Since then, a gradual uptrend can be observed with each low being slightly higher than the preceding one. Tracing these lows gives us an ascending support line.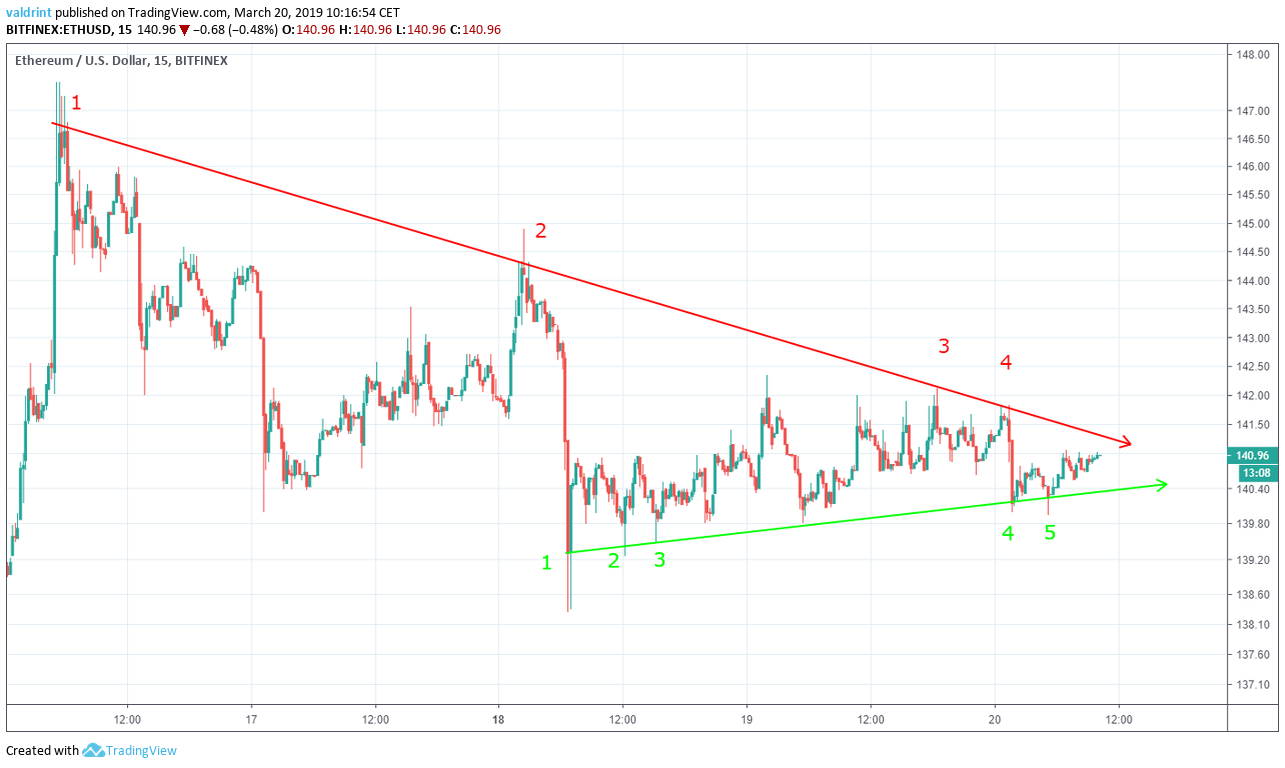
Looking Out For Divergence
Combining the relative strength index (RSI) bullish/bearish divergence with support/resistance essentially predicts future price fluctuations. RSI is an indicator which calculates the size of the changes in price in order to determine oversold or overbought conditions in the market.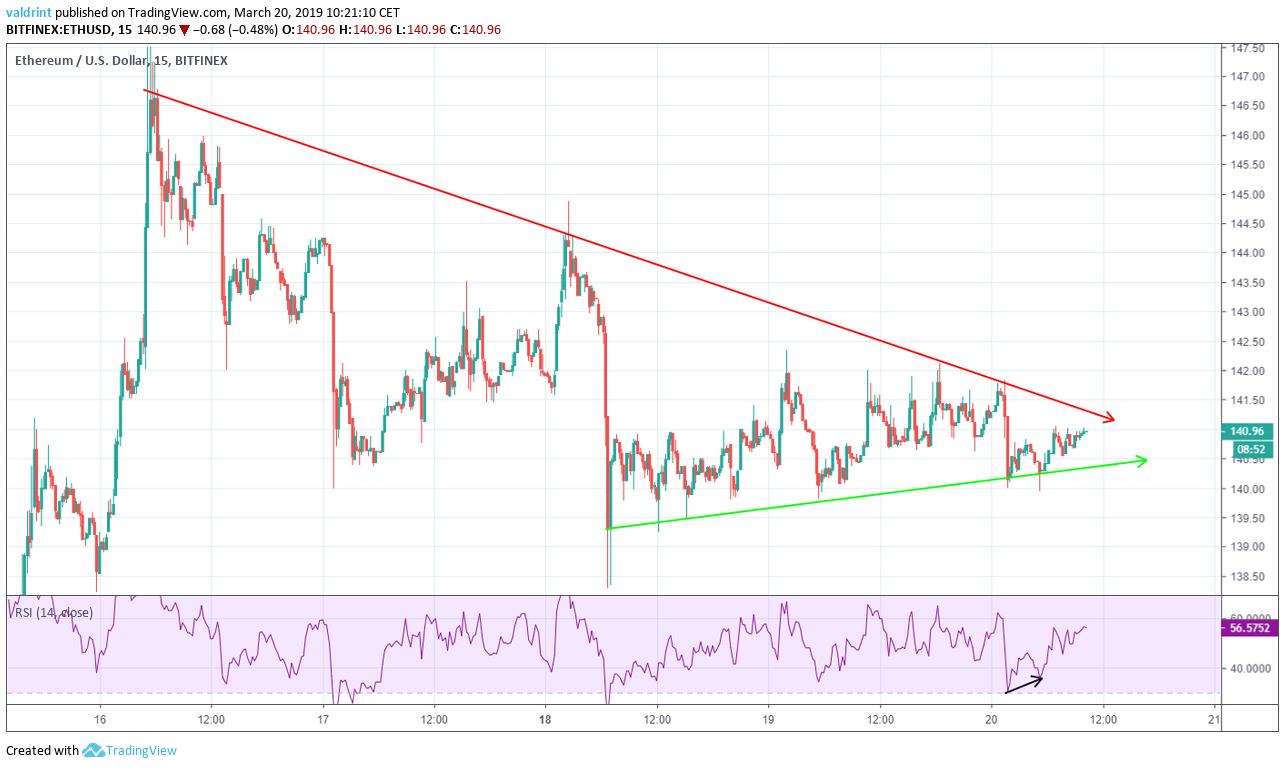 On Mar 20, the price made a low of $140.84. It revisited the same level several hours later.
Similarly, the RSI made the first low on Mar 20. However, it has continued to create higher lows since. This is known as bullish divergence and often precedes price increases.
However, it is not very large and it has occurred in a neutral trading pattern. Given that former trading patterns may not be accurate indicators of future price, we can only say that price increases are possible—but not certain.
At this rate, it is possible that the price will break out of the triangle on the next attempt as price begins to increase. We believe this is the most likely scenario, but the current indicators are not conclusive. Consolidation within the triangle may continue for the foreseeable future. A breakdown may also be possible—though we believe this is less likely than a breakout.
On Mar 20, the price made a low of $140.84. It revisited the same level several hours later.
Similarly, the RSI made the first low on Mar 20. However, it has continued to create higher lows since. This is known as bullish divergence and often precedes price increases.
However, it is not very large and it has occurred in a neutral trading pattern. Given that former trading patterns may not be accurate indicators of future price, we can only say that price increases are possible—but not certain.
At this rate, it is possible that the price will break out of the triangle on the next attempt as price begins to increase. We believe this is the most likely scenario, but the current indicators are not conclusive. Consolidation within the triangle may continue for the foreseeable future. A breakdown may also be possible—though we believe this is less likely than a breakout.
Resistance and Support Areas
The price of ETH on Bitfinex was analyzed at two-hour intervals from Feb 18 to Mar 18 to determine possible future resistance and support areas in the case of a breakout or breakdown situation.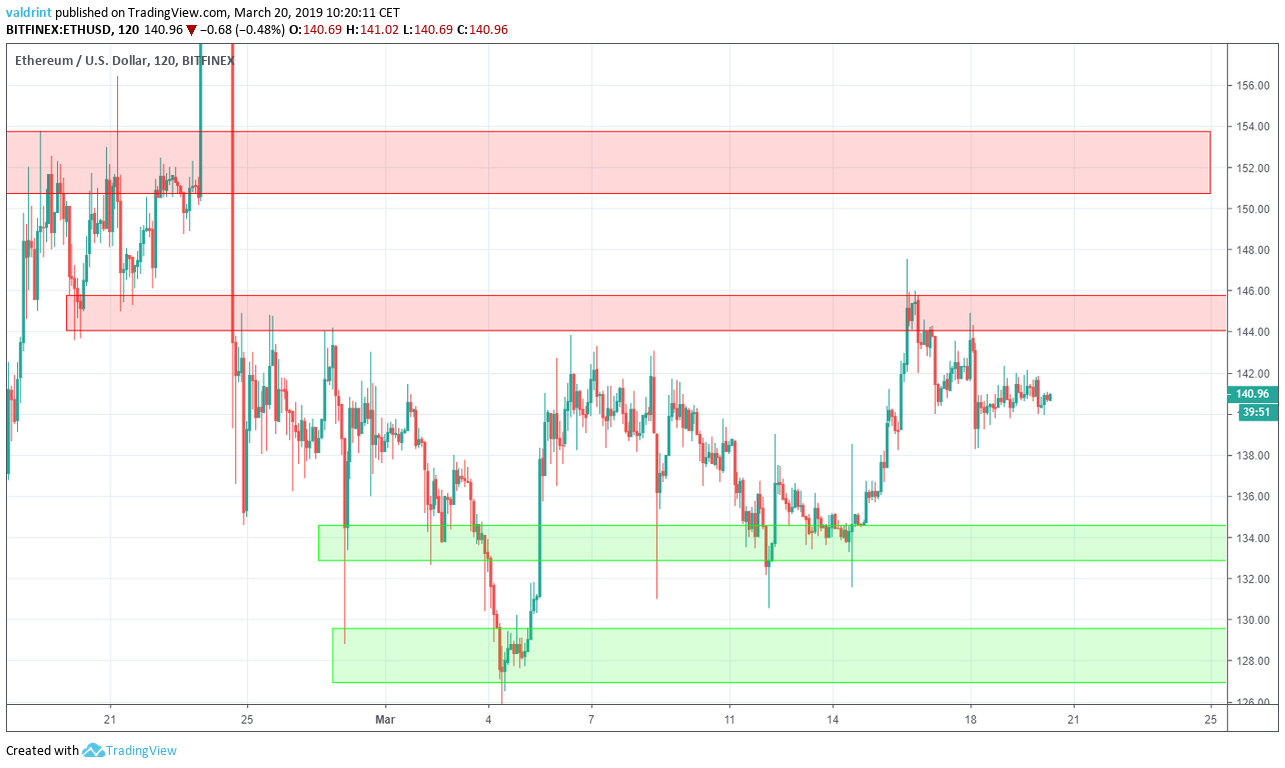 Resistance and support areas are created when the price revisits the same level several times.
The first resistance area is located near $145. It was validated when an unsuccessful breakout attempt occurred on Mar 15. A second resistance area is found near $153. If the price were to break out of the channel, these two would provide likely reversal areas. A breakout above resistance could lead to prices close to $145.
The closest support area is found near $134, with the second being found at $128. According to our analysis, it is unlikely that the price will reach this level in the near future.
Resistance and support areas are created when the price revisits the same level several times.
The first resistance area is located near $145. It was validated when an unsuccessful breakout attempt occurred on Mar 15. A second resistance area is found near $153. If the price were to break out of the channel, these two would provide likely reversal areas. A breakout above resistance could lead to prices close to $145.
The closest support area is found near $134, with the second being found at $128. According to our analysis, it is unlikely that the price will reach this level in the near future.
Summary of Analysis
Based on this analysis, the price of ETH may break out of the triangle during the next few days—though if patterns continue changing and RSI fails to be an accurate predictor of future value, this prediction might be invalidated. However, if the price breaks out today, the prediction will be fully validated. If it keeps trading inside the triangle and then breaks out, it will be partially validated. This prediction would be fully invalidated by a breakdown below support. Do you think a breakout will occur today or will Ethereum keep trading within the confines of the triangle? Let us know your thoughts in the comments below. Disclaimer: This article is not trading advice and should not be construed as such. Always consult a trained financial professional before investing in cryptocurrencies, as the market is particularly volatile.Disclaimer
In line with the Trust Project guidelines, this price analysis article is for informational purposes only and should not be considered financial or investment advice. BeInCrypto is committed to accurate, unbiased reporting, but market conditions are subject to change without notice. Always conduct your own research and consult with a professional before making any financial decisions. Please note that our Terms and Conditions, Privacy Policy, and Disclaimers have been updated.

Valdrin Tahiri
Valdrin discovered cryptocurrencies while he was getting his MSc in Financial Markets from the Barcelona School of Economics. Shortly after graduating, he began writing for several different cryptocurrency related websites as a freelancer before eventually taking on the role of BeInCrypto's Senior Analyst.
(I do not have a discord and will not contact you first there. Beware of scammers)
READ FULL BIO
Sponsored
Sponsored