See More

A Bearish Ethereum Drops Toward $150 After April Bulls (ETH/USD Price Prediction for 04.04.2019)

3 mins
Updated by Alexander Fred
Join our Trading Community on Telegram

At BeInCrypto, we offer regular price analyses and predictions of the most popular and relevant cryptoassets. In our Apr 3 analysis of Ethereum (ETH) we predicted that the price would fall to the first and possibly the second support areas we defined below. Our prediction was validated on Apr 4.

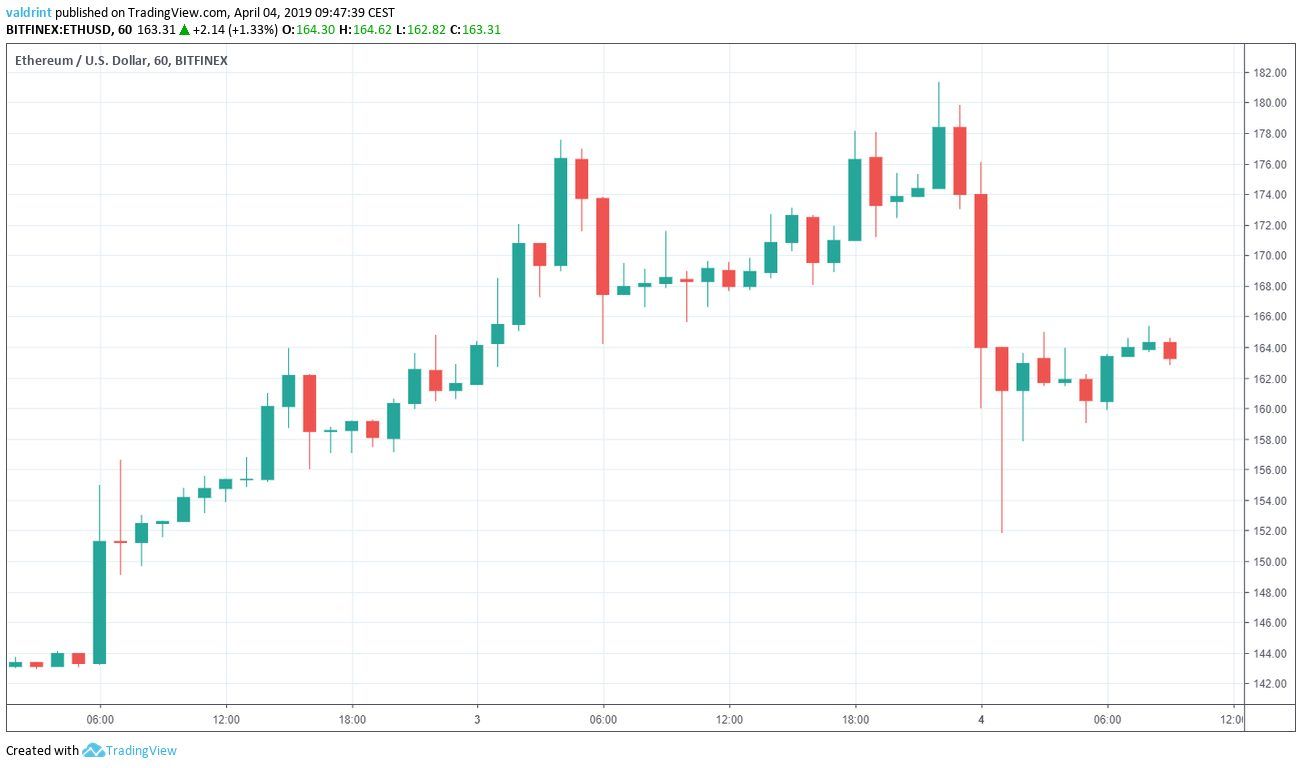
On Apr 2, 2019 the price of Ethereum (ETH) made an hourly low of $143.17. A sharp upward move ensued. Ethereum reached a high of $181 on Apr 4 before dropping to a low of $151.82. Is Ethereum going to drop below $150? Let’s find out.
Ethereum Market Outlook
Ethereum (ETH) Prices: Apr 2 – Apr 4

Ethereum (ETH): Trends and Highlights for April 4, 2019

  • The price of Ethereum made a rapid upward move on Apr 3.
  • ETH/USD was following a steep ascending support line.
  • Ethereum broke down from the line on Apr 3.
  • There is resistance near $168 and support areas near $154 and $144

Ascending Support

In this section, we define Ethereum’s current trading pattern by analyzing the price of ETH on Bitfinex at thirty – minute intervals from Apr 2 to Apr 4 alongside volume. Volume is a tool used by traders that measures the amount of an asset trading in a given period of time. Combined with breakouts and breakdowns it can be used to confirm the validity of a move.
On Apr 2, Ethereum reached an hourly low of $149.07. A gradual upward move followed. Several market cycles have been completed. Each low has been higher than the previous one. Tracing these lows gives us an ascending support line: Ethereum Support Line 
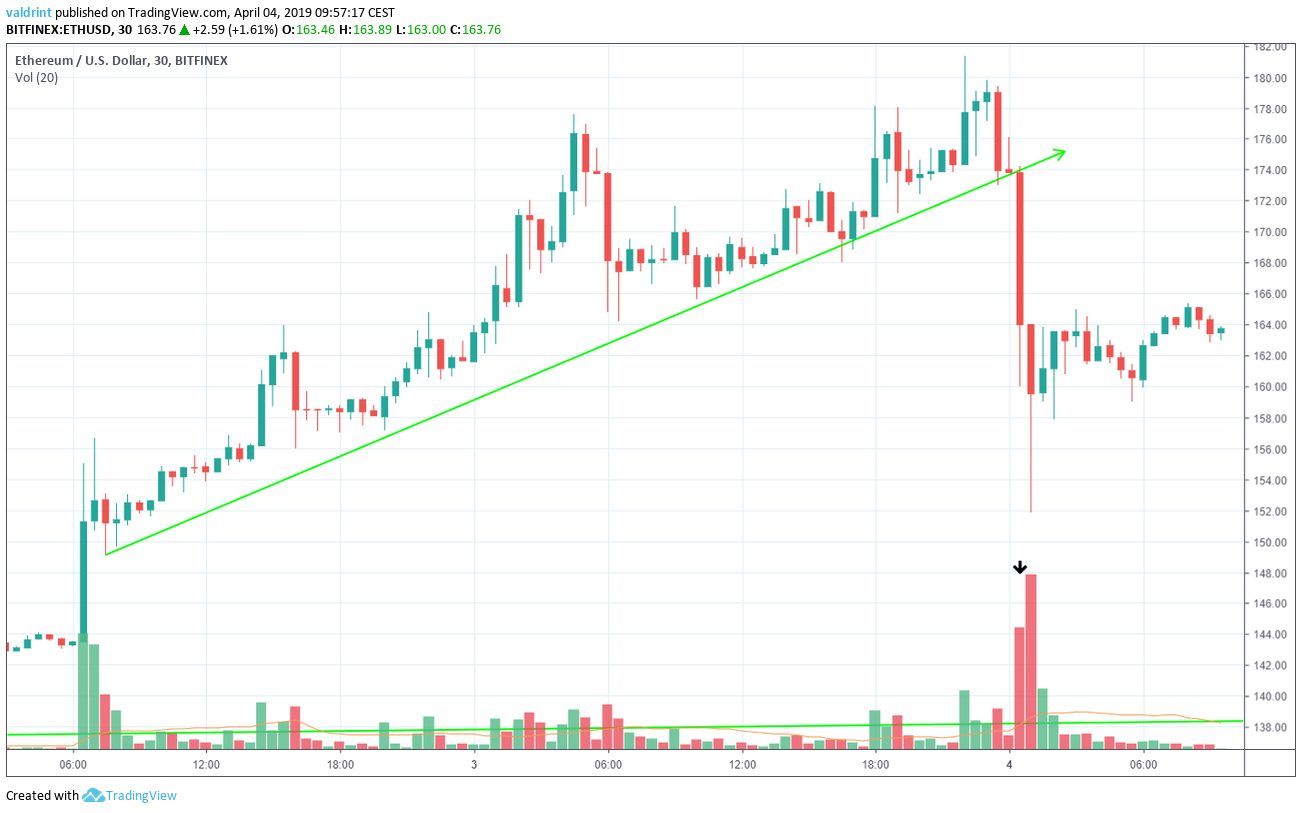
The price broke down from the support line on Apr 4. As visible in the graph, the breakdown occurred in significant volume, giving validity to the move.

Shooting Star

To better determine possible future price fluctuations, we take a look at the candlestick for Apr 3. At the close of the day, the price formed a bearish shooting star.
A shooting star is interpreted as a type of reversal candlestick preceding a falling price. It is made up of a candle with a small lower body, little or no lower wick, and a long upper wick that is at least two times the size of the lower body. It is found in an uptrend.
The shooting star candlestick for Apr 3 is seen in the graph below:
The long upper wick indicates that the buyers drove prices up during the day, but they encountered selling pressure that drove prices back down. Since this is occurring in an uptrend, the selling pressure is viewed as a potential reversal sign. Ethereum Candlestick 
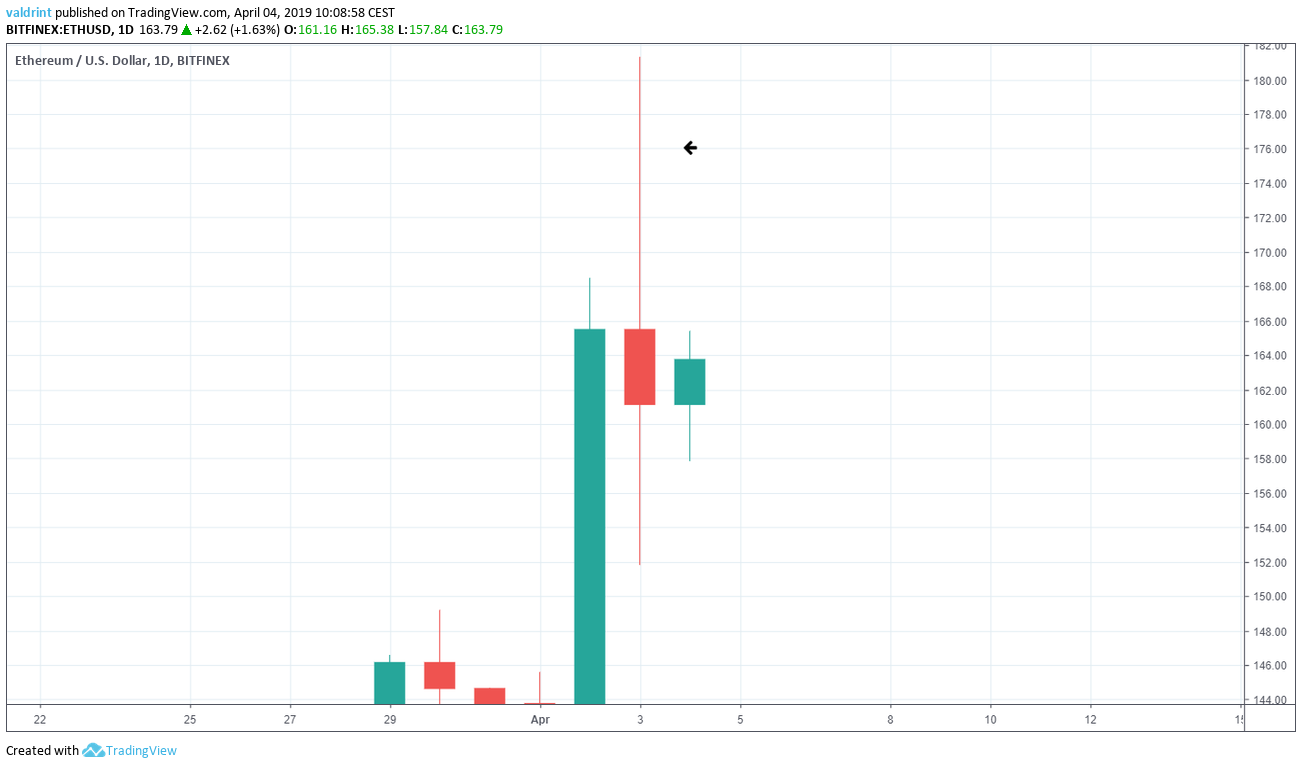
However, the long lower wick is not in agreement with the definition of the shooting star candle. This indicates that there is still buying power left. If the current daily candle is a bearish one, it would complete the pattern initiated by the shooting star candle. If however, the price closes above yesterday’s high, the pattern will be invalidated.

Reversal Areas

Support and resistance areas are created when the price revisits the same level several times. They indicate the levels price might reach in the future based on past patterns.
Ethereum Reversal 
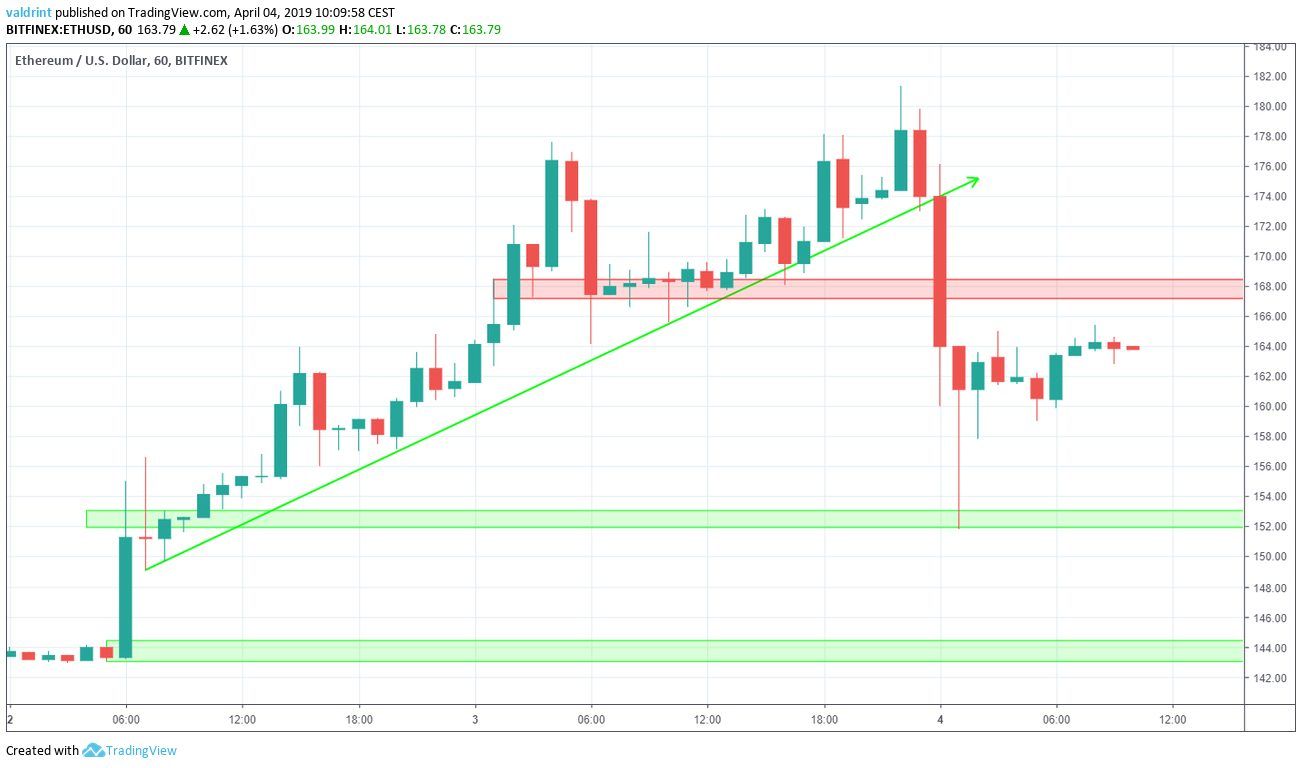
The first support area is located near $153. The second one is found near $144. Ethereum reached the first one during the low on Apr 4. The closest resistance area is found near $168. We believe that Ethereum will create a trading pattern between two of these areas, most likely $152 and $168.

Summary of Analysis

Based on this analysis, the price of ETH is likely to trade between two of the areas outlined above. Do you think ETH will drop to the support areas above?  Let us know your thoughts in the comments below.

How to Buy Bitcoin with 0 commission  

Disclaimer: This article is not trading advice and should not be construed as such. Always consult a trained financial professional before investing in cryptocurrencies, as the market is particularly volatile.
Top crypto projects in the US | April 2024

Trusted

Disclaimer

In line with the Trust Project guidelines, this price analysis article is for informational purposes only and should not be considered financial or investment advice. BeInCrypto is committed to accurate, unbiased reporting, but market conditions are subject to change without notice. Always conduct your own research and consult with a professional before making any financial decisions. Please note that our Terms and ConditionsPrivacy Policy, and Disclaimers have been updated.

Valdrin-Tahiri.jpg
Valdrin Tahiri
Valdrin discovered cryptocurrencies while he was getting his MSc in Financial Markets from the Barcelona School of Economics. Shortly after graduating, he began writing for several different cryptocurrency related websites as a freelancer before eventually taking on the role of BeInCrypto's Senior Analyst. (I do not have a discord and will not contact you first there. Beware of scammers)
READ FULL BIO
Sponsored
Sponsored