


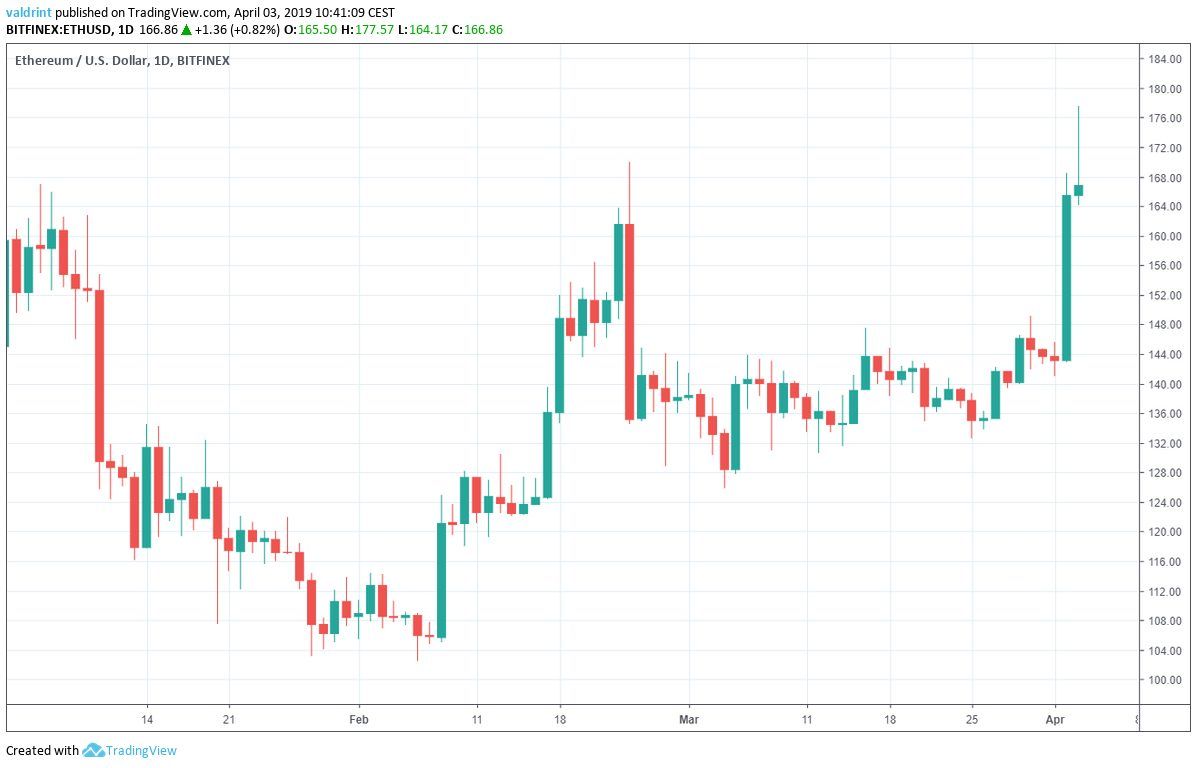
On Feb 6, 2019 the price of Ethereum (ETH) made a low of $102.49. A sharp upward move ensued two days later. This was followed by a gradual decrease.
In early April, prices spiked. While Ethereum was unable to reach $150, it reached highs over $175 on Apr 3. The price has been on an uptrend since.
At the time of writing, the highest price recorded on Apr 3 was $177.57.
Ethereum (ETH): Trends and Highlights for April 3, 2019
- The price of Ethereum has been on a gradual uptrend since Feb 6.
- ETH/USD appears to be trading within an ascending triangle.
- Ethereum’s current daily candle is a shooting star.
- Bearish divergence is developing in the MACD and the RSI.
- There are support areas near $164 and $157.
Ascending Triangle
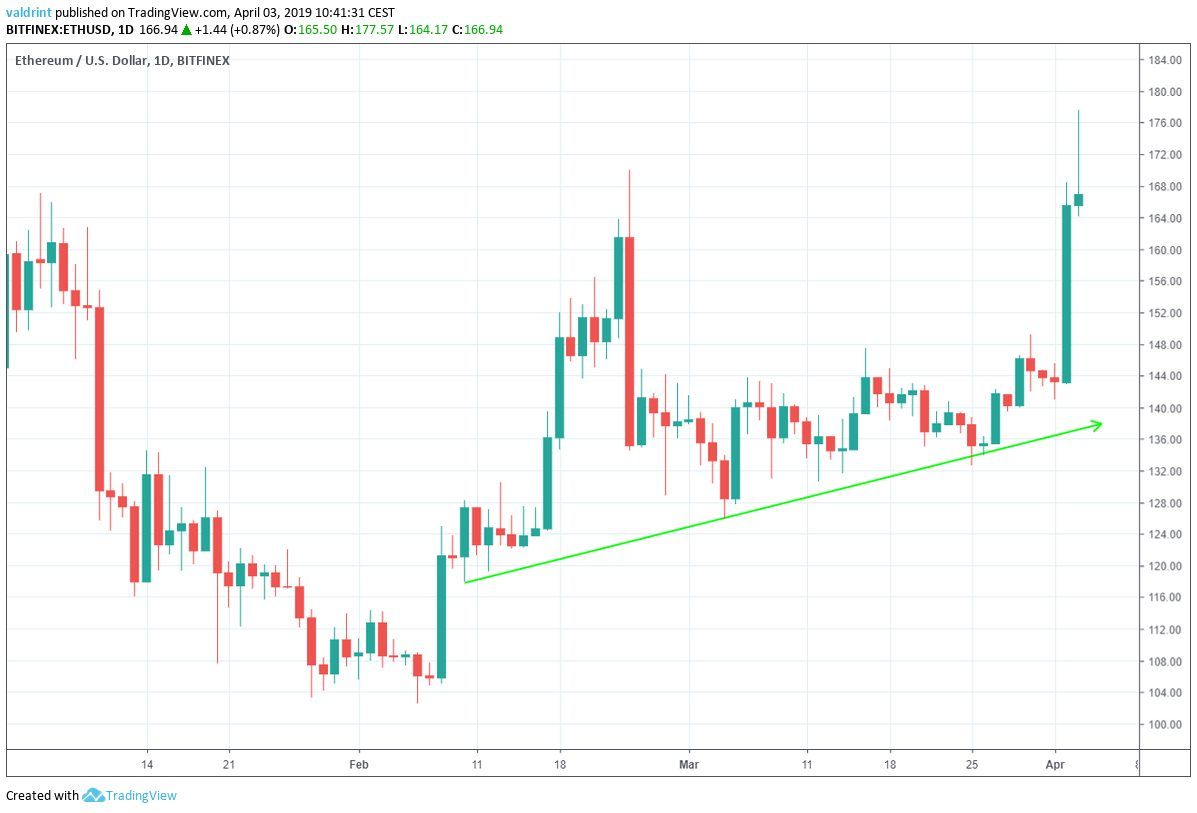
On Feb 10, Ethereum reached a low of $118. A sharp upward move followed. Several market cycles have been completed. Each low has been higher than the previous one.
Tracing these lows gives us an ascending support line:
On Jan 6, the price made a high of $167. A sharp decrease was followed by a gradual increase. At the time of writing on Apr 3, this price had been reached three times.
Tracing these highs gives us a horizontal resistance line.
The resistance and support lines combine to create an ascending triangle:
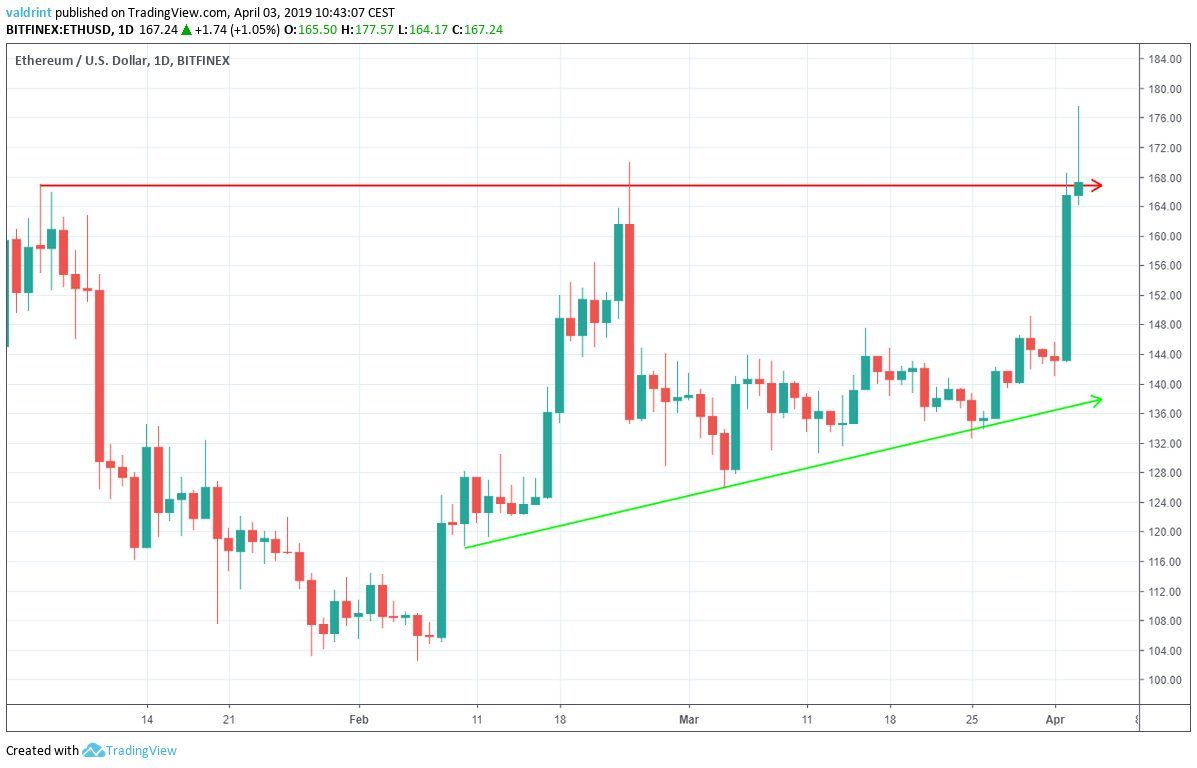
This is a bullish pattern and suggests price increases.
The price broke out on Apr 3, reaching a high of $177.57.
However, it was immediately pushed back and dropped below the resistance line. Since the breakout was not succeeded by continuous gains, it can be considered insignificant.
Price decreases toward the support line appear likely.
Shooting Star
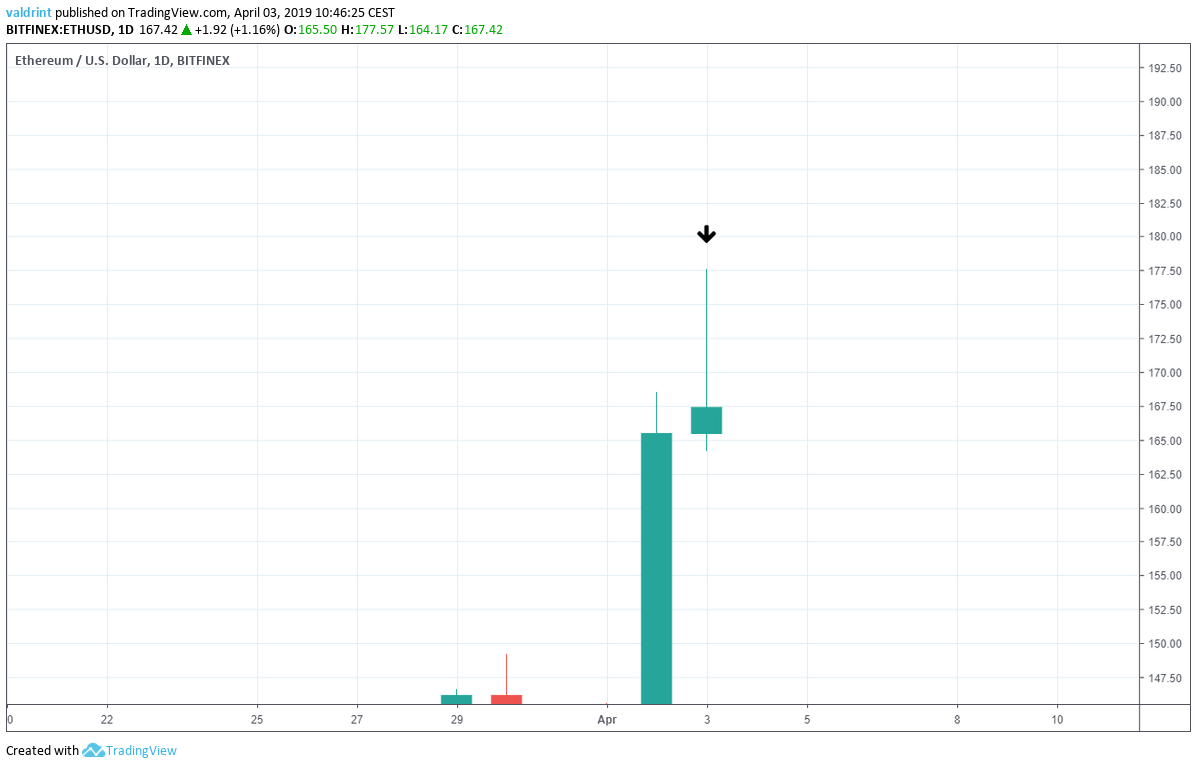
The long upper wick indicates that the buyers drove prices up during the day, but they encountered selling pressure that drove prices back down. Since this is occurring in an uptrend, the selling pressure is viewed as a potential reversal sign.
This hypothesis would gain more validity if the closing price is lower than the opening price. However, the closing price for Ethereum for Apr 3 does not exist at the time of writing. We will return to this candlestick to determine its true pattern in tomorrow’s analysis of ETH/USD.
Bearish Divergence
Since we are unable to rely on the candlestick alone to determine a reversal, we will incorporate technical indicators into our analysis. Using these we will assess possible price movements for Ethereum.
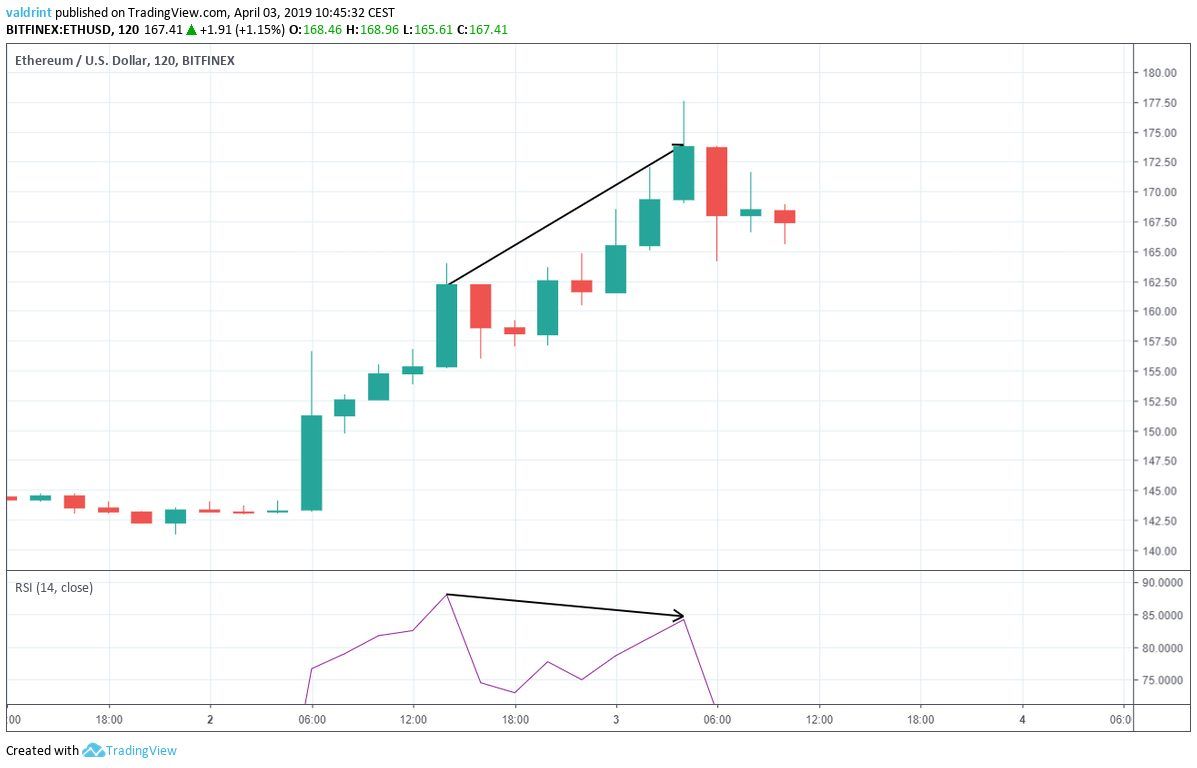
On Apr 2, the price reached a high of $163.96. It reached a higher high of $178.6 on Apr 3.
Similarly, the RSI made the first high during the same interval. However, it generated a significantly lower value on Apr 3.
This is known as bearish divergence and often precedes drops in price.
Using this indicator and the prior pattern, it is likely that the price will undergo a slight correction in the near future and drop toward support.
Reversal Areas
The price of ETH/USD at one-hour intervals from Apr 2 to Apr 3 with support areas to determine possible future prices.
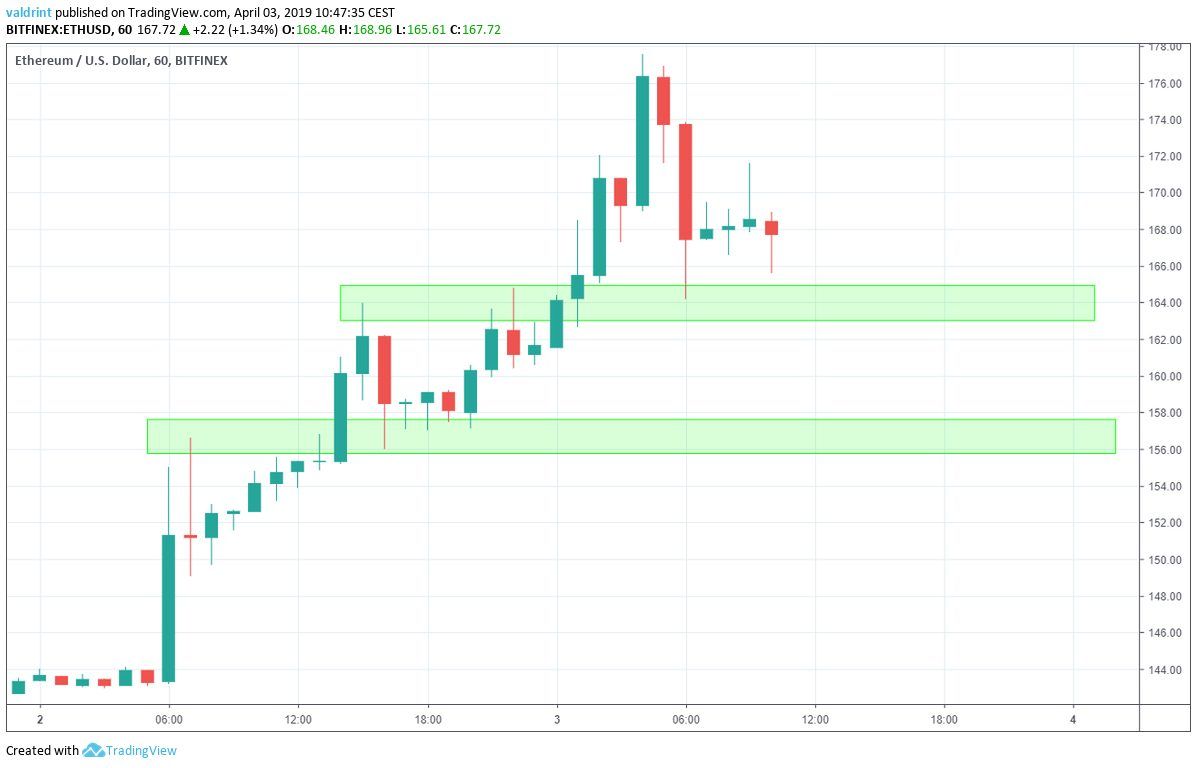
The first support area is located near $164. The second one is found near $157. We believe that Ethereum will reach at least one of these levels following a corrective period. If Ethereum drops below the second support area, a return to or below $150 in the short-term may be possible.
Summary of Analysis
Based on this analysis, the price of ETH is likely to undergo a slight correction and drop to one of the support areas outlined above.
Do you think ETH will keep increasing or begin falling? Let us know your thoughts in the comments below.
How to Buy Bitcoin with 0 commission
Disclaimer: This article is not trading advice and should not be construed as such. Always consult a trained financial professional before investing in cryptocurrencies, as the market is particularly volatile.


