
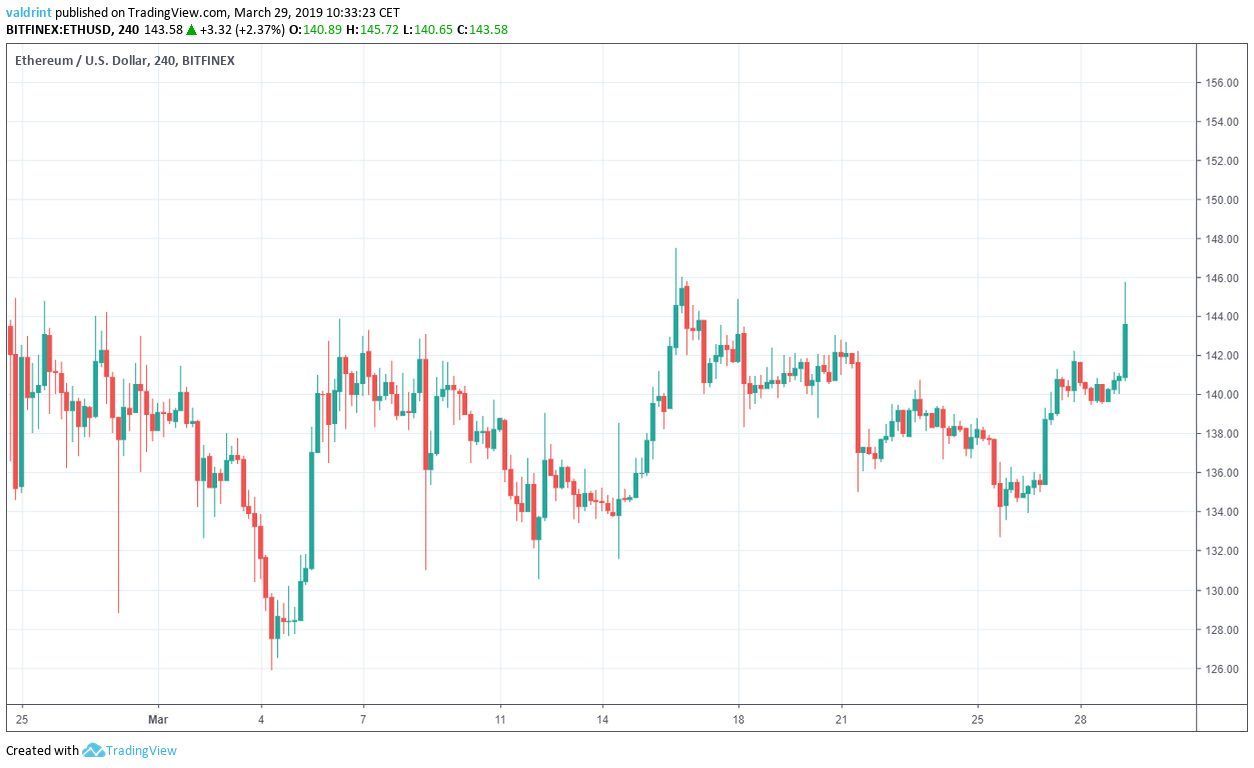
On Mar 4, 2019, the price of Ethereum (ETH) made a low of $125.88. Fourteen days later, a high of $147.50 was reached.
Prices gradually dropped for about a week. Ethereum maintained growth, however, and never dropped below $132.
On Mar 26, prices began rising again with highs over $145 reached by Mar 29.
Will this recent uptrend finally bring Ethereum to the $150 mark or will a tragic downswing bring new lows?
Ethereum (ETH): Trends and Highlights for March 29, 2019
- The price of Ethereum has been on a gradual uptrend since Mar 4.
- ETH appears to be trading within an ascending triangle.
- There is bearish divergence developing in the MACD and the RSI.
- There are resistance areas near $152 and $167.
- There is support near $127.
Ascending Triangle
To begin, we define Ethereum’s current trading pattern by analyzing the price of ETH on Bitfinex at four-hour intervals from Feb 25 to Mar 29.
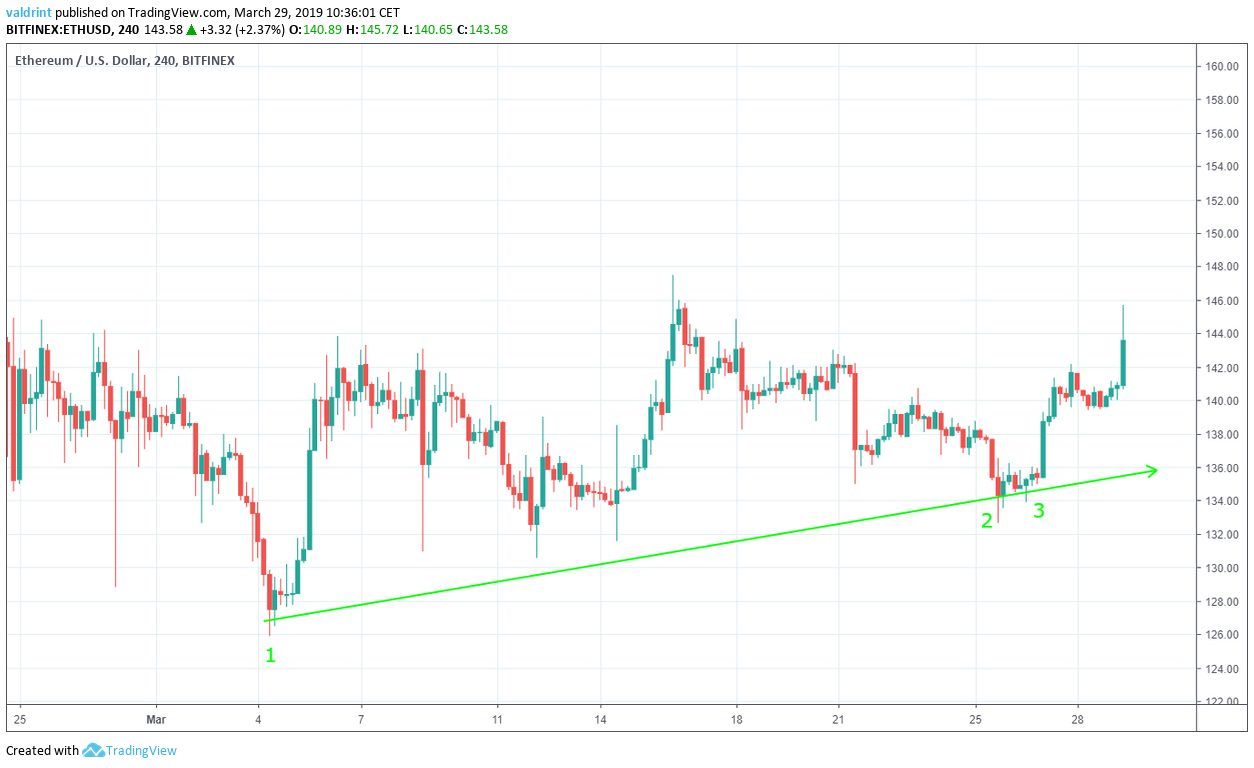
On March 4, the price made a high of $125.88. A gradual upward move followed. Several market cycles have been completed. Each low has been higher than the previous one.
Tracing these lows gives us an ascending support line:
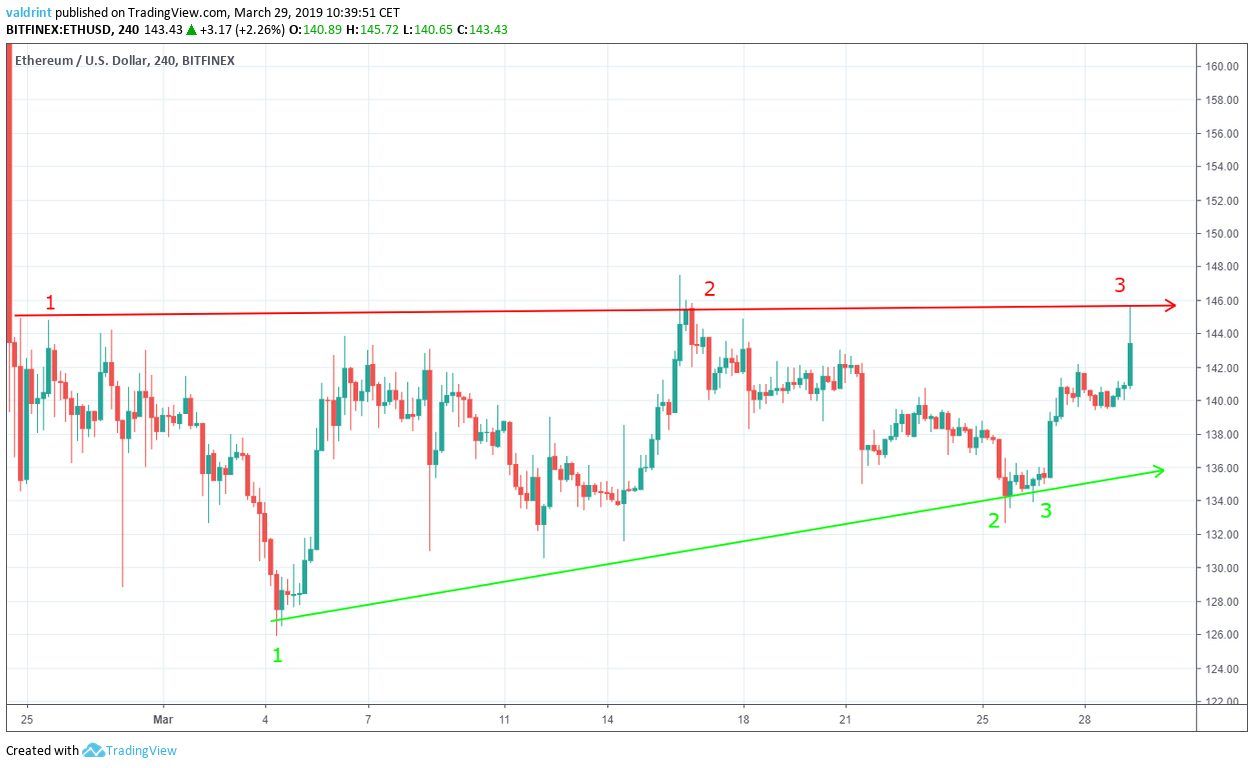
On Feb 25, the price made a high of $144.90. A sharp decrease was followed by a gradual increase. At the time of writing on Mar 29, this price had been reached three times.
Tracing these highs gives us a horizontal resistance line. The resistance and support lines combine to create an ascending triangle:
Breakout Attempt
To determine if this is likely, we incorporate technical indicators into our analysis.
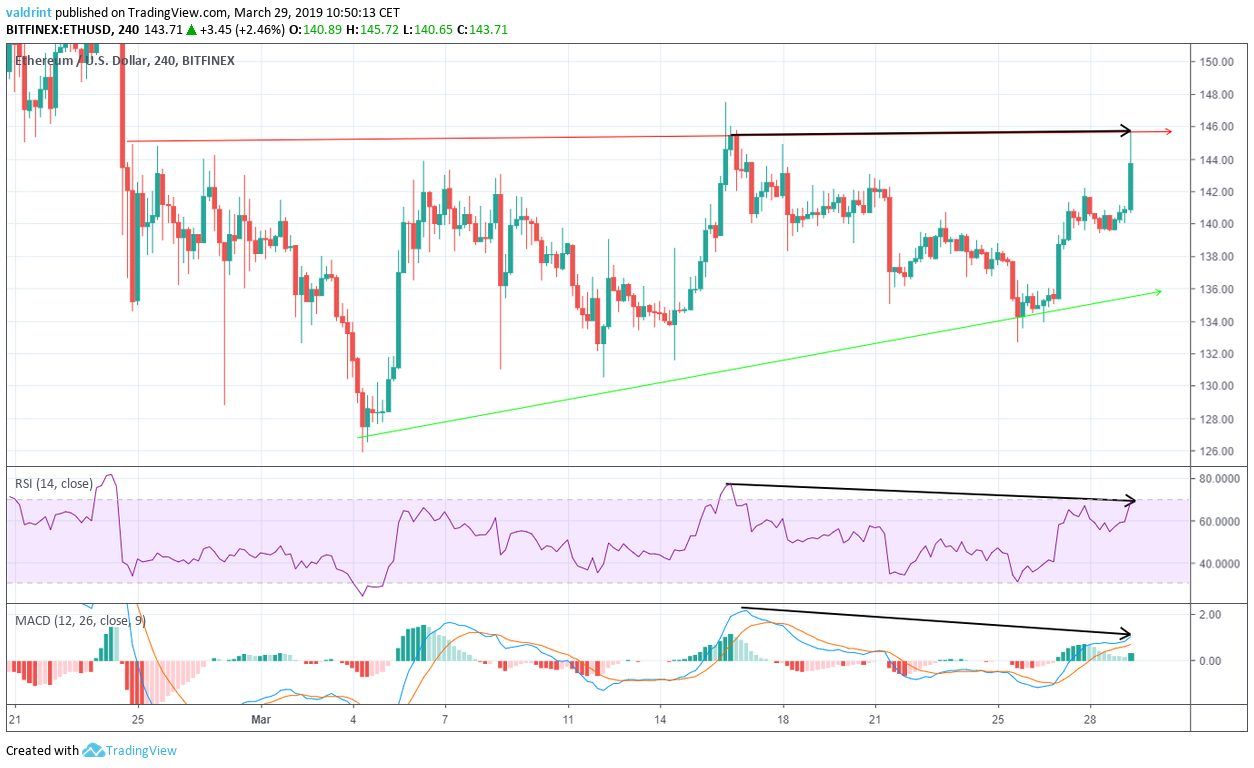
On Mar 16, the price closed at $145.50. It reached the same level on Mar 28. Similarly, the RSI and the MACD made the first high during the same interval. However, they generated a significantly lower value on Mar 28.
This is known as bearish divergence and often precedes drops in price. This might suggest that the price increases seen over the last several days might have hit a peak. Price may drop back toward support before Ethereum has another shot at reaching $150.
Reversal Areas
The price of ETH on Bitfinex was analyzed at four-hour intervals from Feb 18 to Mar 29 with resistance and support areas to determine possible future prices.
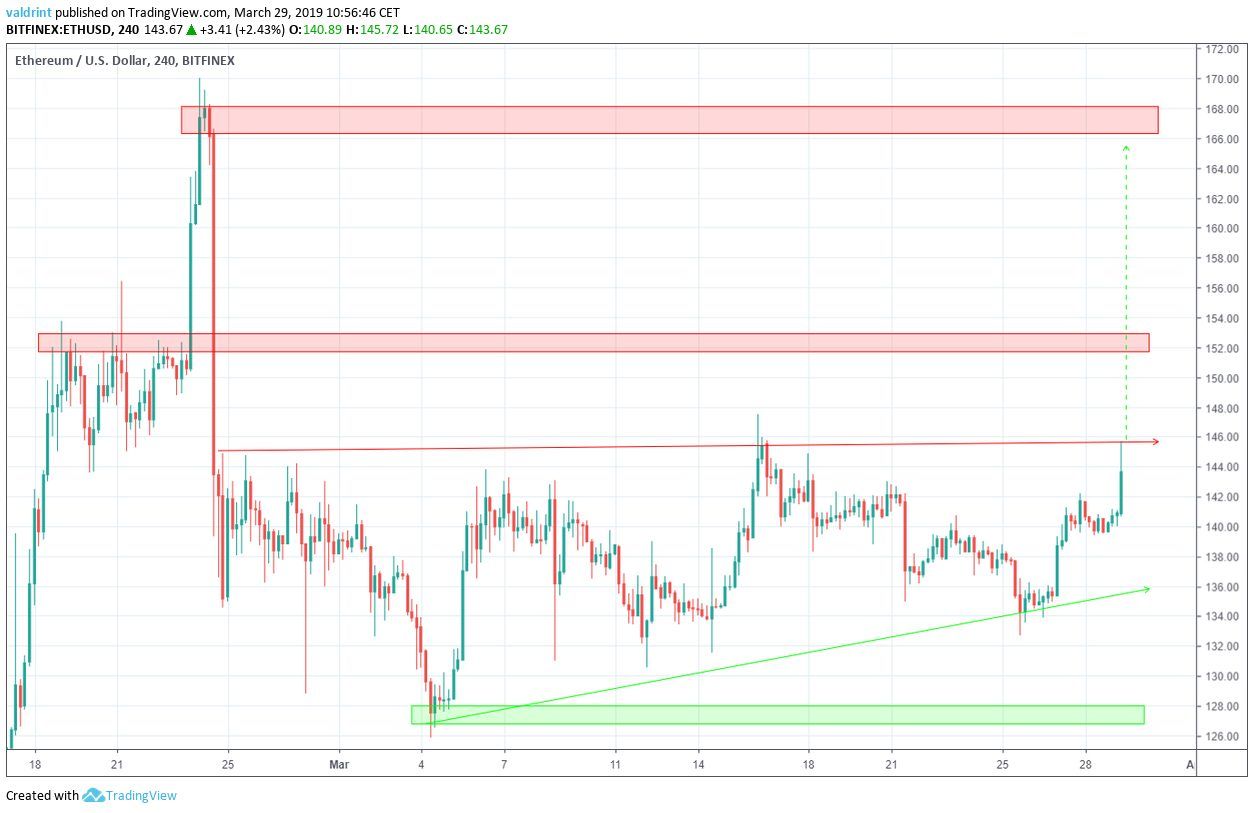
The first resistance area is located near $152. The second one is found near $167. These values might be reached in case of a successful breakout; however, the MACD and RSI suggest that a breakout is not likely.
Support is traced near $128. It is unlikely that the price will reach this level. On the contrary, the price may drop toward the support line of the ascending triangle before making another upward move.
The next upward move may take Ethereum to $150.
Summary of Analysis
Based on this analysis, the price of ETH is not likely to break out of the ascending triangle in the immediate future. More likely is a price drop toward support followed by another rise which might take Ethereum to $150.
Do you think ETH will eventually break out from the triangle? Let us know your thoughts in the comments below.
Disclaimer: This article is not trading advice and should not be construed as such. Always consult a trained financial professional before investing in cryptocurrencies, as the market is particularly volatile.
