


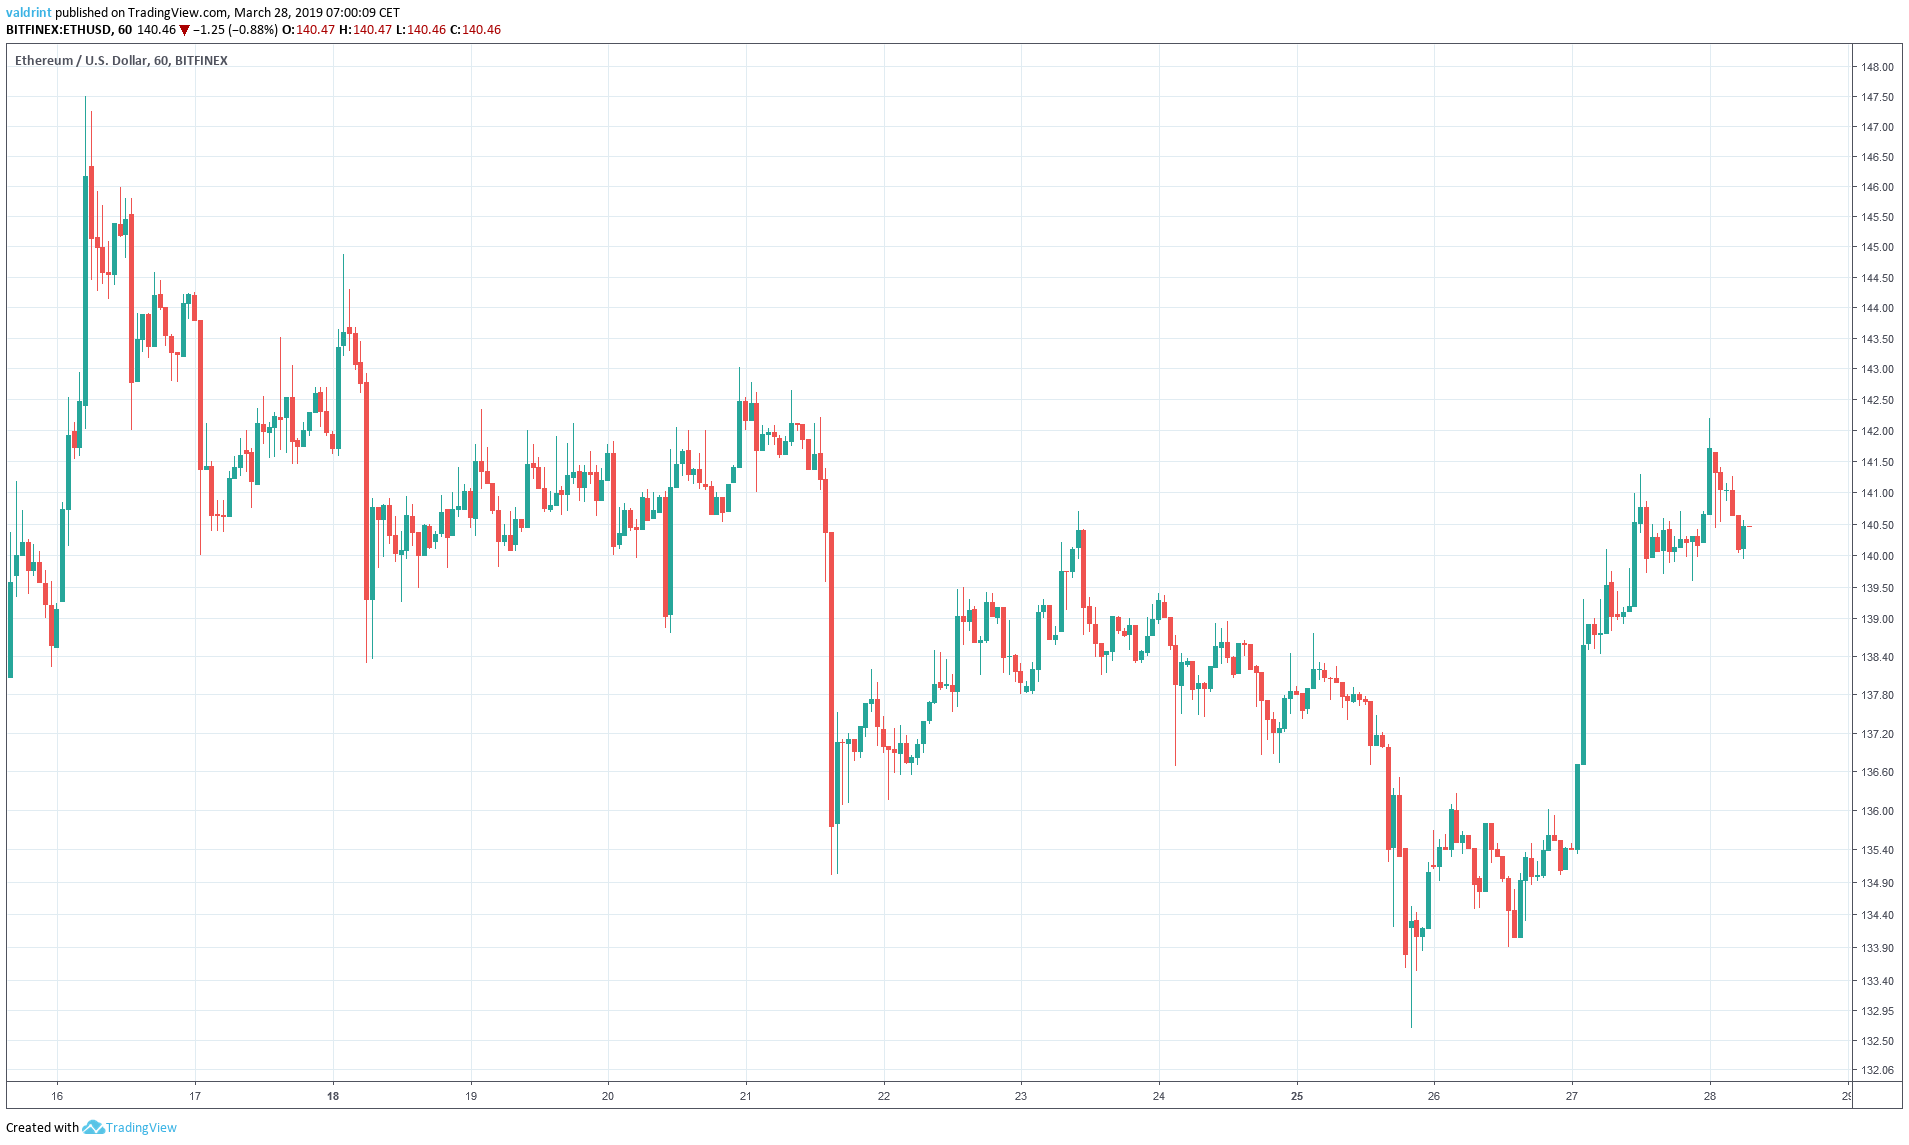
On Mar 16, 2019, the price of Ethereum (ETH) made a high of $147.50. A gradual downtrend followed with lows around $139 experienced on Mar 18 and 20.
Price drops accelerated on Mar 21 when Ethereum reached lows of nearly $135. A lower low under $133 was experienced on Mar 25.
Shortly, thereafter price went up. On Mar 26, a surprise spike resulted in a high over $140. It has been on an uptrend since.
Based on today’s analysis, we are sticking with yesterday’s prediction that the prices of ethers—the native cryptocurrency deployed on the Ethereum network—will not break out above the resistance area at $143. On the contrary, we believe the price will drop to one of the support areas outlined below.
Ethereum (ETH): Trends and Highlights for March 28, 2019
- The price of Ethereum has been on a short-term uptrend since Mar 26.
- ETH is trading inside an ascending channel.
- There is bearish divergence developing in the MACD and the RSI.
- There are resistance areas near $145, and $143.
- There are support areas near $137 and $133.
Ascending Channel
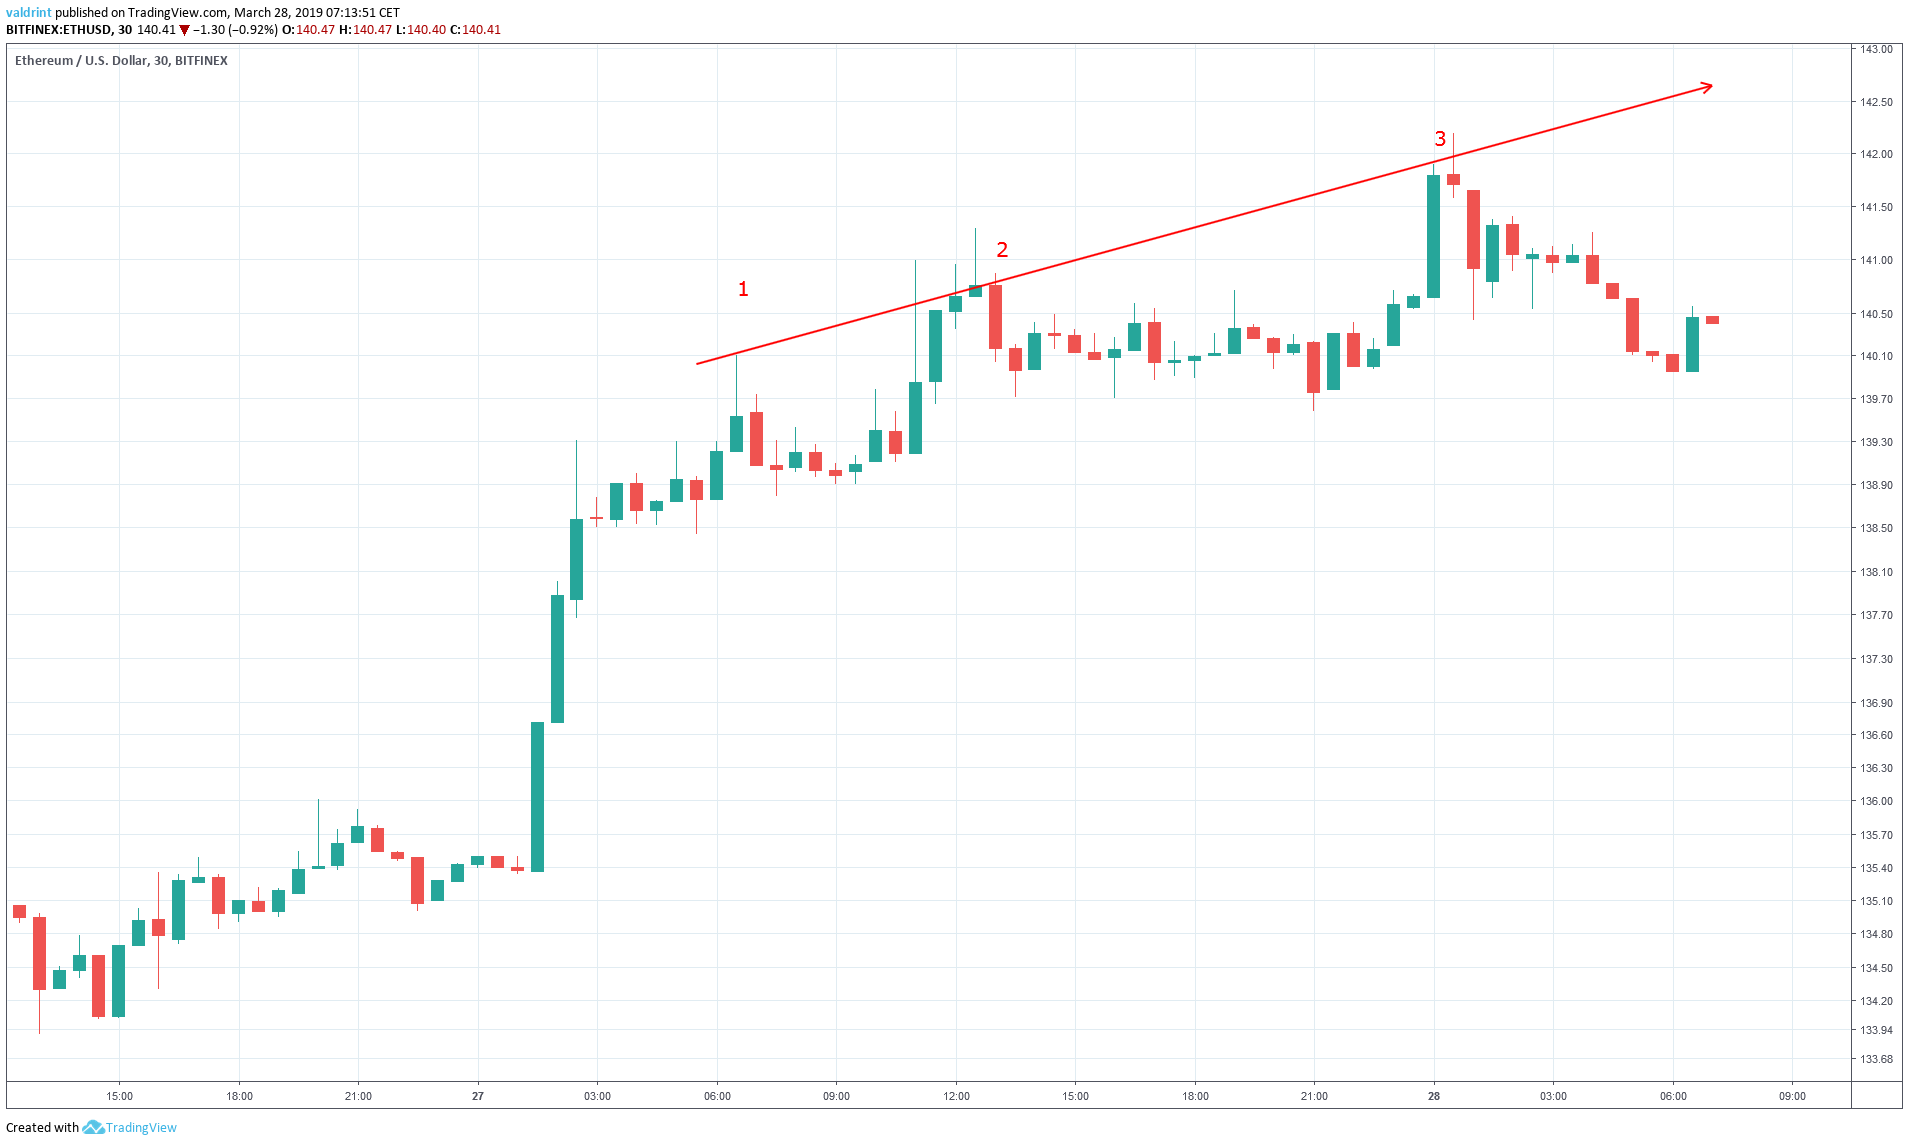
To begin we define Ethereum’s current trading pattern by analyzing the price of ETH on Bitfinex at thirty-minute intervals from Mar 26 to Mar 28.
On March 27, the price made a high of $140.10. A gradual upward move followed. Several market cycles have been completed. Each high has been higher than the previous one.
Tracing these highs gives us an ascending resistance line:
On Mar 26, the price made a low of $134. A gradual uptrend followed, with each low being higher than the previous one. The increase intensified on Mar 27.
Tracing these lows gives us an ascending support line.
The resistance and support lines combine to create an ascending channel:
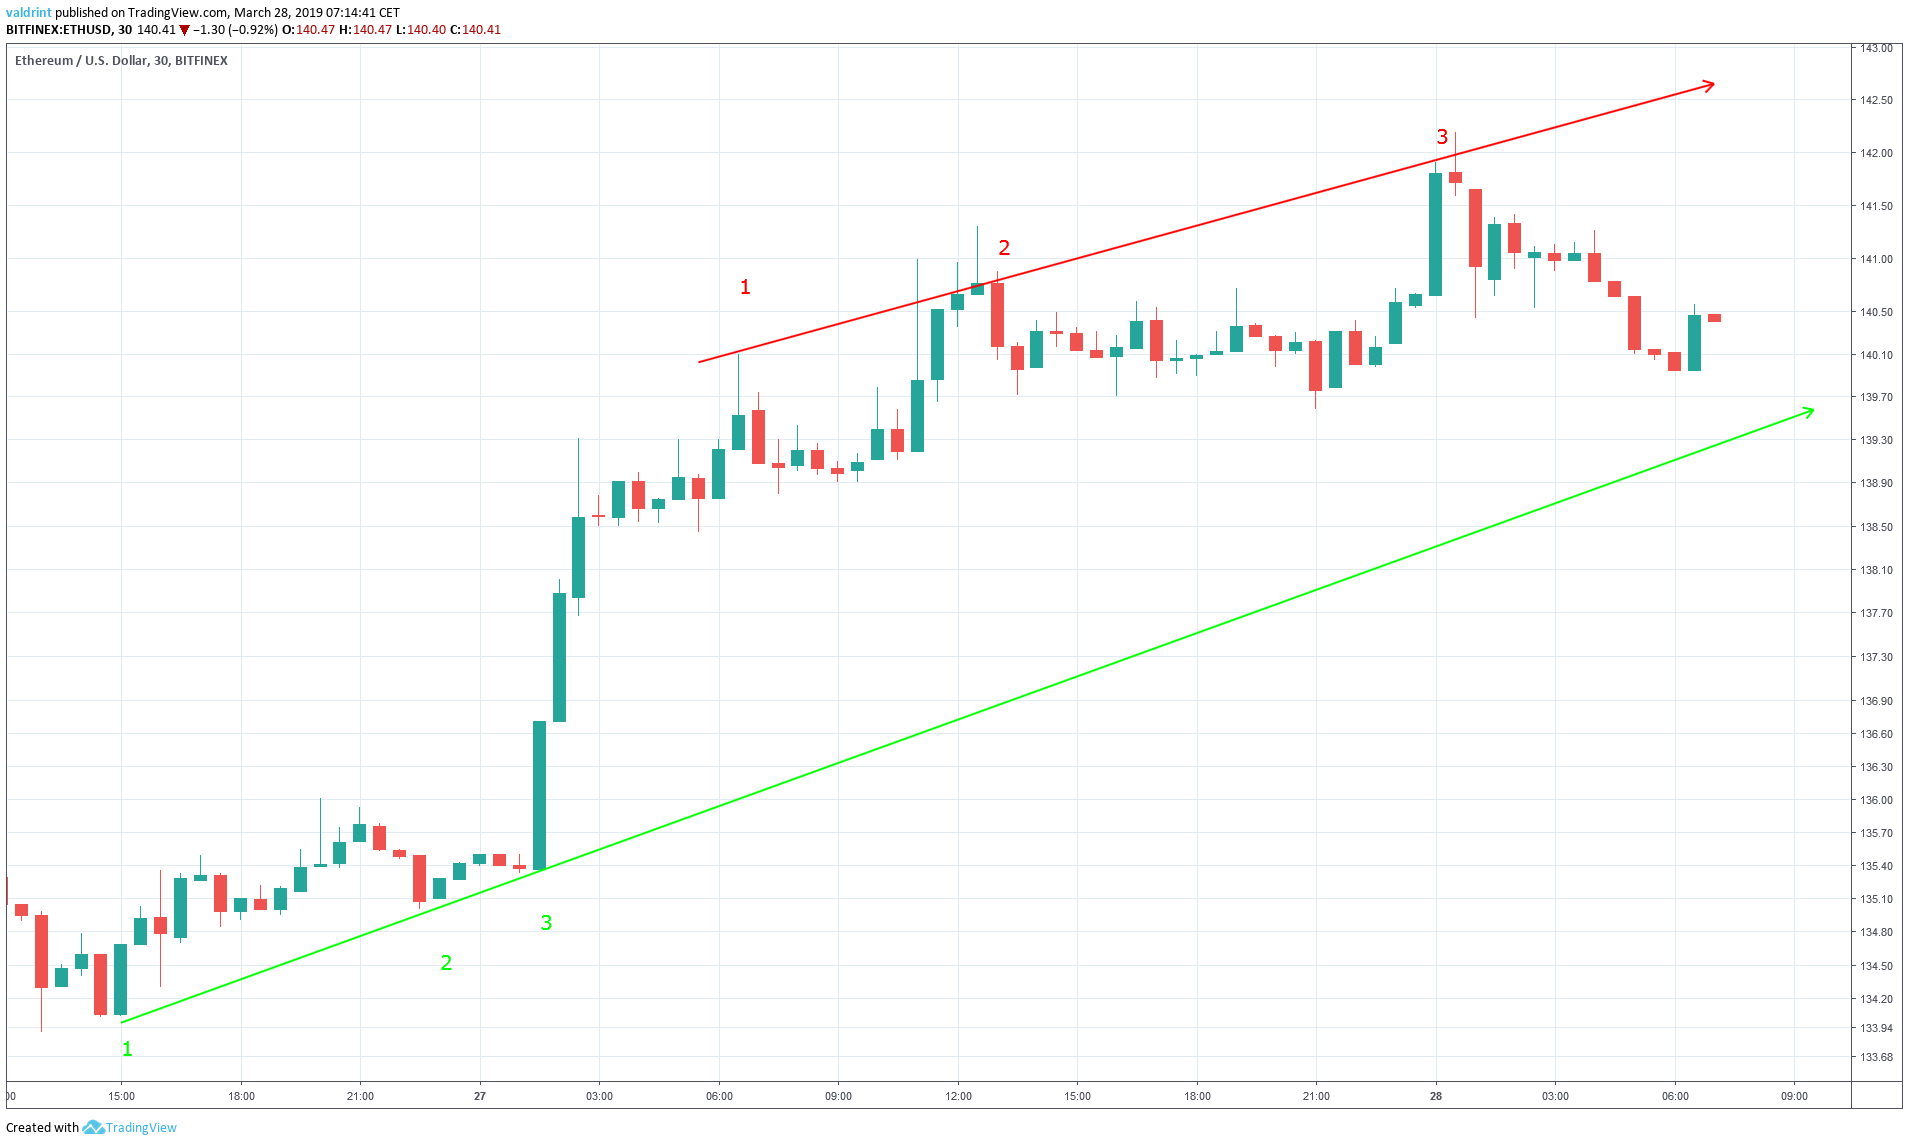
Prices gains and losses are expecting within the confines of the channel. However, long-term growth is expected. Highs and lows are expected to grow successively larger over time based on this pattern.
Beginning Of a Downtrend?
To better assess possible price fluctuations, we incorporate technical indicators into the analysis.
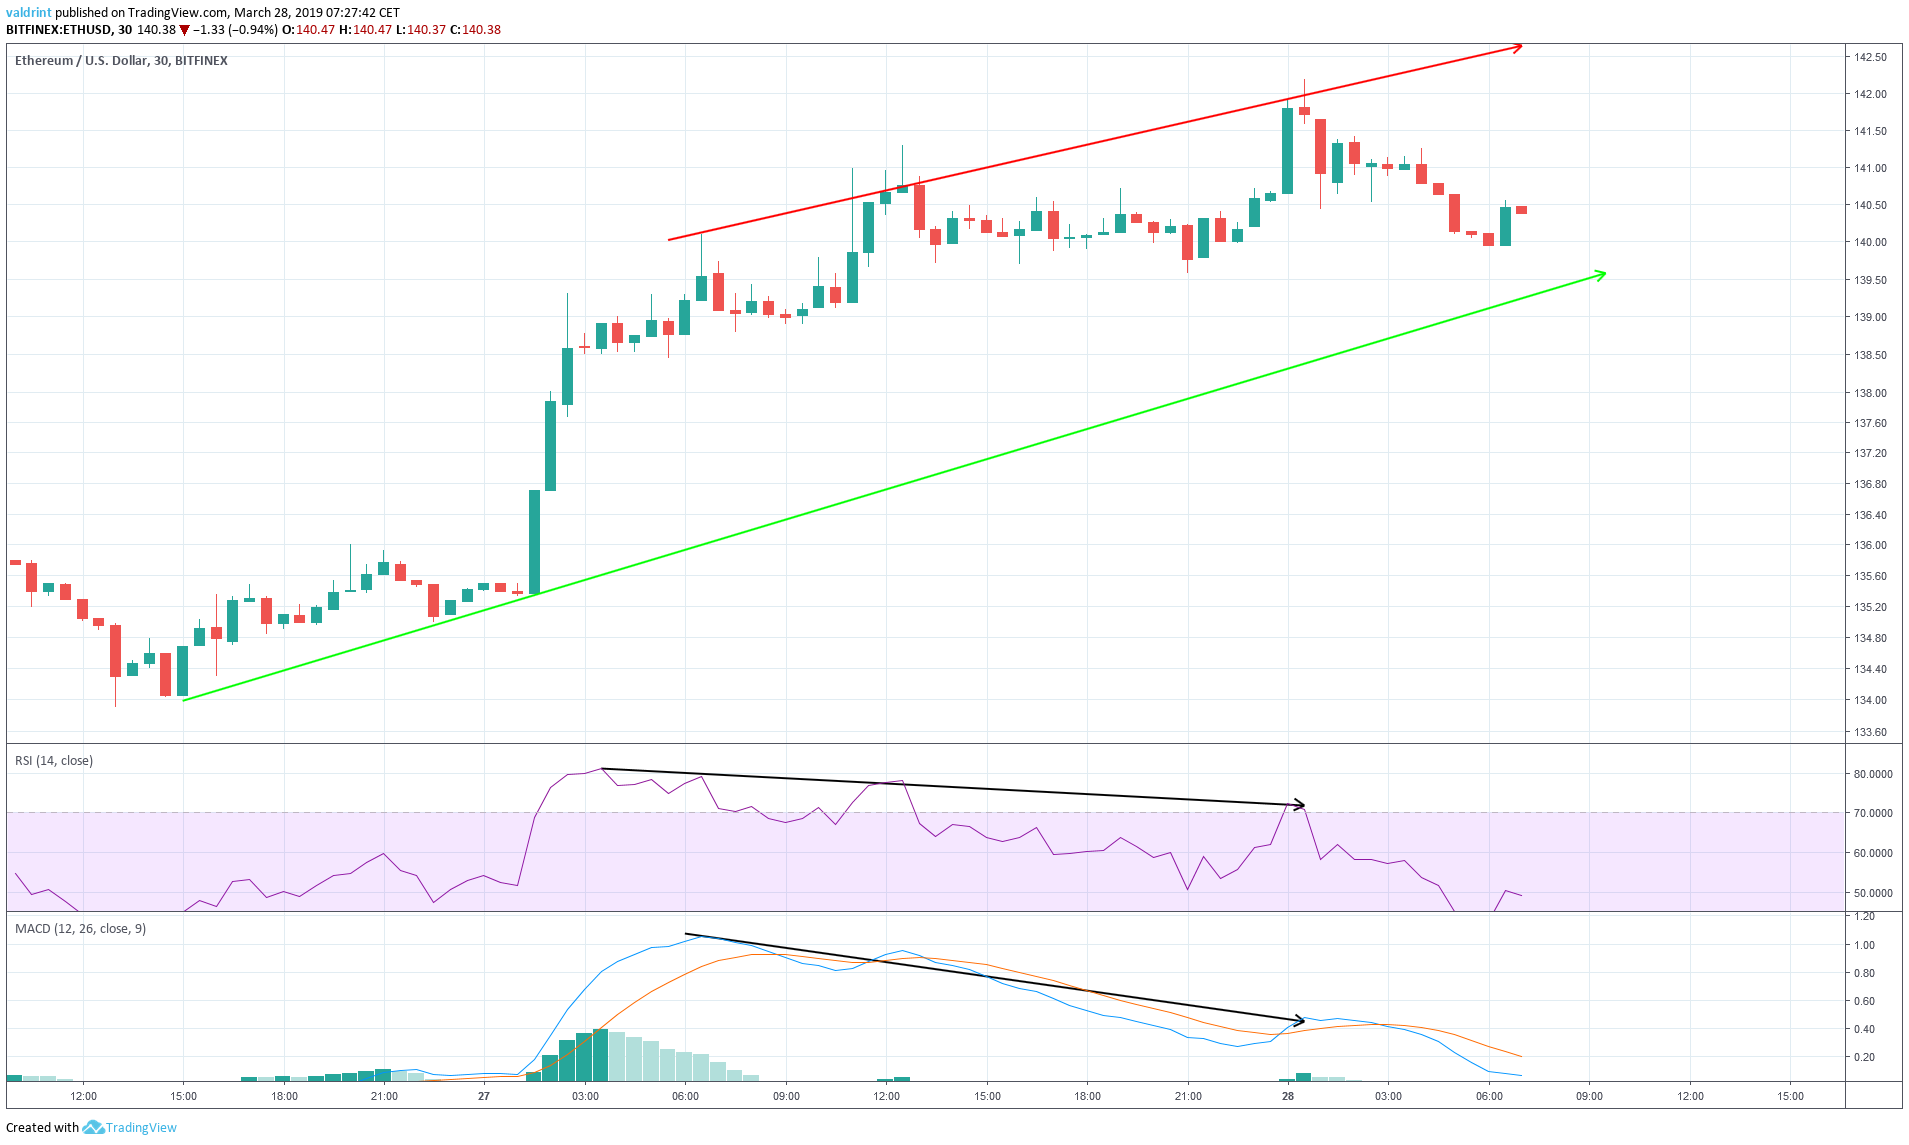
On Mar 27, the price made a high of $139.31. Since then, it has continued to generate higher values.
Similarly, the RSI and the MACD made the first high during the same interval. However, they have continued to generate lower values since.
This is known as bearish divergence and often precedes drops in price. In the case of ETH, it preceded the ongoing drop from $142.
Using these indicators, it is likely that the price will keep decreasing towards the support line of the channel.
Reversal Areas
The price of ETH on Bitfinex was analyzed at two-hour intervals from Mar 13 to Mar 28 to determine possible values that may be reached.
Resistance and support areas are created when the price revisits the same level several times.
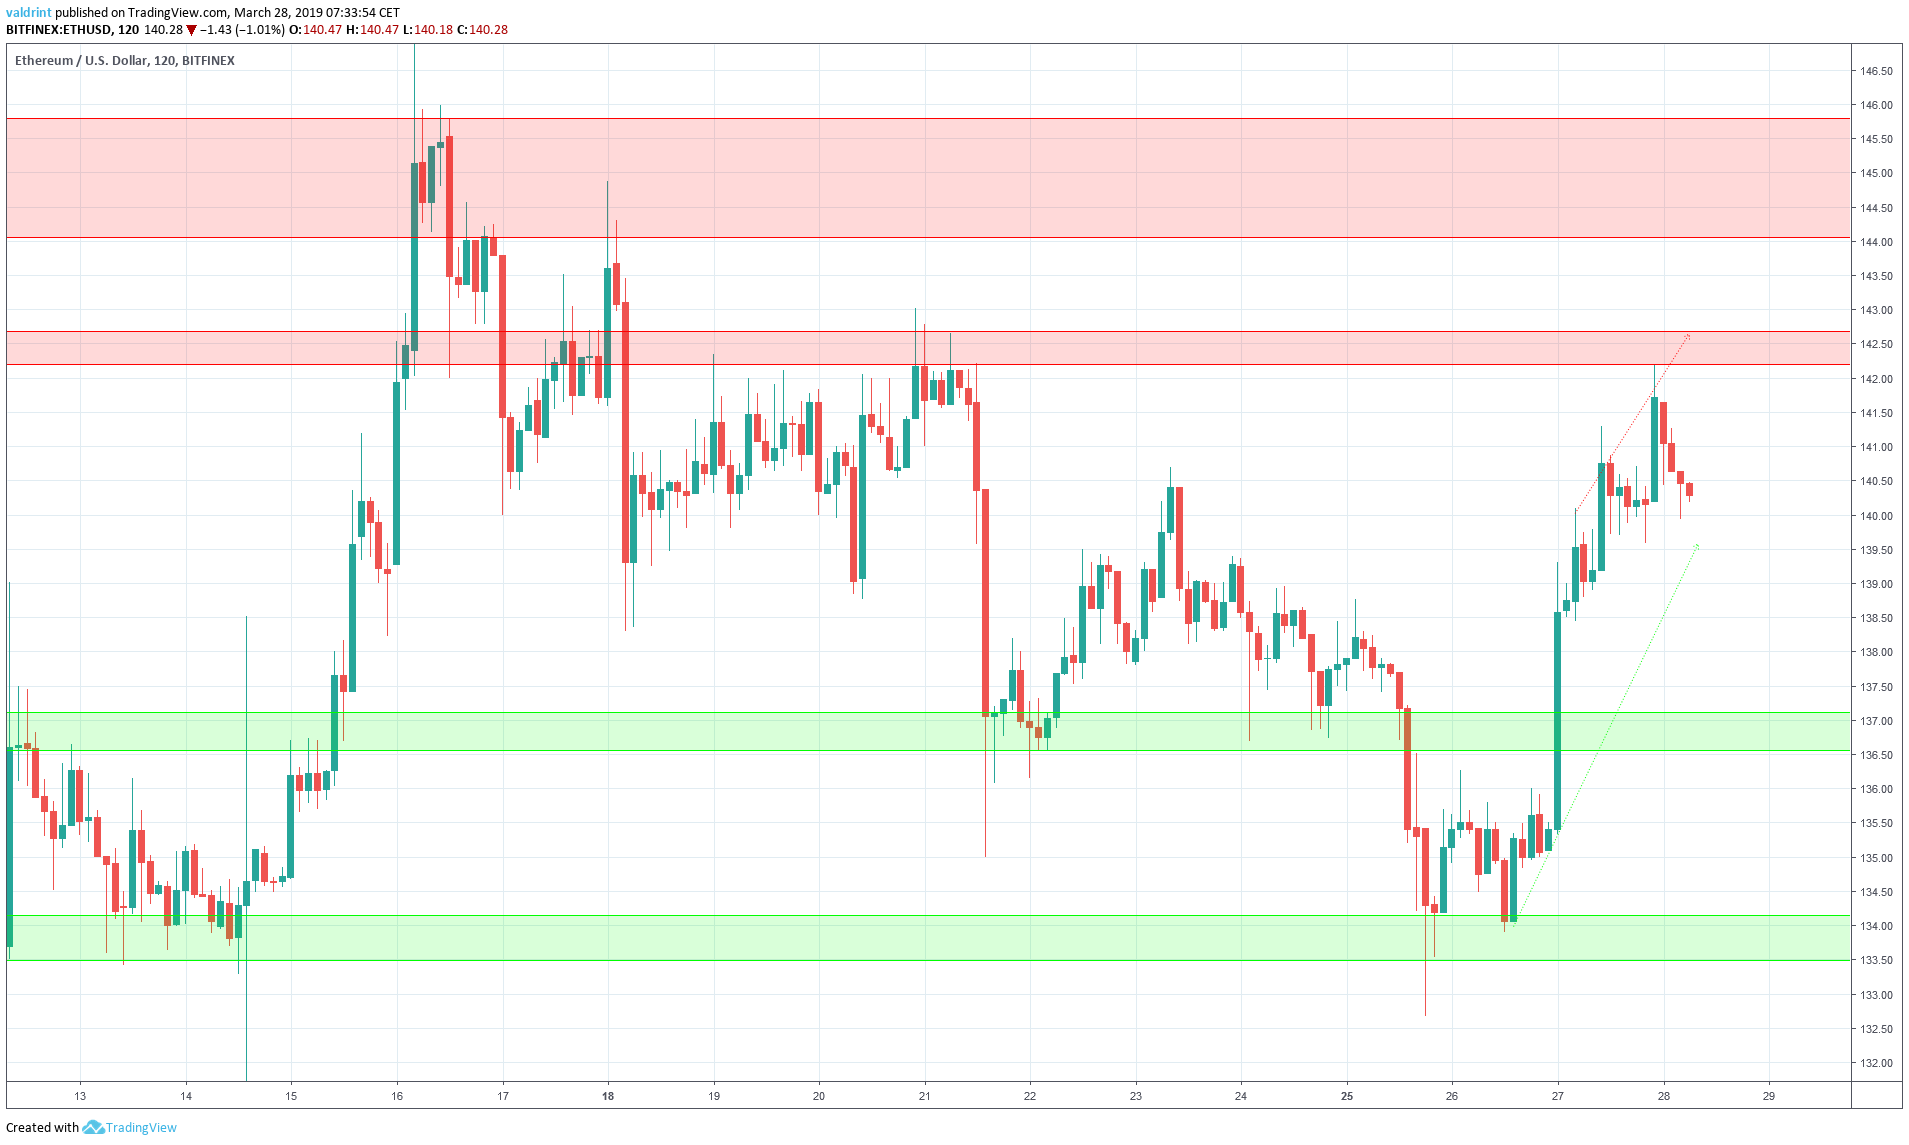
The first resistance area is located near $143, slightly above where the price is currently trading. The main resistance area is found near $145. We do not expect the price to break out from the first resistance area and reach the second one.
The closest support area is found near $137 followed by support areas near $133. According to our analysis, it is likely that the price reaches at least one of these areas.
Summary of Analysis
Based on this analysis, the price of ETH may drop to the closest support line and possibly break down from the channel. Gradual price decreases should continue.
Do you think ETH will break down from the channel? Let us know your thoughts in the comments below.
Disclaimer: This article is not trading advice and should not be construed as such. Always consult a trained financial professional before investing in cryptocurrencies, as the market is particularly volatile.


