


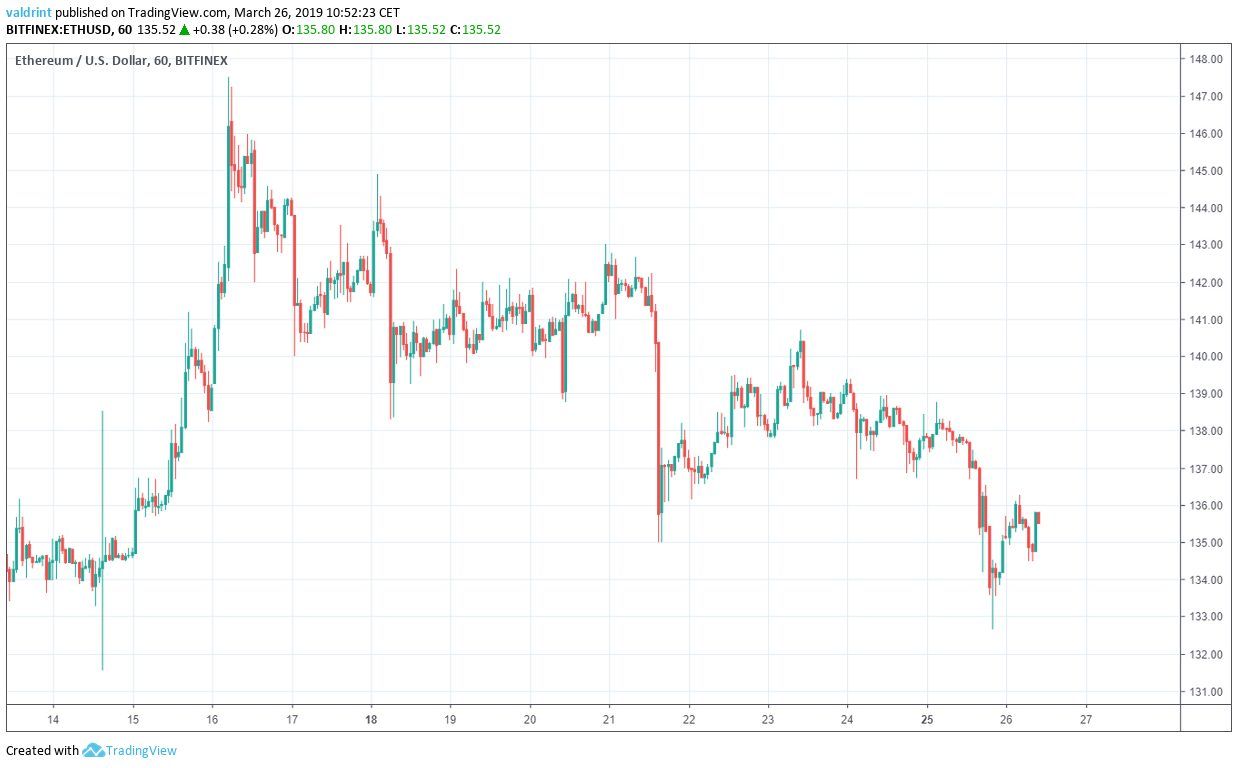
On Mar 16, 2019, the price of Ethereum (ETH) made a high of $147.5. A downtrend ensued. There were periods of both gradual and sharp price losses. A bottom of $132.67 may have been reached on Mar 26.
Will Ethereum’s price keep dropping or should we be expecting a rebound?
Based on today’s analysis, we predict that the prices of ethers—the native cryptocurrency deployed on the Ethereum network—will increase and eventually touch the resistance line of the pattern defined below.
Ethereum (ETH): Trends and Highlights for March 26, 2019
- The price of Ethereum has been on a downtrend since Mar 16.
- ETH is trading inside a descending channel.
- There is bullish divergence developing in the RSI and the MACD.
- There are resistance areas near $153 and $145.
- There are support areas near $134 and $128.
Previous Movement
In order to illustrate the previous movement, the price of ETH on Bitfinex was analyzed at two-hour intervals from Mar 4 to Mar 26.
On Mar 16, the price made a high of $147.5 A gradual downtrend ensued, with each high being lower than the previous one. Tracing these highs gives us a descending resistance line.
On Mar 4, the price made a low of $125.88. Since then, several market cycles have been completed, with each low being higher than the previous one. Tracing these lows gives us an ascending support line.
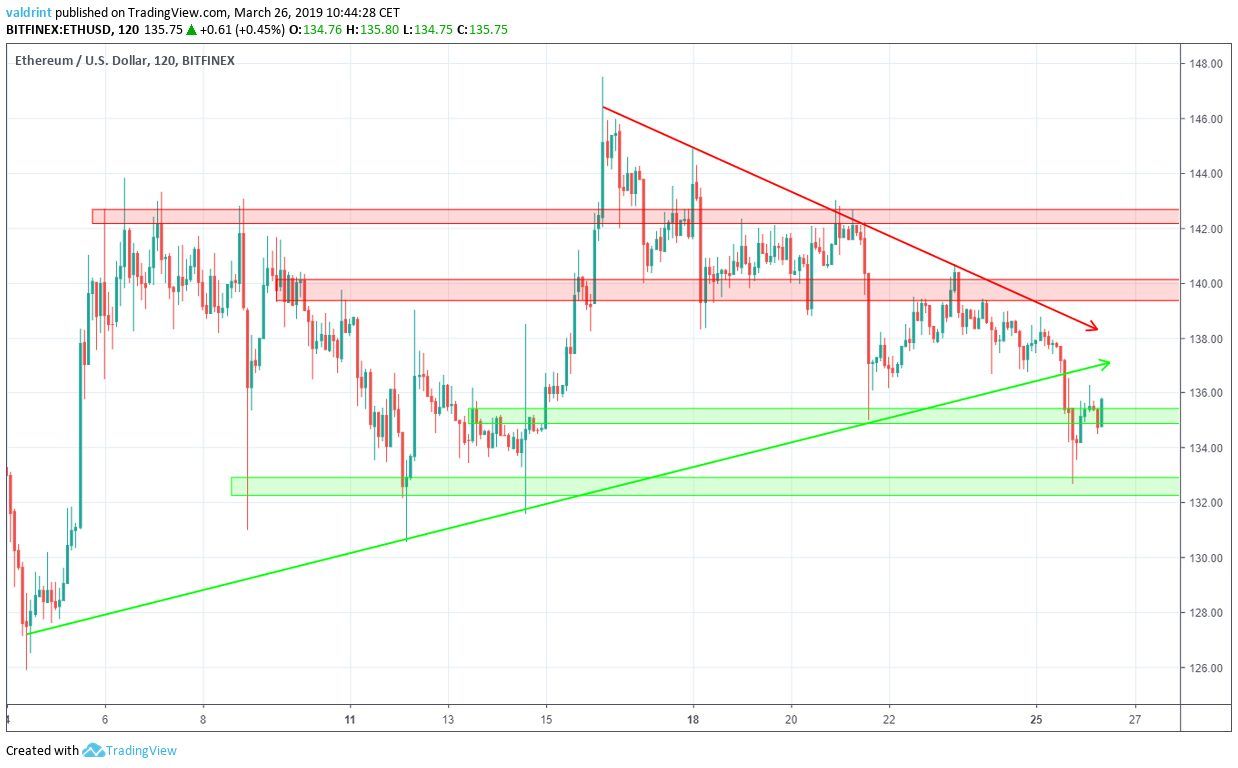
The support and resistance lines combine to create a symmetrical triangle. This pattern is a better predictor of price fluctuations than resistance and support lines alone.
Ethereum broke down below the support of the triangle on Mar 25—shortly after our last analysis was written.
This triangle is no longer an accurate indicator of future prices for two primary reasons:
- The point of convergence between the support and resistance is likely to be reached in the very near future.
- The breakdown below the support suggests the emergence of new trading patterns independently of the triangle’s convergence.
Because the price is still decreasing at the rate suggested by the resistance, we believe it remains an accurate indicator of Ethereum’s decline. However, the breakdown below support coupled with the convergence of the triangle suggests that a new support line is emerging. As a result, a new trading pattern is likely developing.
Tracing Resistance
We trace the resistance line by analyzing the price of ETH on Bitfinex at one-hour intervals from Mar 13 to Mar 26.
On Mar 16, the price made a high of $147.5. A gradual downward move followed. Several market cycles have been completed and each high has been lower than the previous one.
Tracing these highs starting with the Mar 16 highs gives us the descending resistance line seen in the triangle above:
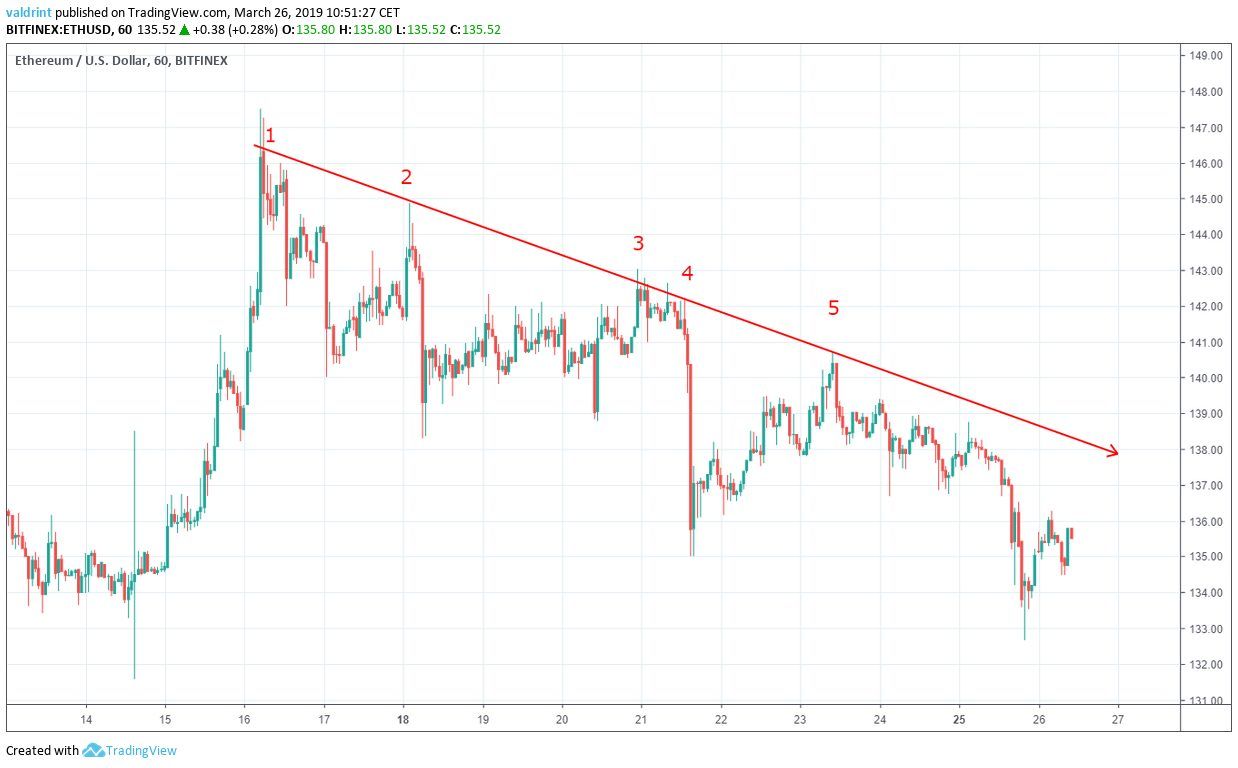
The resistance line acts as a ceiling to price, preventing further upward movement. Theoretically, it traces the upper limits of the price.
It also measures the rate of decrease. Price had been decreasing at the same rate as predicted by the line until Mar 25, when the rate of decrease intensified.
The price is likely to decrease at the same rate as predicted by the line unless a reversal leads to a sudden breakout. Based on this line, we cannot assess whether or breakout is possible nor when it might ocur.
Descending Channel
Now that the resistance line is defined, we trace the support to complete the trading pattern.
On Mar 18, the price made a low of $138.3. A gradual increase was followed by a sharp decrease. Each low has been lower than the previous one.
Tracing these lows beginning with the Mar 18 low gives us an ascending support line. Couple with resistance, we see that the triangle defined above has now emerged into a downward facing horizontal channel:
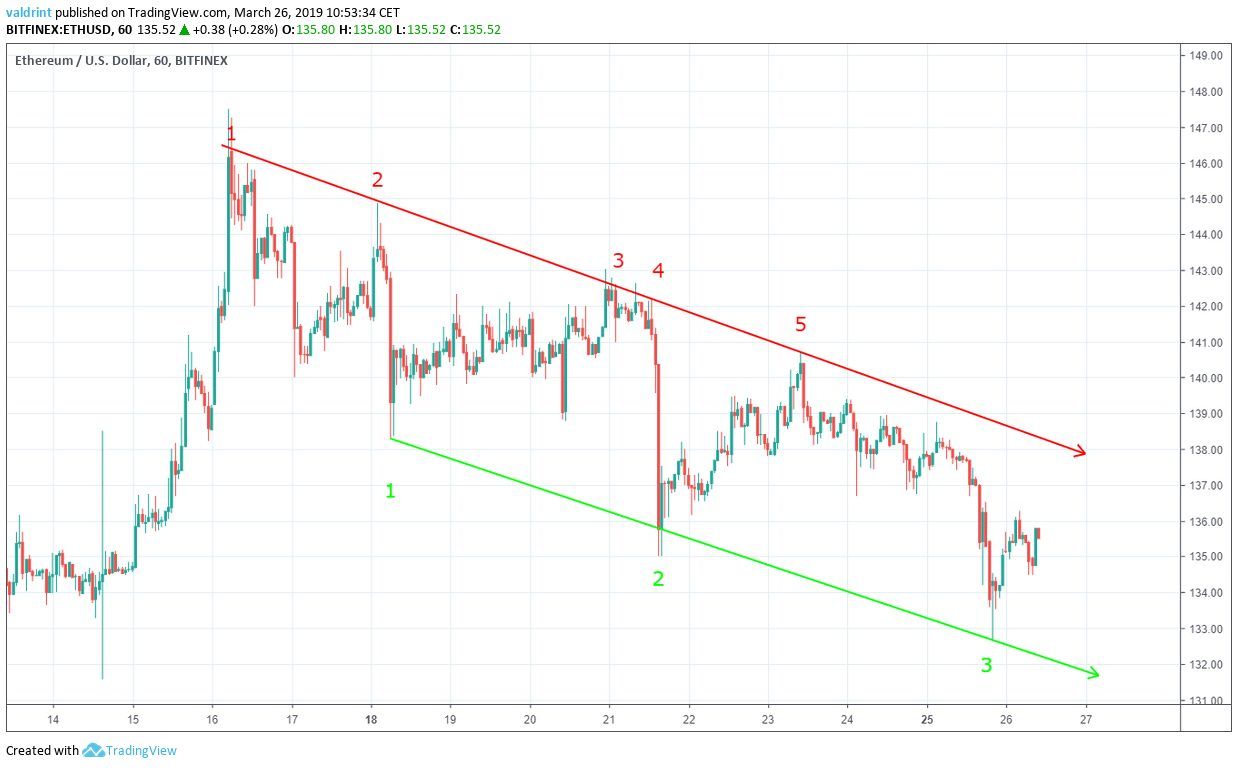
The support line can act as a floor to price, preventing further downward movement. It theoretically traces the lower limits of price movement.
Prices are expected to fluctuate within the channel reaching highs and lows between the resistance and support. This is typically a neutral trading pattern. However, because it is downward facing, gradual price losses should be expected over time.
If the price continues to trade within the channel, successively lower highs and lows will be experienced.
We believe it is likely that the price of ETH will keep decreasing at the rate suggested by the channel. Gradual price losses are likely until a new trading pattern emerges.
Looking Out For Divergence
Combining MACD and RSI bullish/bearish divergence with support/resistance essentially predicts price fluctuations.
The moving average convergence divergence (MACD) is a trend indicator that shows the relationship between two moving averages (long and short-term) and the price. It is used to measure the strength of a move. The relative strength index (RSI) is an indicator which calculates the size of the changes in price in order to determine oversold or overbought conditions in the market.
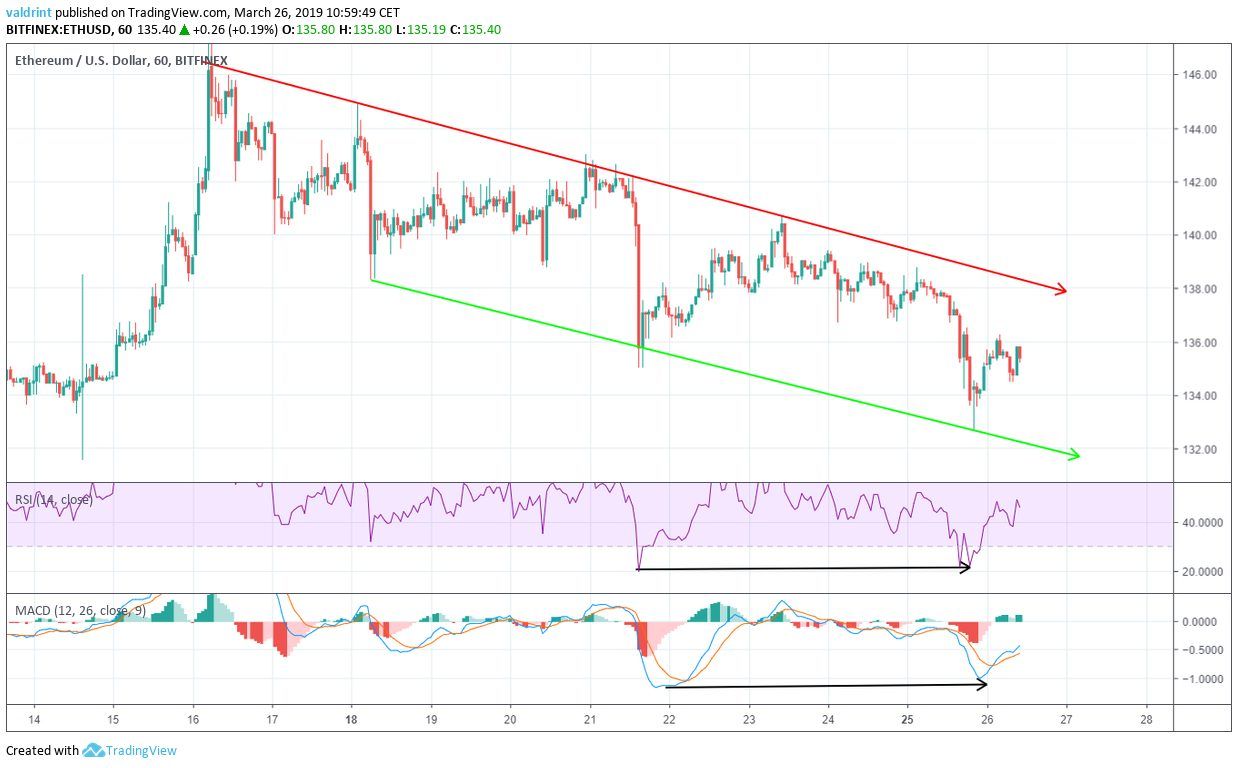
On Mar 21, the price made a low of $135. On Mar 25, it made another low of $132.67.
Similarly, the RSI and the MACD made the first low on Mar 21. However, they proceeded to create a slightly higher low on Mar 25.
This is known as bullish divergence and often precedes price increases.
However, it is not very significant in value and is occurring in a neutral pattern—reducing its validity. However, since the price is close to the support line, price increases still appear likely.
Using these indicators, it is likely that Ethereum’s price continues to move toward the resistance line of the channel. This would generate short-term price increases. If the price remains in the channel, the next high is expected to be lower than the last. Furthermore, if the price touches the resistance without a breakout, the line would be validated a sixth time.
Reversal Areas
The price of ETH on Bitfinex was analyzed at two-hour intervals from Mar 5 to Mar 26 to determine possible highs and lows that may be experienced within the channel. We also assess values that may be reached given a breakout or breakdown.
Resistance and support areas are created when the price revisits the same level several times.
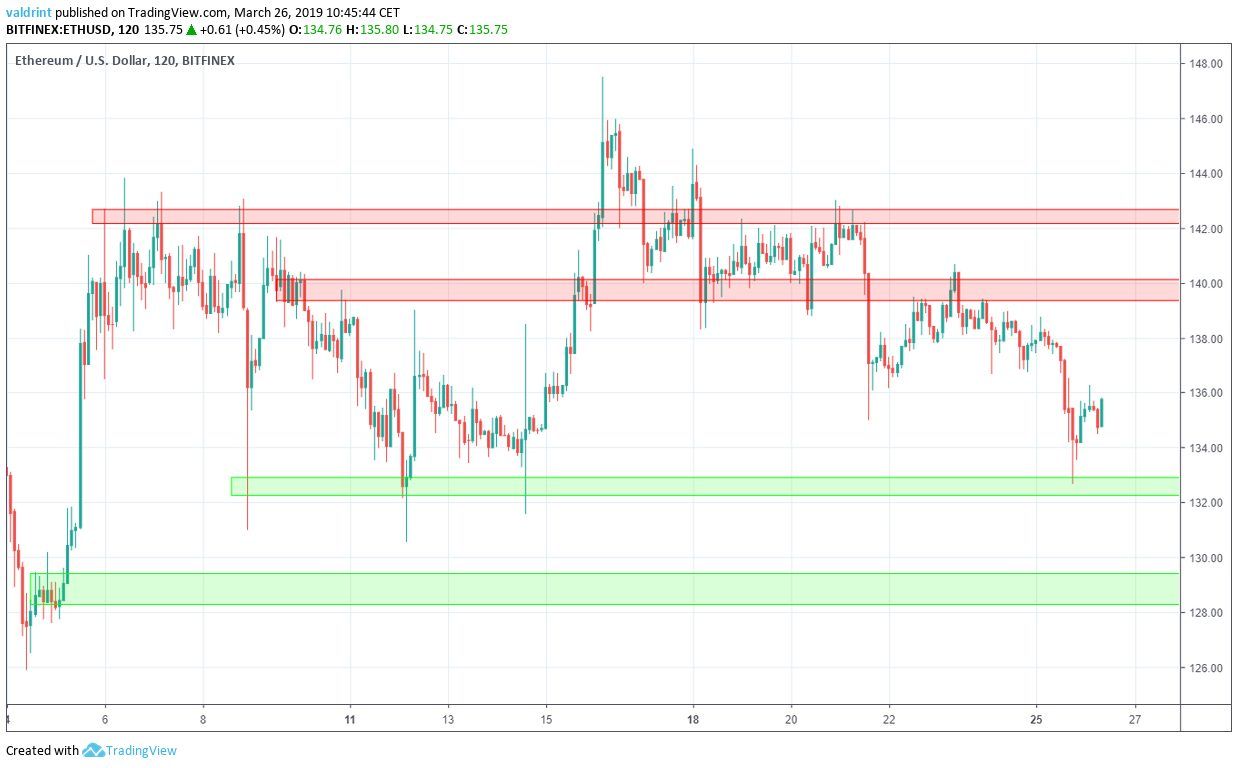
The first resistance area is located near $140. A second, main resistance area is found near $145. Both of these are above the resistance line. Neither is expected to be reached except in the case of a surprise breakout—which we don’t believe to be likely.
The closest support area is found near $133 and is currently within the channel. It is also higher than the low experienced on Mar 26. This means that the first support has already been reached and is likely to be reached again.
A second support is area is found near $128. Currently, this support is below the channel and would only be reached in a breakdown. However, as the channel continues moving downward, it may eventually reach the $128 level. In such an instance, lows under $130 remain possible along the current trend without a significant breakdown below support.
Summary of Analysis
Based on this analysis, the price of ETH may increase and touch the resistance line of the channel. However, we do not believe a breakout is likely. On the contrary, gradual price decreases should continue. Lows under $130 may be reached by the end of March as long as the trading pattern remains an accurate indicator of future prices.
If the price touches the resistance line, this prediction will be partially validated. If it decreases and falls to the support line after, it will be fully validated. This prediction would be invalidated by a breakout above the resistance line of the channel.
Do you think ETH will keep trading inside the channel? Let us know your thoughts in the comments below.
Disclaimer: This article is not trading advice and should not be construed as such. Always consult a trained financial professional before investing in cryptocurrencies, as the market is particularly volatile.


