
At BeInCrypto, we offer regular price analyses and predictions of the most popular and relevant cryptoassets. In our Mar 22 analysis of ETH, we predicted that the price will likely increase, touch the resistance line of the triangle and possibly break out. It touched the resistance line on Mar 23, but it has not broken out yet. Click Here to Read More or keep reading below for our most recent price predictions for Ethereum!
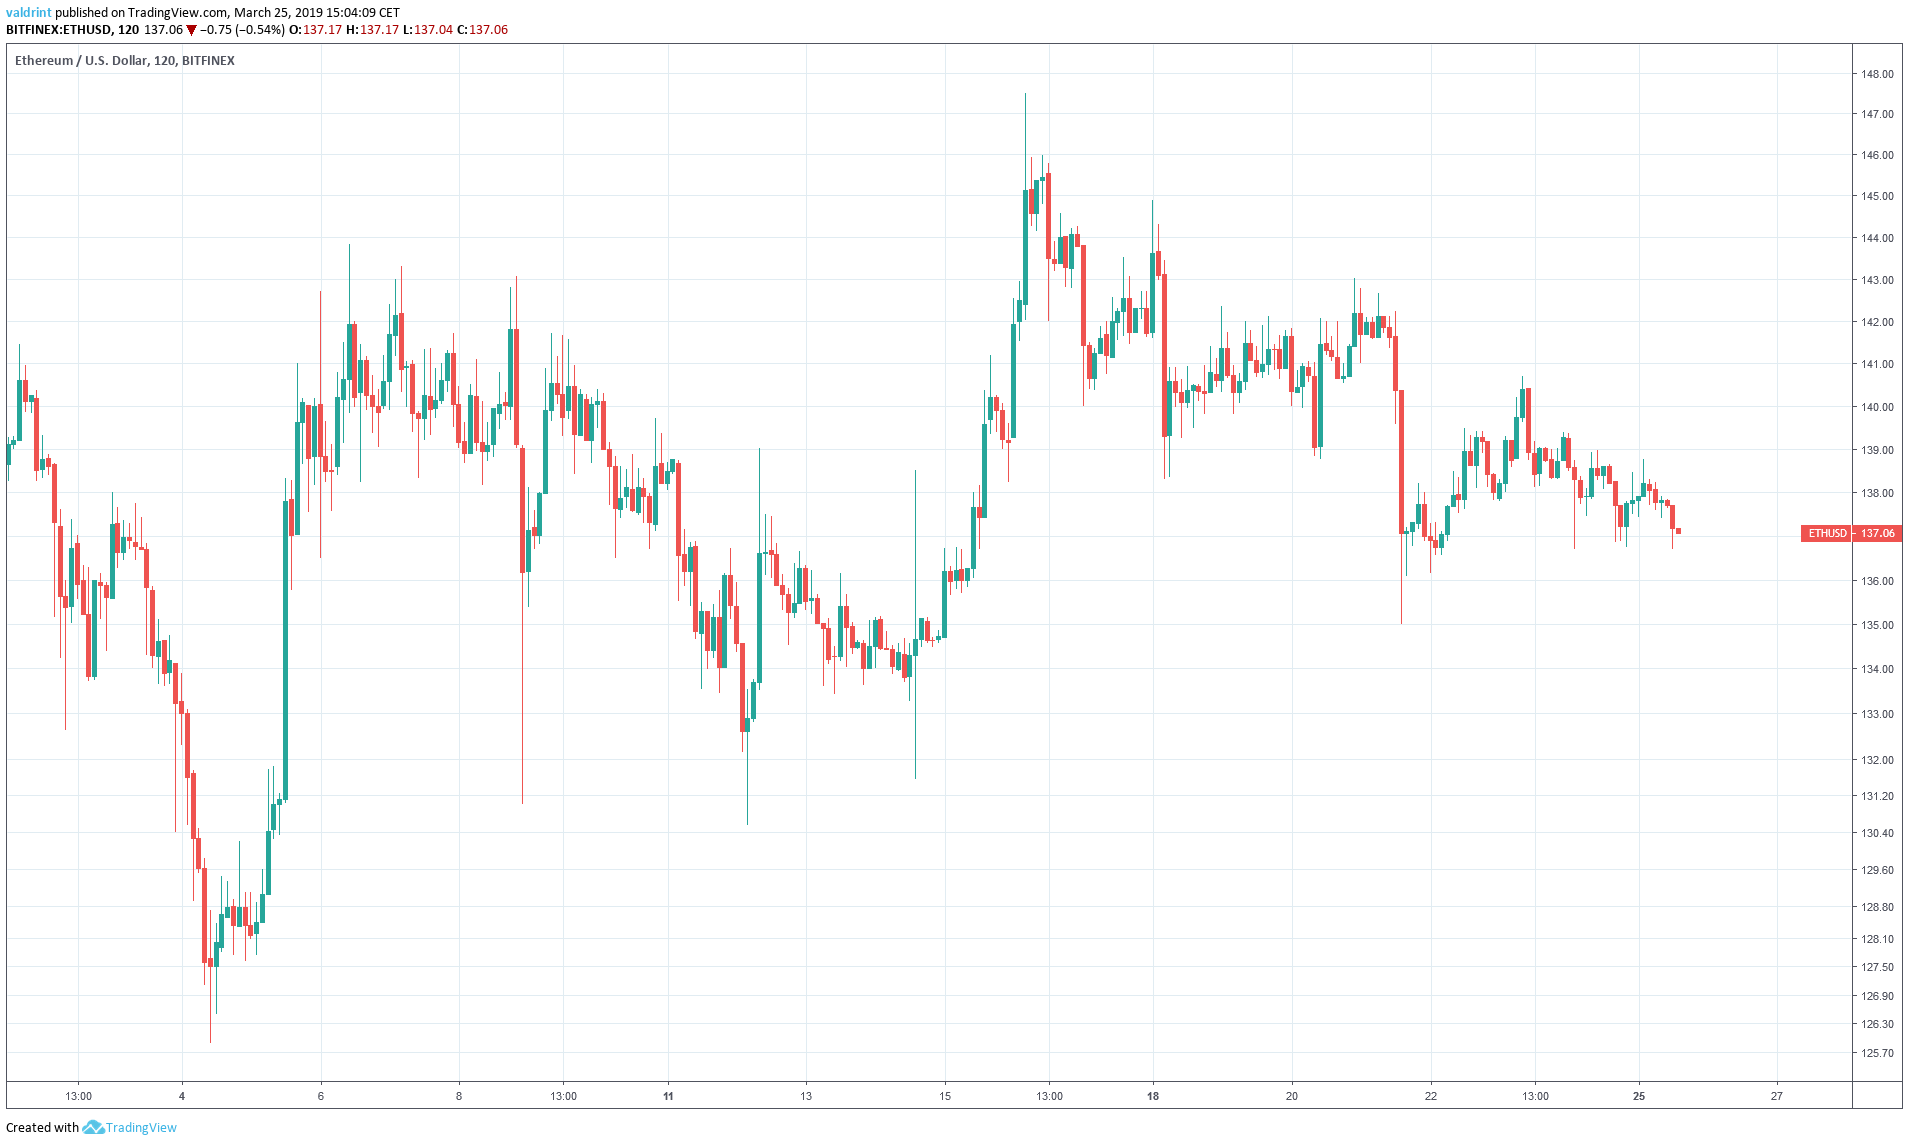
On Mar 4, 2019, the price of Ethereum (ETH) made a low of $124 and rose to highs of nearly $145 within two days.
Since that time, greater highs of over $147 were reached on Mar 16. Lows have stayed well above the $124 mark, before a drop to around $135 on Mar 21.
Though prices initially rose back to over $140, they were trading near $136 at the time of writing on Mar 25.
Should we expect further drops or will prices finally reach the $150 mark again?
Ethereum (ETH): Trends and Highlights for March 25, 2019
- The price of Ethereum has been on an uptrend since Mar 4.
- It is trading inside a symmetrical triangle.
- There is bullish divergence developing in the RSI and the MACD.
- There are resistance areas near $153 and $145.
- There are support areas near $134 and $128.
Ascending Support
In order to predict where the price will be heading next, we analyze the price of ETH on Bitfinex was analyzed at two-hour intervals from Mar 4 to Mar 25. On Mar 4, the price made a low of $125.88. Rapid increases followed. Several market cycles have been completed since, with each low being higher than the previous one. Tracing these lows gives us an ascending support line.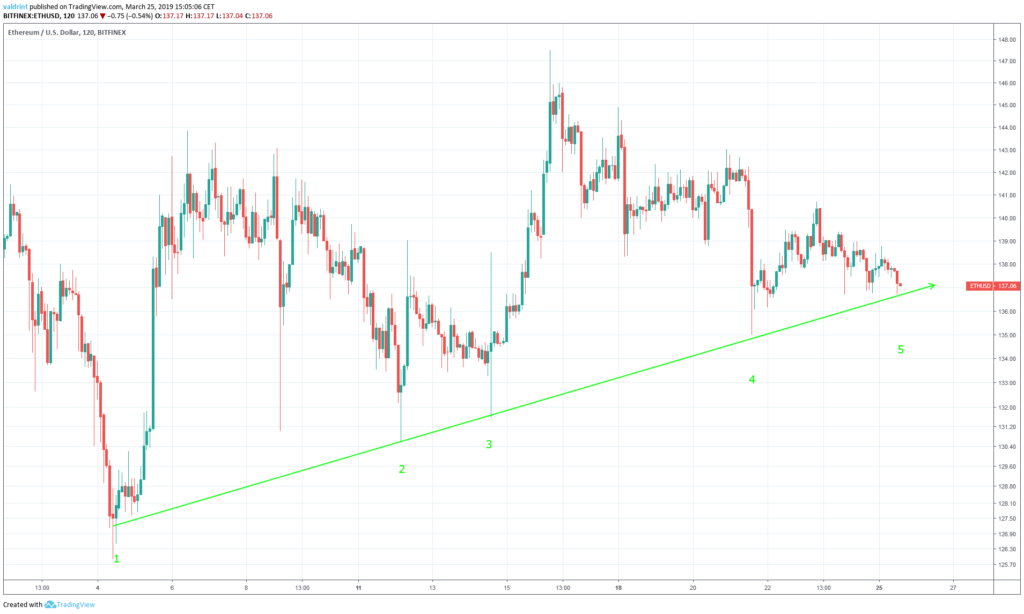
Symmetrical Triangle
On Mar 16, the price made a high of $147.5. A gradual downward move followed. Several market cycles have been completed and each high has been lower than the previous one. Tracing these highs gives us a descending resistance line.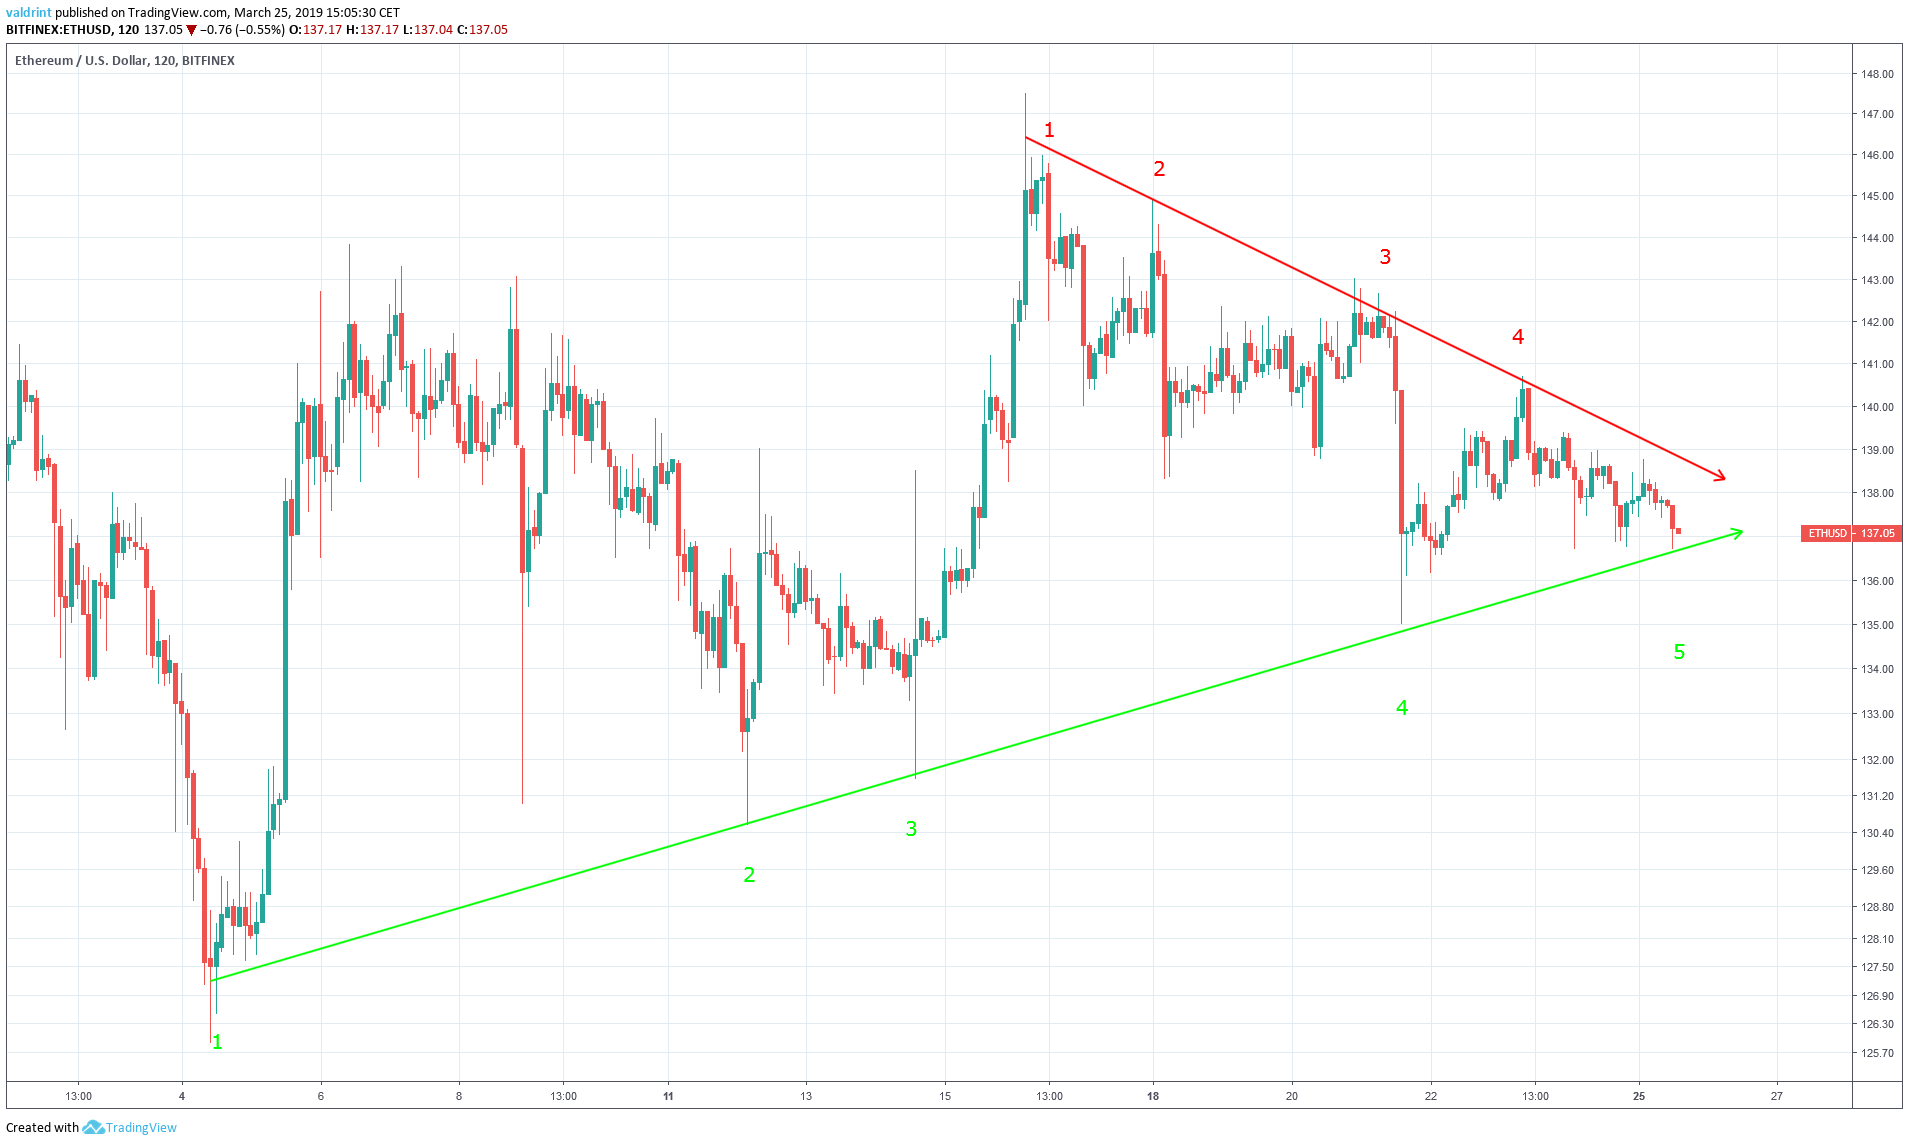
Looking Out For Divergence
Combining MACD and RSI bullish/bearish divergence with support/resistance essentially predicts price fluctuations. The moving average convergence divergence (MACD) is a trend indicator that shows the relationship between two moving averages (long and short-term) and the price. It is used to measure the strength of a move. The relative strength index (RSI) is an indicator which calculates the size of the changes in price in order to determine oversold or overbought conditions in the market.
Reversal Areas
Resistance and support areas are created when the price revisits the same level several times.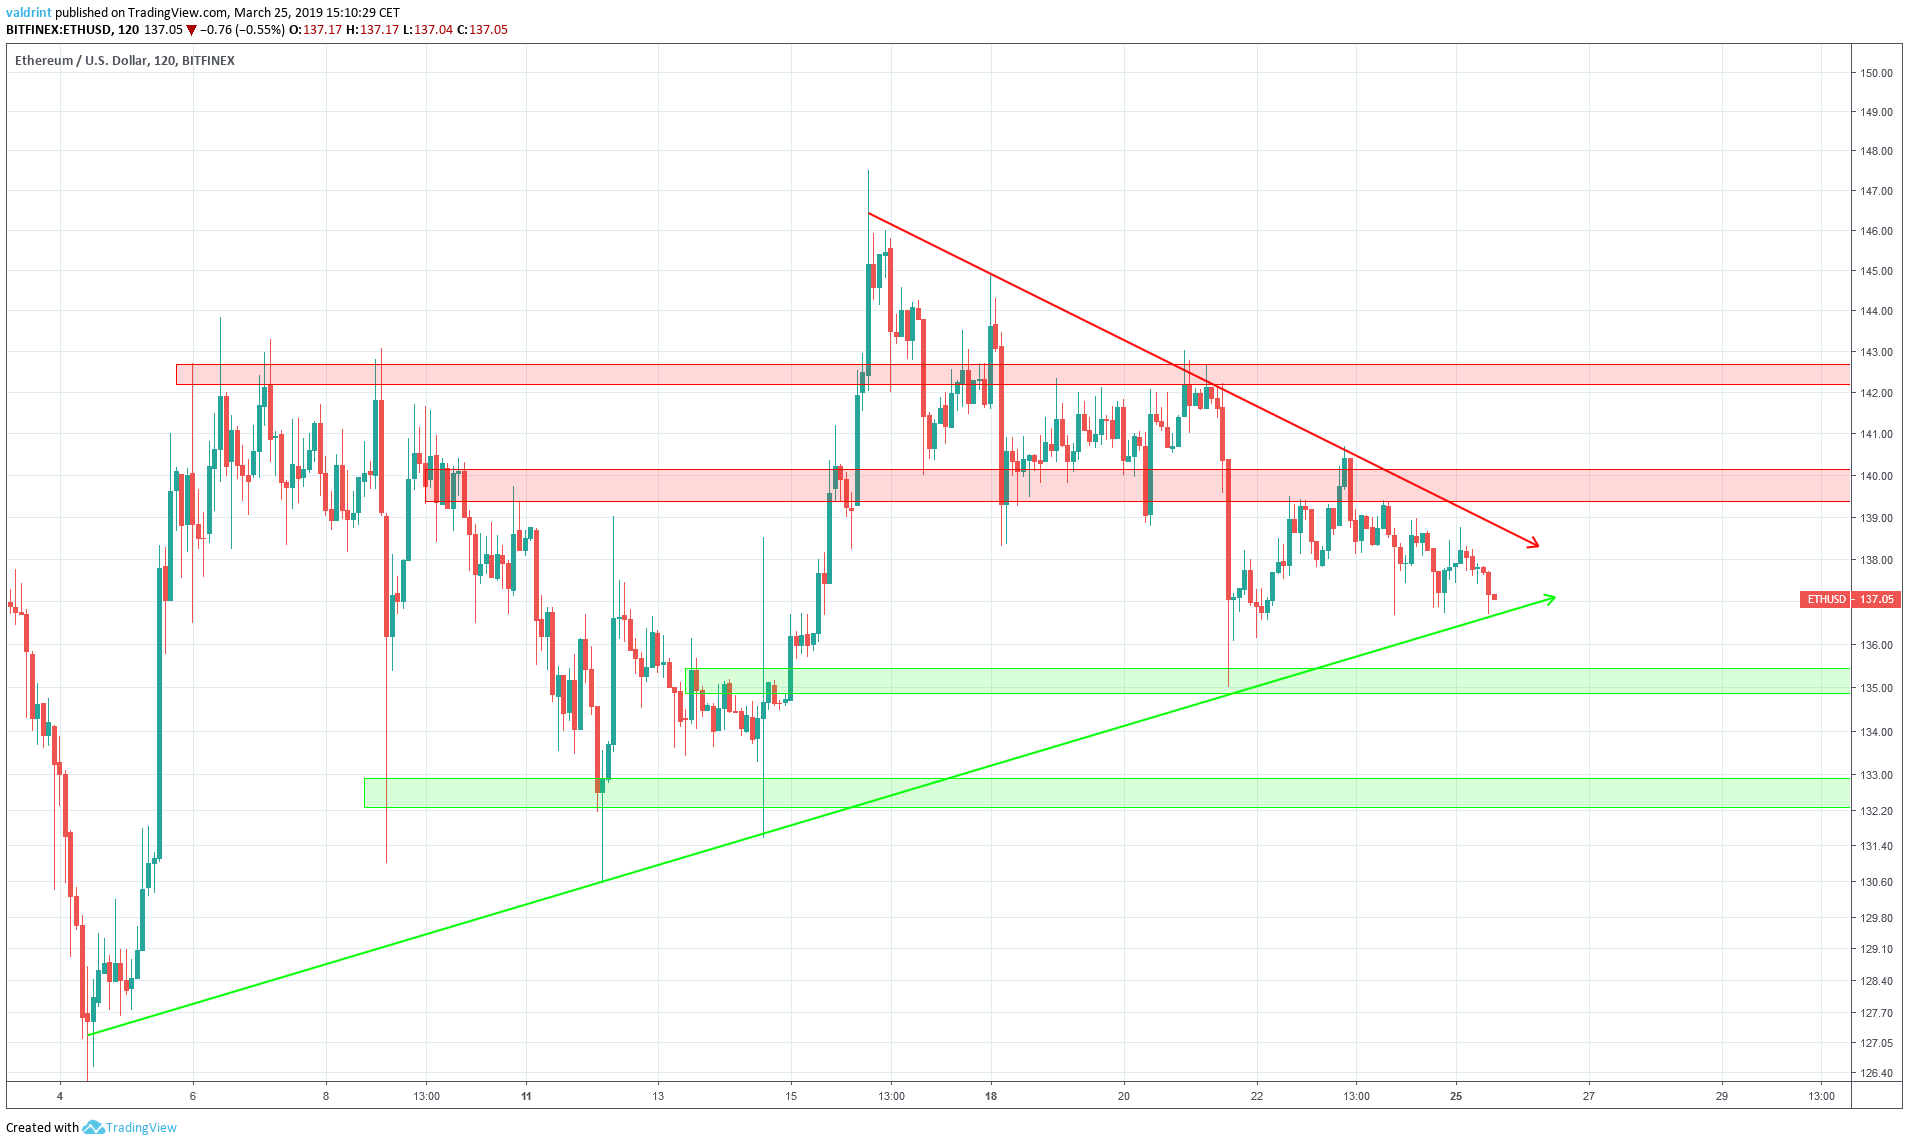 The first resistance area is located near $140, followed by the main resistance area at $145. If the price were to break out of the triangle, these two would provide likely reversal areas. Further price increases or a failed breakout could lead to prices close to $140 soon. However, a confirmed breakout would be required for the price to reach $145.
The closest support area is found near $134, with the second being found at $128. According to our analysis, it is unlikely that the price will reach this level in the near future.
The first resistance area is located near $140, followed by the main resistance area at $145. If the price were to break out of the triangle, these two would provide likely reversal areas. Further price increases or a failed breakout could lead to prices close to $140 soon. However, a confirmed breakout would be required for the price to reach $145.
The closest support area is found near $134, with the second being found at $128. According to our analysis, it is unlikely that the price will reach this level in the near future.
Summary of Analysis
Based on this analysis, the price of ETH may increase and touch the resistance line of the triangle. If the price touches the resistance line, this prediction will be partially validated. If it breaks out afterward, it will be fully validated. This prediction would be invalidated by a breakdown below the support line of the triangle. Do you think ETH will eventually break out of the triangle? Let us know your thoughts in the comments below. Disclaimer: This article is not trading advice and should not be construed as such. Always consult a trained financial professional before investing in cryptocurrencies, as the market is particularly volatile.Disclaimer
In line with the Trust Project guidelines, this price analysis article is for informational purposes only and should not be considered financial or investment advice. BeInCrypto is committed to accurate, unbiased reporting, but market conditions are subject to change without notice. Always conduct your own research and consult with a professional before making any financial decisions. Please note that our Terms and Conditions, Privacy Policy, and Disclaimers have been updated.

Valdrin Tahiri
Valdrin discovered cryptocurrencies while he was getting his MSc in Financial Markets from the Barcelona School of Economics. Shortly after graduating, he began writing for several different cryptocurrency related websites as a freelancer before eventually taking on the role of BeInCrypto's Senior Analyst.
(I do not have a discord and will not contact you first there. Beware of scammers)
READ FULL BIO
Sponsored
Sponsored