


Last week, there was a notable rebound in the Ethereum (ETH) price, which temporarily halted the previous downward trend that had persisted since April.
The ETH price is currently consolidating within a horizontal range, specifically between the levels of $1,650 and $1,950.
Considering the current short-term pattern and price action, it is more probable that the price will continue to move toward the upper boundary of this range and eventually experience a breakout.
Ethereum Increase Takes It Close to Yearly High
ETH, the native token of the Ethereum blockchain, was created by Vitalik Buterin. Analyzing the time frame outlook for ETH’s price reveals a mixed sentiment, which is leaning bullish. This is due to conflicting signals from both technical indicators and the price action.
In early April, it appeared that the price had broken through the $1,950 resistance level. However, this breakout turned out to be invalid. The price dropped the following week and has been decreasing since then (indicated by the red circle).
Two weeks ago, ETH hit a low point of $1,622 but then rebounded (green icon), confirming the $1,650 horizontal area as a support level. Presently, the price is trading within the range of $1,650 and $1,950.
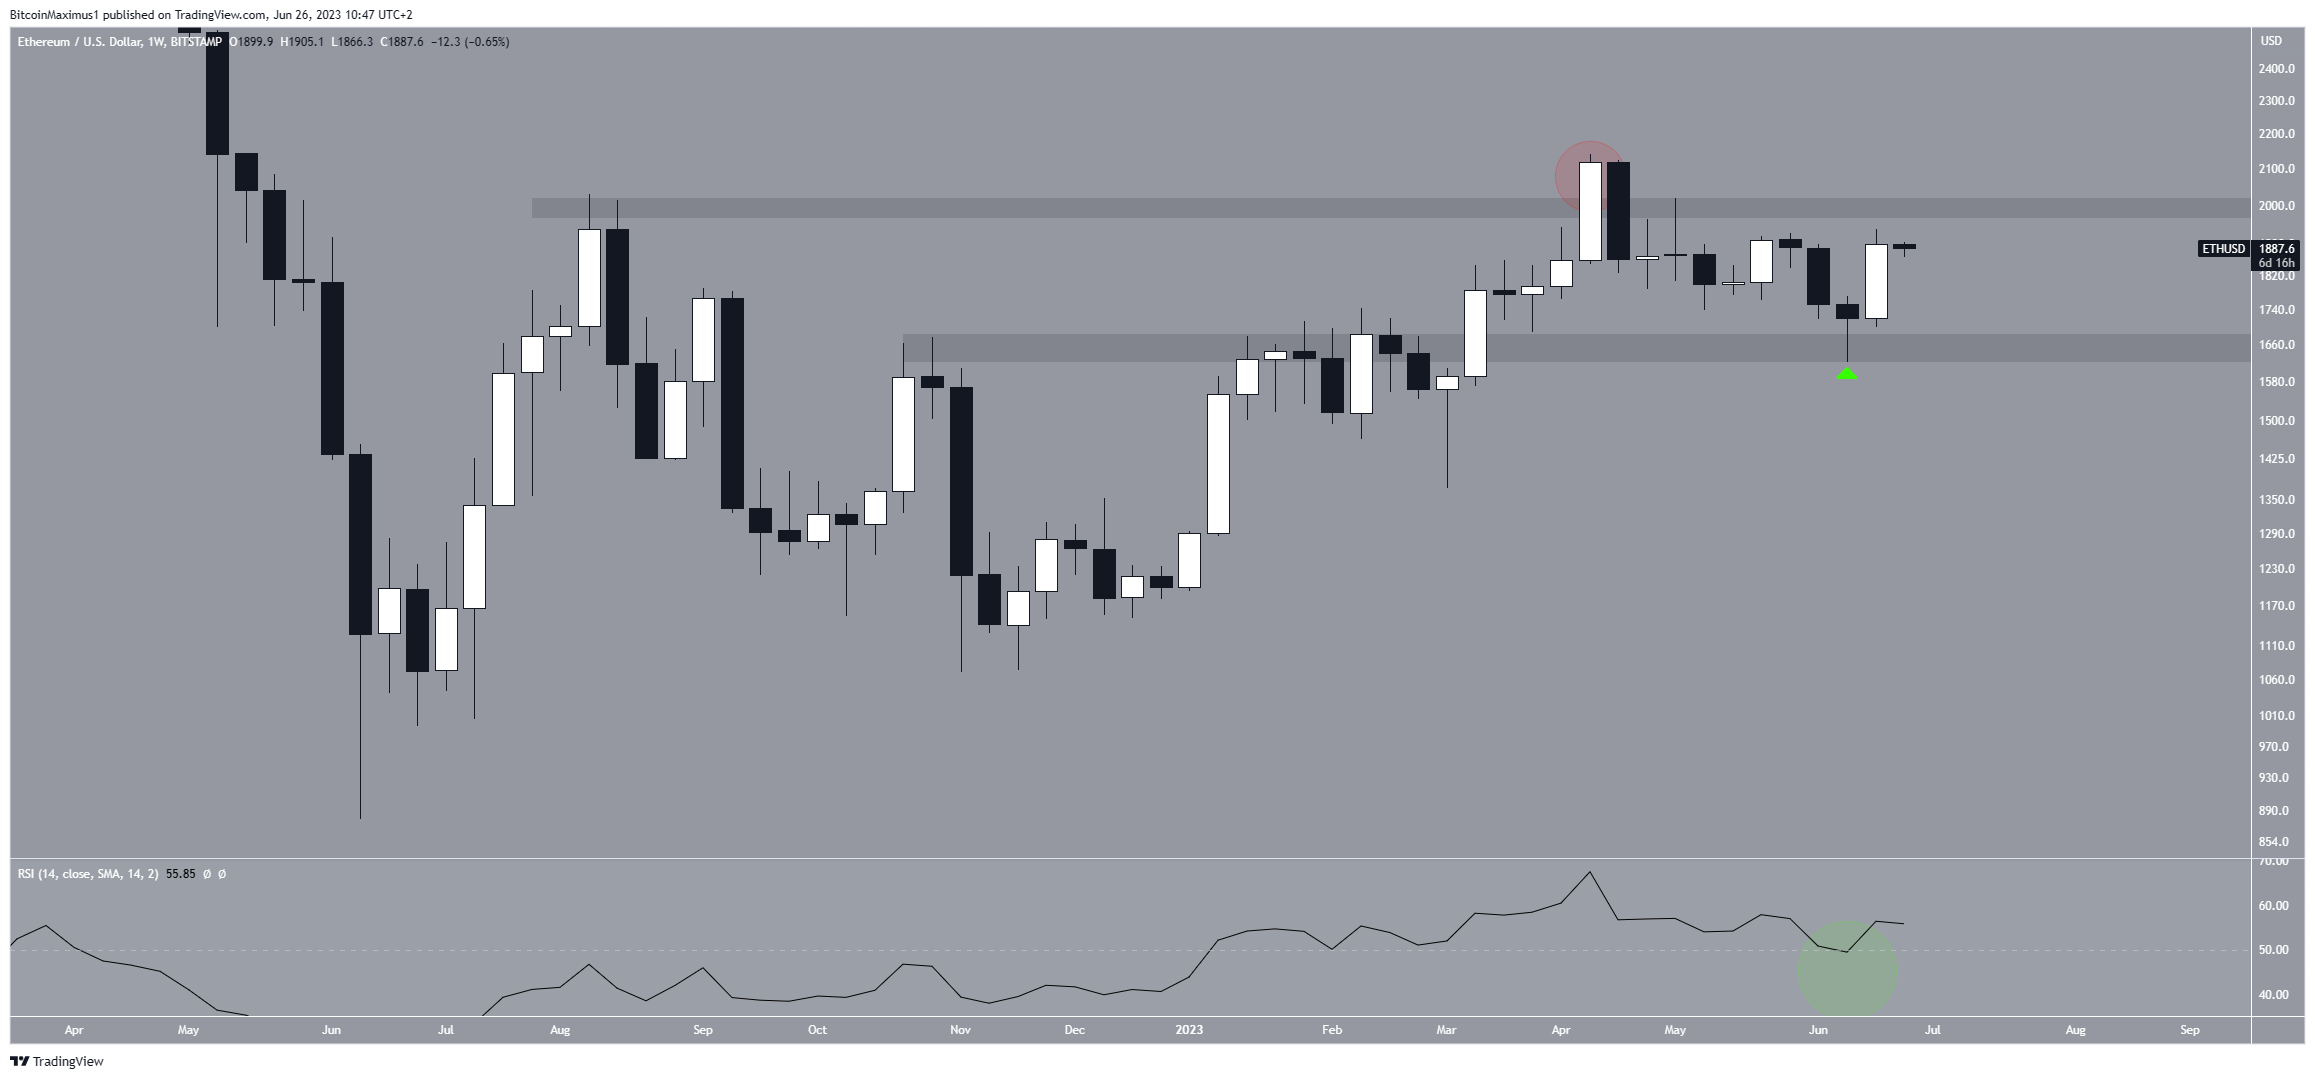
The weekly Relative Strength Index (RSI), a tool traders use to assess market conditions, supports the rebound, although it is currently at a critical level. The RSI value above 50 and an upward trend indicate a favorable position for the bulls, whereas a value below 50 suggests the opposite.
When the price rebounded, the RSI also bounced at the 50 line (highlighted by the green circle). This signals a bullish trend.
However, it is important to note that the RSI is still very close to the 50 line. Consequently, there is still a possibility that it could drop below 50, indicating a potential market downturn.
Read More: Best Crypto Sign-Up Bonuses in 2023
ETH Price Prediction: Wave Count Predicts New Yearly High
The technical analysis of the short-term daily timeframe provides an optimistic forecast for the price of Ethereum. This outlook is primarily based on the examination of price action and Elliot Wave patterns.
According to the most probable wave count, it is suggested that the price completed wave one of a five-wave increase (white), culminating in the yearly high on April 17. Subsequently, the price entered a descending parallel channel.
Typically, such channels contain corrective patterns. Given that a correction follows a five-wave increase, the movement within the channel is likely corrective, as evidenced by the W-X-Y pattern (black).
This view is further supported by the price rebounding at the 0.5 Fibonacci retracement level, which serves as a support.
The breakout from the channel on June 21 confirmed the completion of the correction. Consequently, the ETH price is anticipated to rise towards the next long-term resistance level of around $2,500. This is likely part of a long-term wave three.
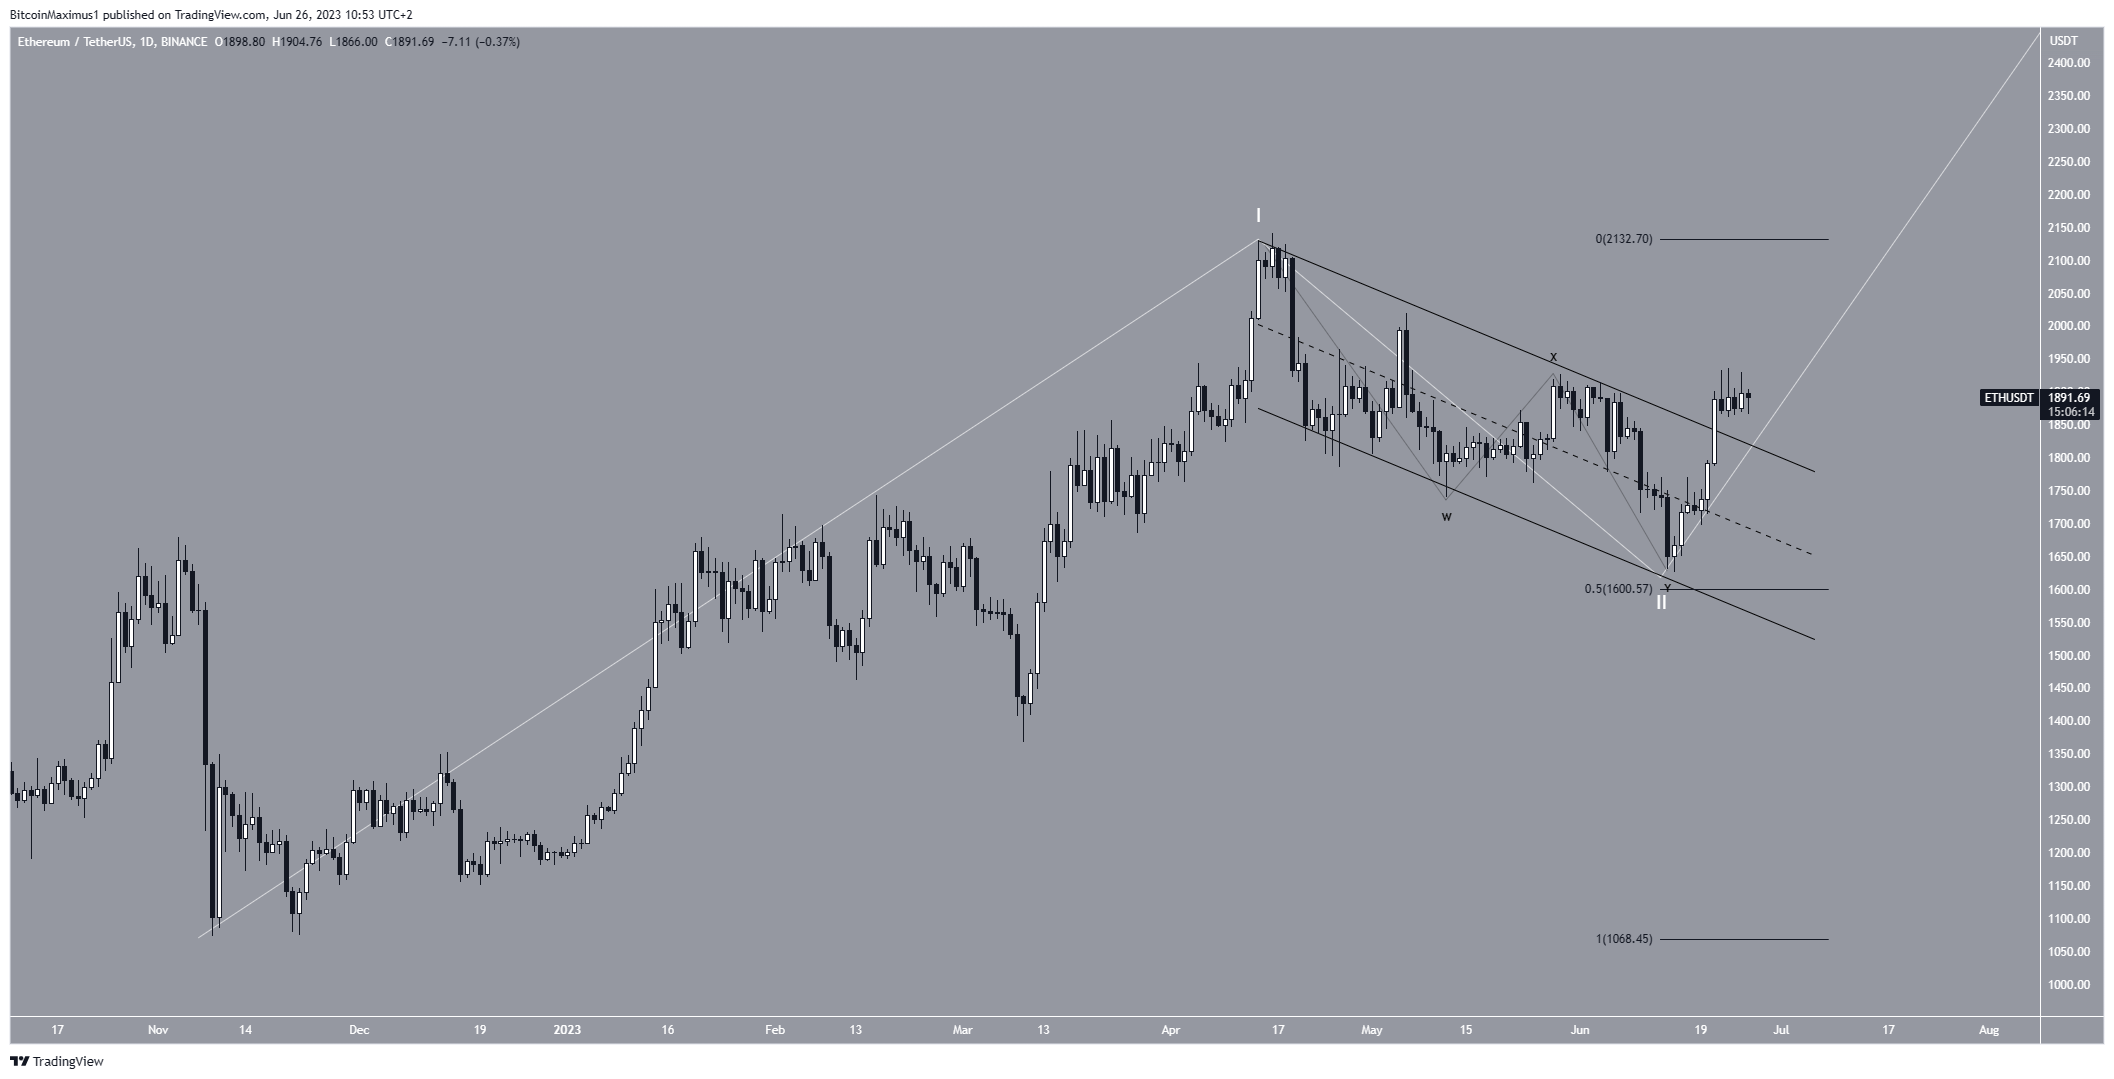
Despite this optimistic prediction, if the price falls within the channel again, it will invalidate the bullish wave count and suggest a bearish trend for ETH.
In that scenario, a decline toward $1,200 would become the most likely outcome.
Read More: 9 Best Crypto Demo Accounts For Trading


