
Ethereum (ETH) has created a double bottom pattern at the $1,730 horizontal support area.
The token has broken out from a descending resistance line and is increasing towards the closest resistance area.
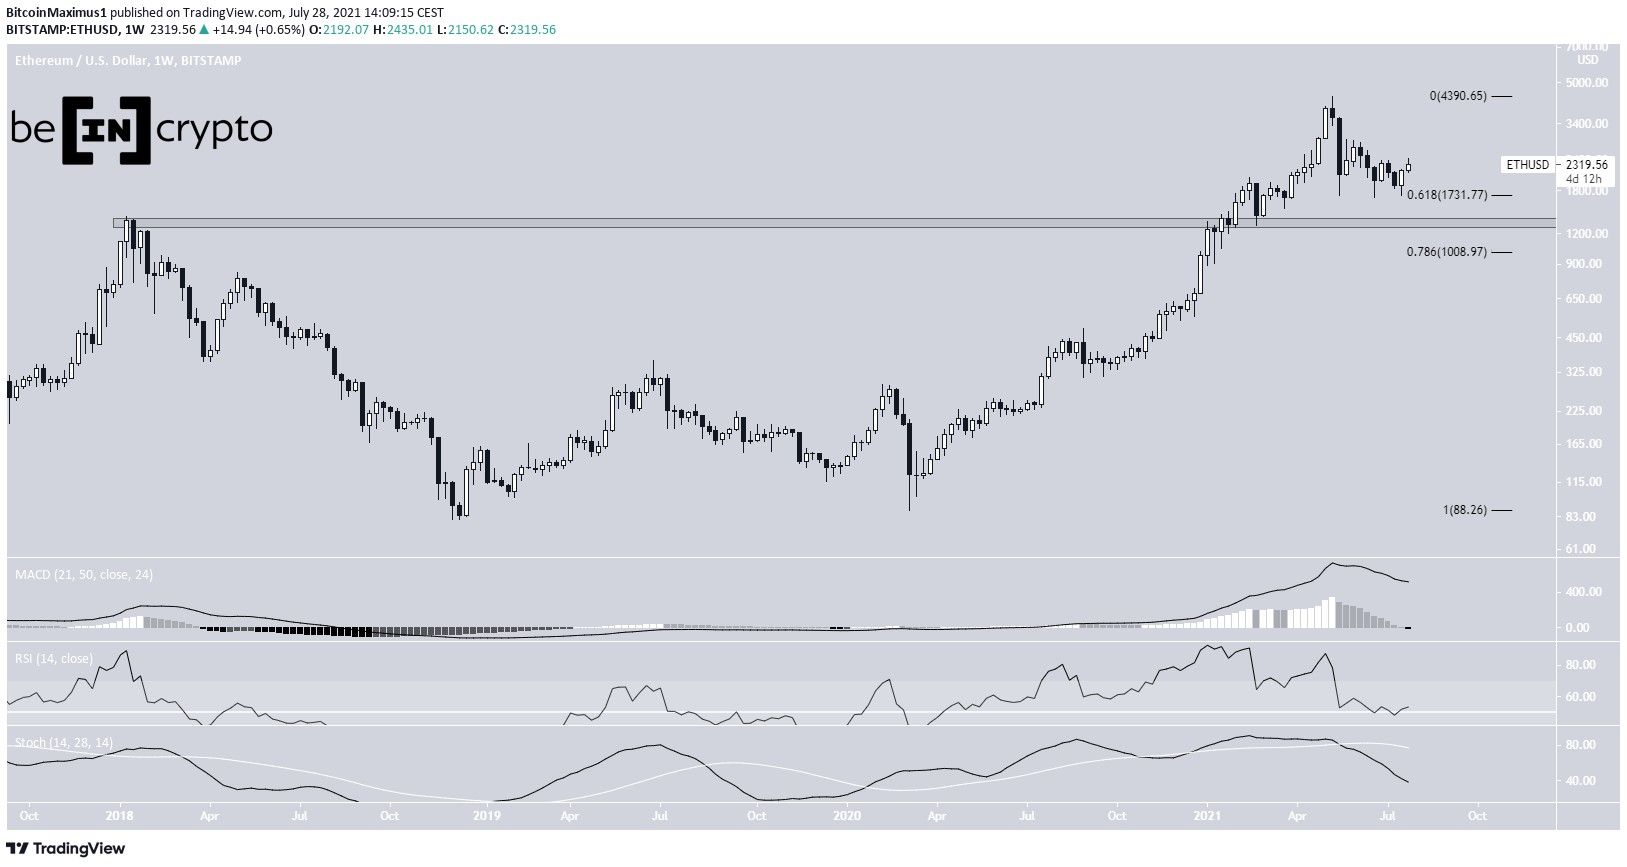
ETH bounces at long-term support
ETH has been decreasing since May 12, when it reached an all-time high of $4,320.
The downward movement caused a low of $1,730 to be reached on May 23. The low was made right at the 0.618 Fib retracement support level when measuring the entire upward movement since March 2020. In addition to this, it left a lower wick in its wake, a sign of buying pressure.
ETH returned to this level twice more, more specifically on June 22 and July 20 and initiated bounces.
Despite the bounce, technical indicators are bearish. The Stochastic oscillator has made a bearish cross. The MACD & RSI are both falling, the latter having just crossed below 50.
The next closest support levels are at $1,320, a horizontal support level that marks the previous all-time high, and $1000, the 0.786 Fib retracement support level.
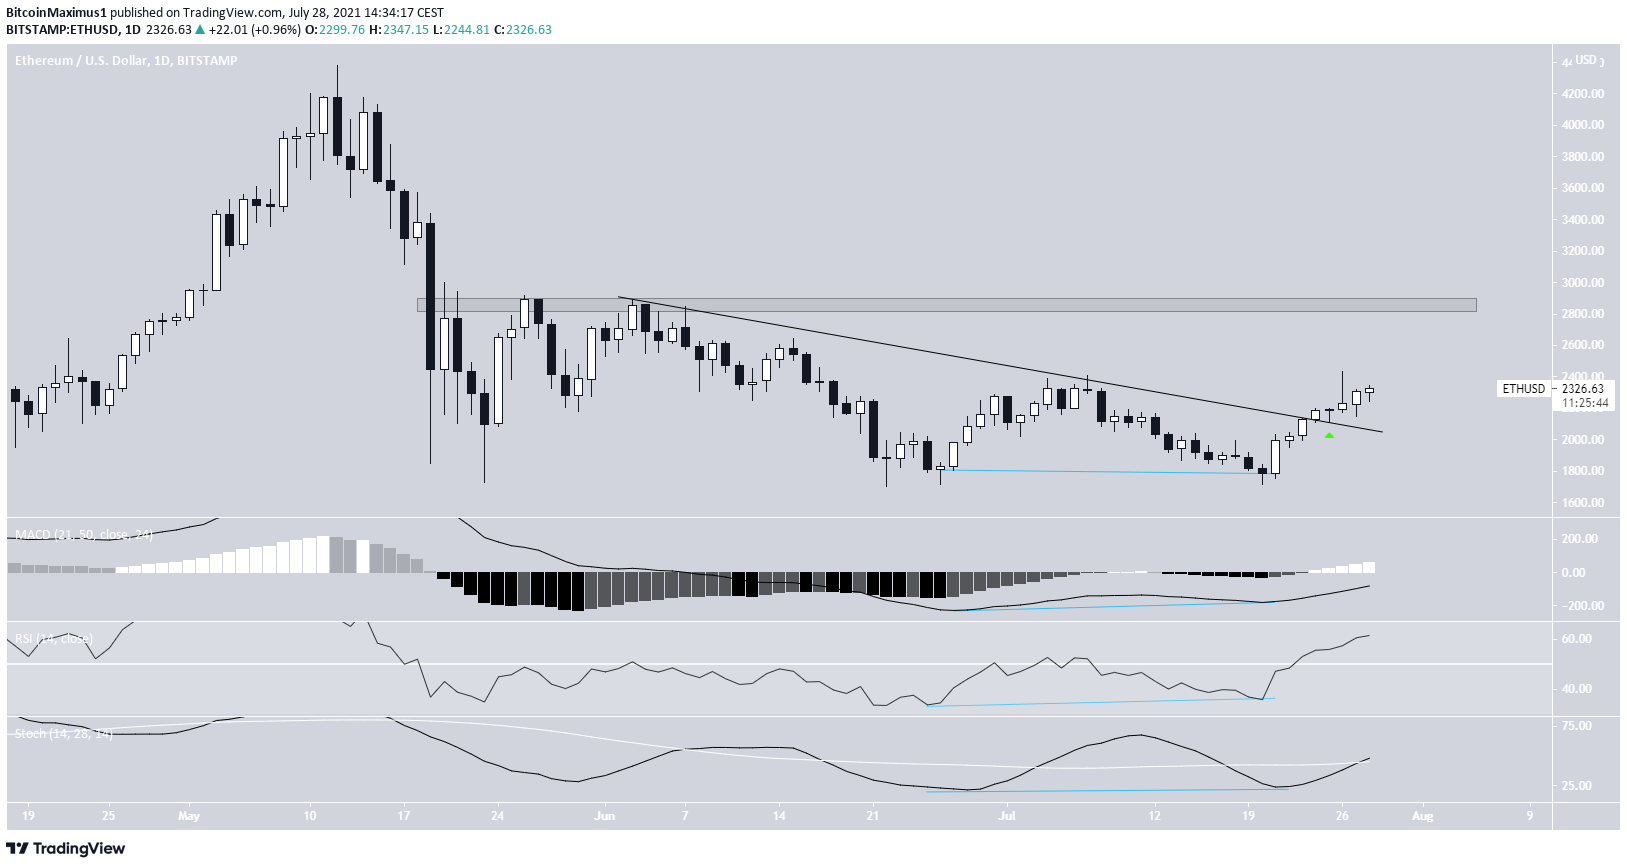
Double bottom and breakout
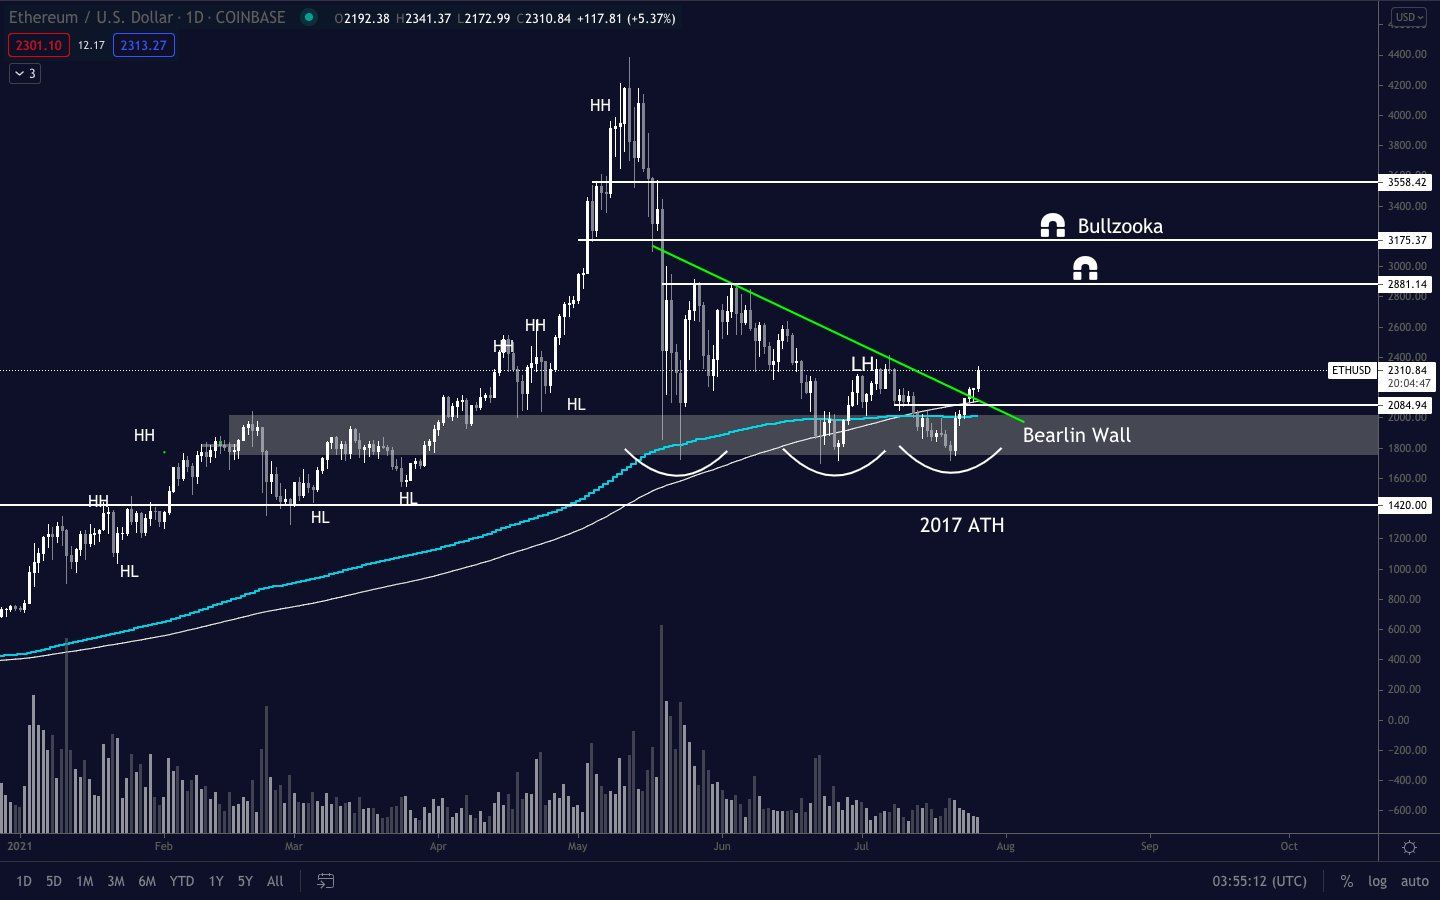
Cryptocurrency trader @Pentosh1 outlined an ETH chart, stating that the token could increase towards $2900-$3100.
The daily chart does indeed look more bullish. ETH created a double bottom pattern which was combined with bullish divergences in the MACD, RSI & Stochastic oscillator.
Afterwards, it managed to break out from a descending resistance line and validate it as support (green icon).
It is currently increasing towards the $2,850 resistance area.
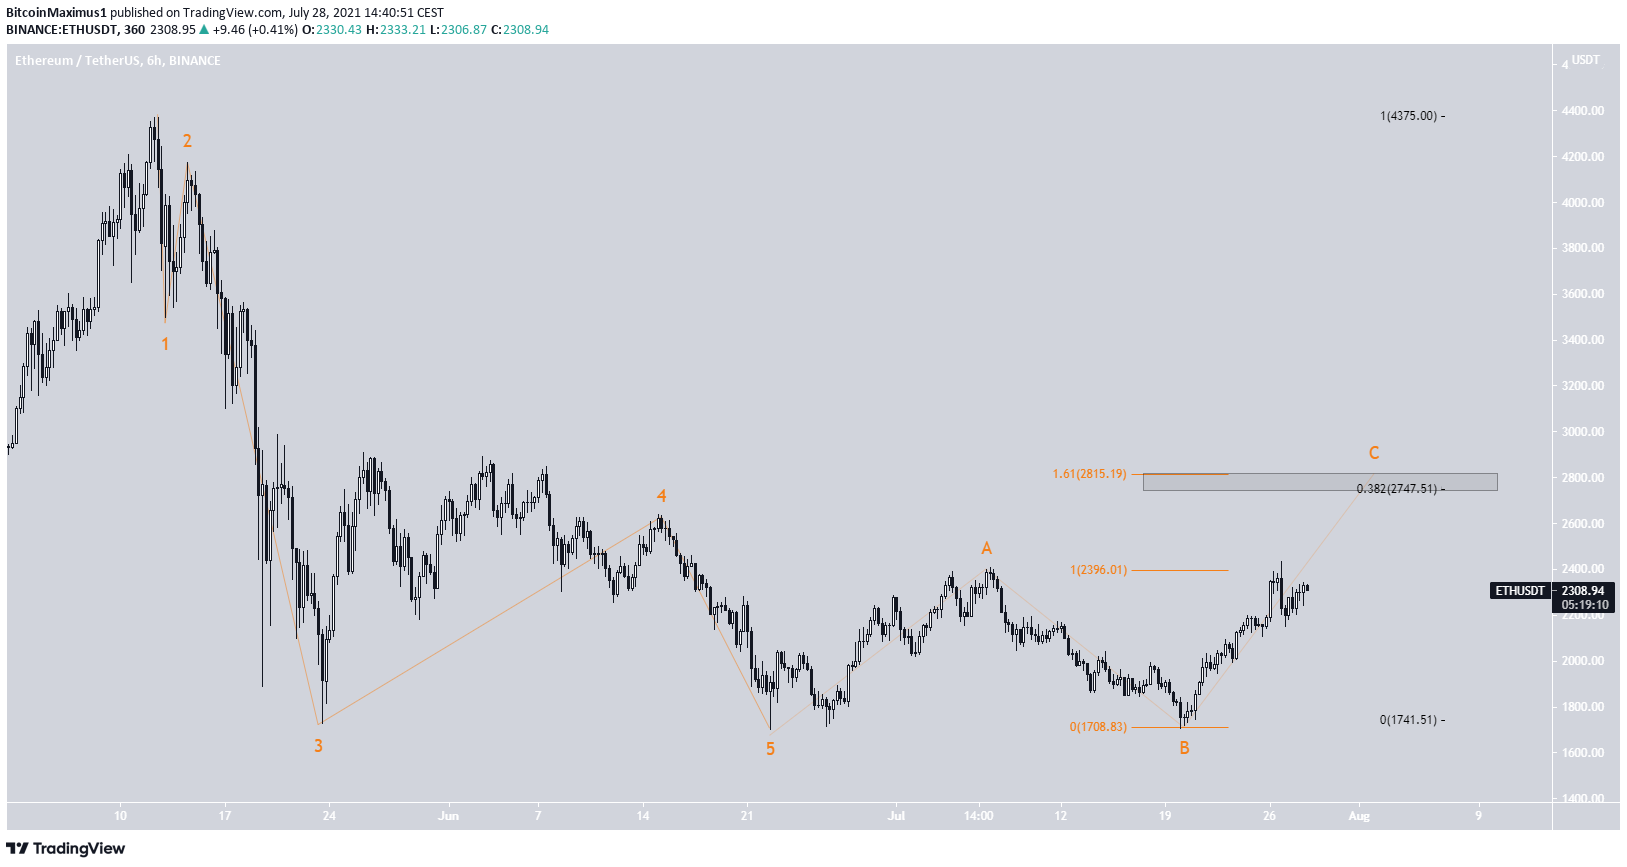
Wave count
The wave count suggests that that ETH is currently in an A-B-C corrective structure that is transpiring after a bearish impulse. If correct, the token is currently in the C wave.
ETH has already reached a high of $2,396, giving waves A:C a 1:1 ratio. However, due to the fact that it has not even reached the 0.382 Fib retracement resistance level when measuring the entire downward move, an extension on the C wave would make more sense. This would likely take the token between $2,750 and $2,815, the 0.382 Fib retracement resistance level (black) and the 1.61 length of wave A (orange).
For BeInCrypto’s latest bitcoin (BTC) analysis, click here.
