


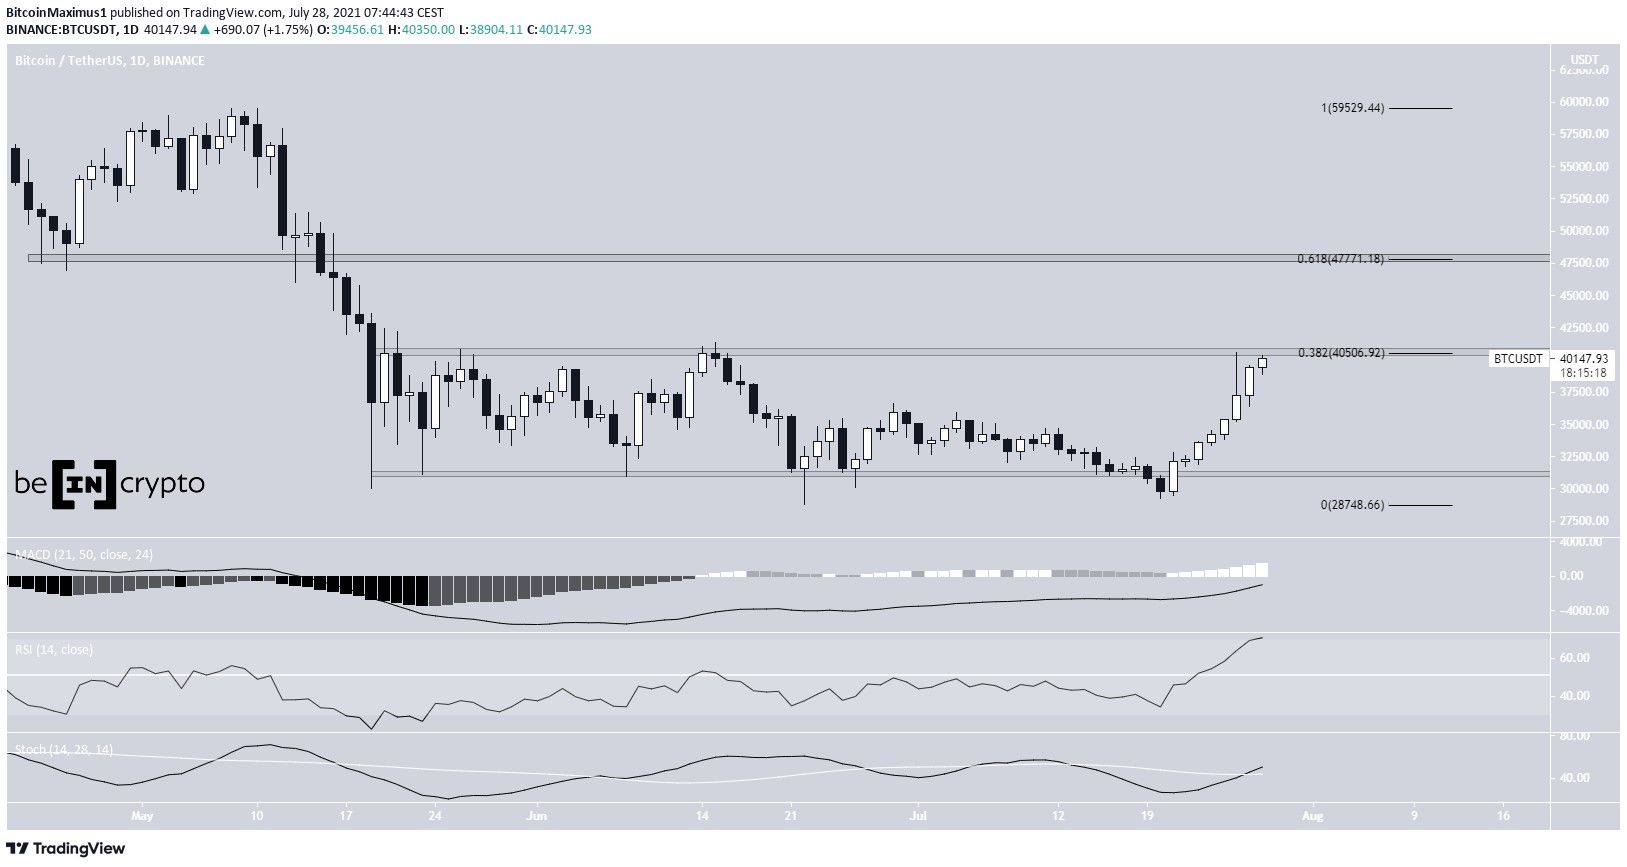
After being rejected on June 26, Bitcoin (BTC) is now making another attempt at breaking out above the $40,550 resistance area.
Despite showing short-term signs of weakness, BTC is expected to eventually break out.
BTC attempts to break out
BTC has been moving upwards since July 20. On July 26, it reached the $40,500 resistance area and decreased, leaving a long upper wick in place.
However, it resumed its ascent on July 27, and is now making another attempt at breaking out above the $40,500 area. Besides being a horizontal resistance area that has been in place since May 19, this is also the 0.382 Fib retracement resistance area.
If a breakout occurs, the next closest resistance area would be found at $47,771. This is the 0.618 Fib retracement resistance level.
Technical indicators in the daily time-frame are bullish, supporting the possibility of a breakout. The RSI has crossed above 70 and the Stochastic oscillator has made a bullish cross. Despite the MACD increasing, it is not yet positive.
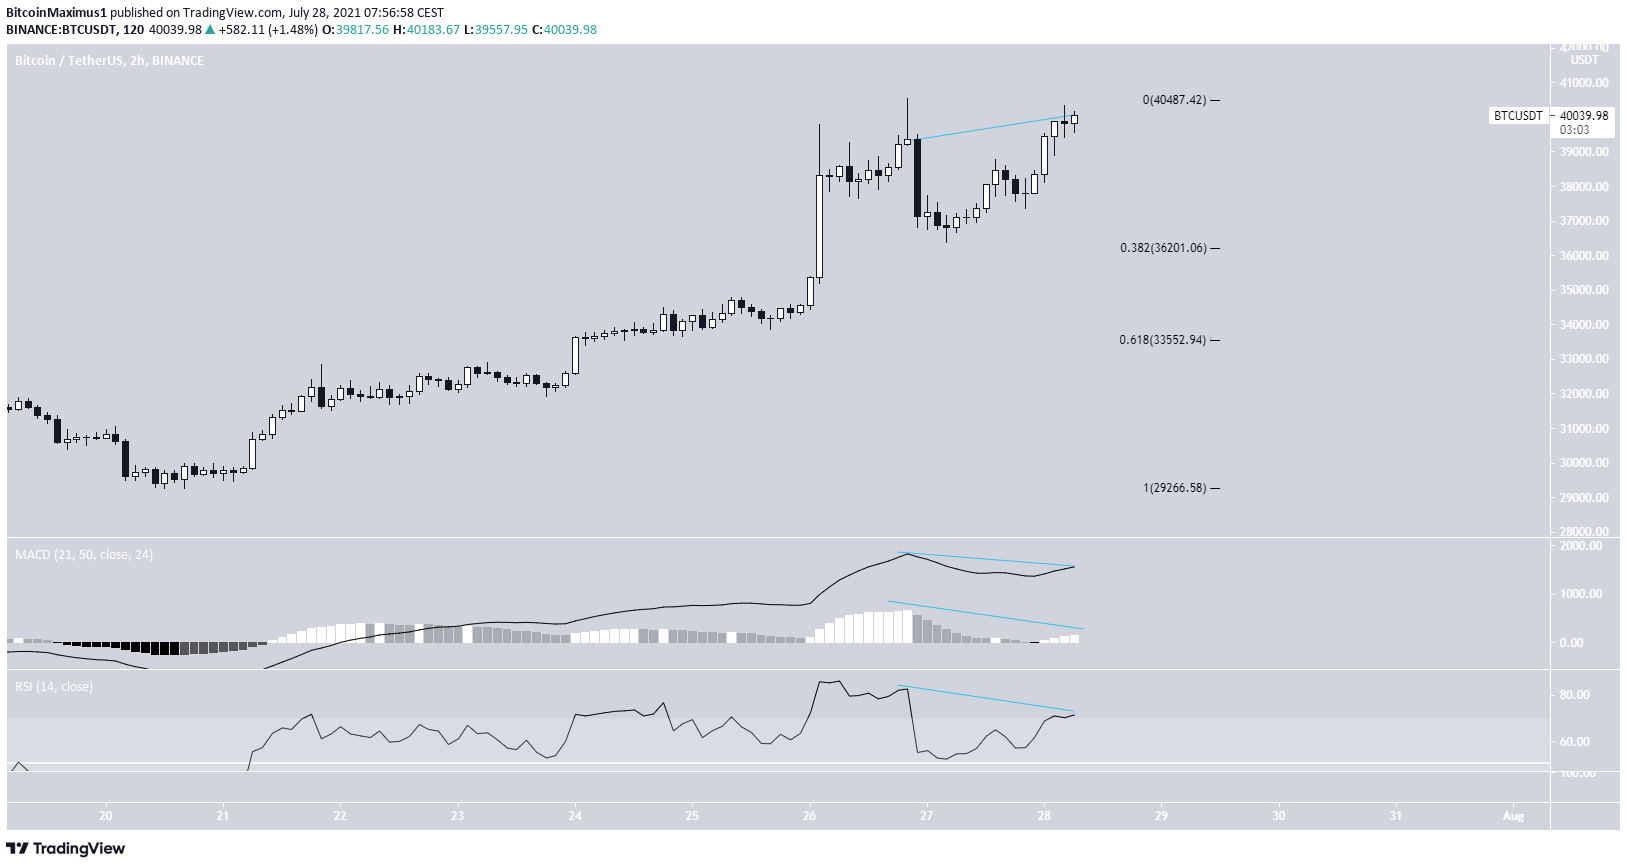
Short-term movement
The two-hour chart is not as bullish as the daily one. Besides a potential double top pattern, there is a considerable bearish divergence visible in both the RSI and MACD.
Furthermore, BTC is trading at a resistance level that created a long upper wick on July 27.
If a rejection occurs, the closest support levels would be found at $36,200 and $33,550. These are the 0.382 and 0.618 Fib retracement support levels.
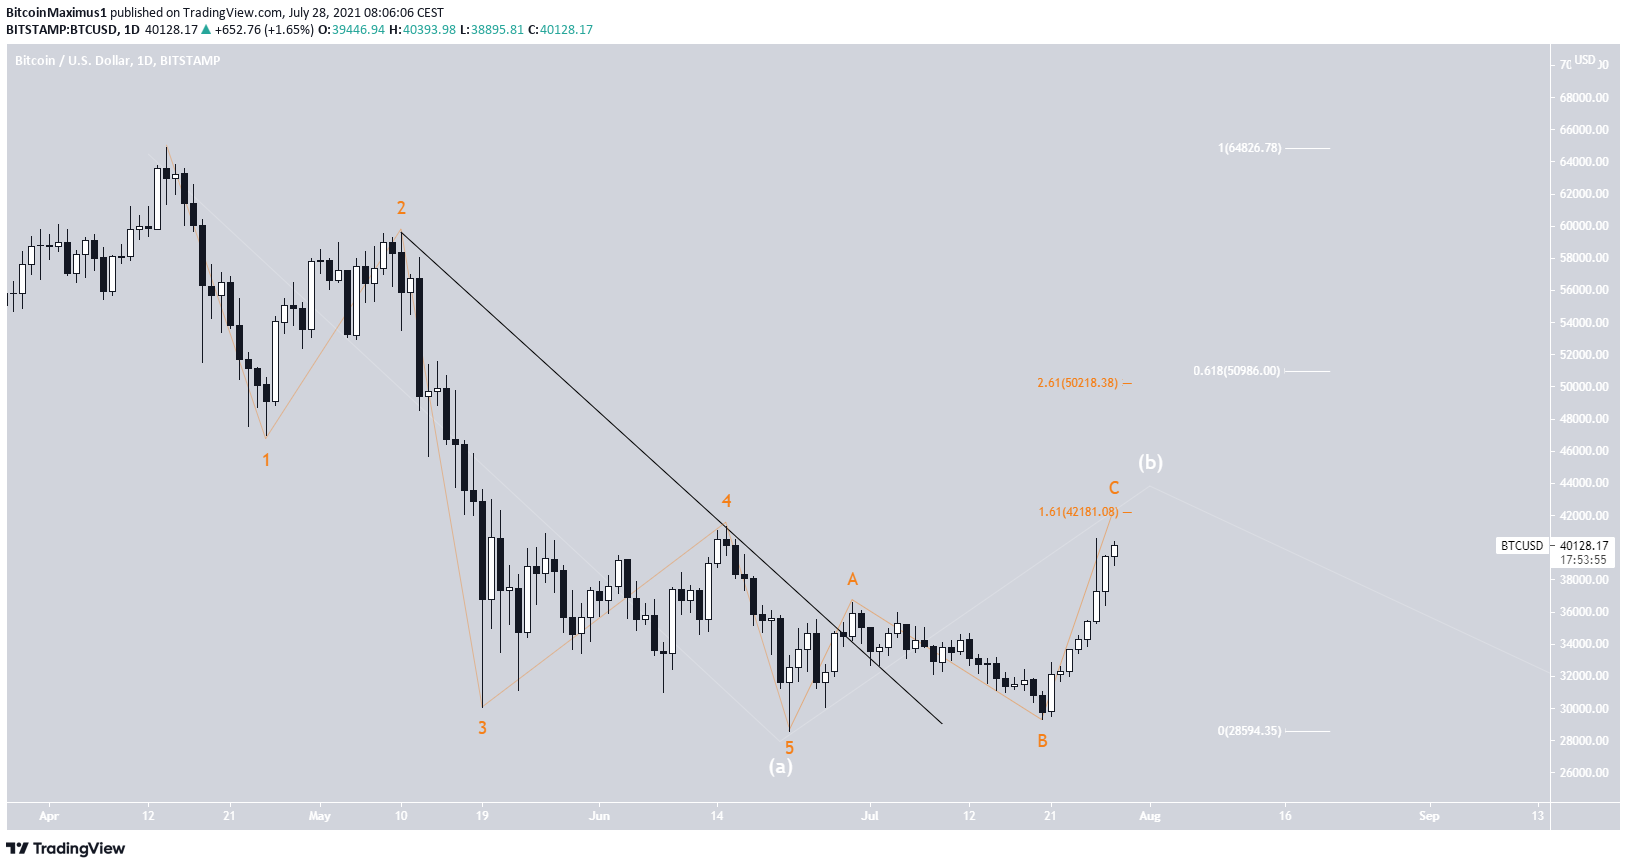
Wave count
The most likely wave count indicates that BTC is in wave C (orange) of an A-B-C correction. The sub-wave count is shown in red, showing that BTC is in sub-wave five after completing a fourth wave pullback.
A high of $42,181 would give waves A:C a 1:1.61 ratio, making it the most likely target.

While it’s possible that wave C extends to the 2.61 length of A to reach $50,218, the most likely top still remains at $42,181.
After the high is reached, one more drop would be expected.
For BeInCrypto’s latest bitcoin (BTC) analysis, click here.


