


The Enjin Coin (ENJ) price has broken out above a significant resistance area. A similar breakout was the catalyst for the all-time high price reached in March 2019.
Enjin Coin Price Highlights
- ENJ is following an ascending support line.
- There is resistance at 1800 and 2900 satoshis.
- ENJ is following a fractal that gives a target of 8000 satoshis.
Trader @imBagsy tweeted an ENJ chart which shows that the price is in the process of breaking out. In addition, a comparison is made with a previous movement that shows that the current breakout is occurring slightly earlier relative to the previous move.
The party is starting a week early on this one. 🔥 pic.twitter.com/1PhL5q8d8i
— Bagsy (@Bagsy) February 4, 2020
Is the breakout legitimate? If yes, how long will the price continue to increase? Keep reading below if you are interested in finding out.
Enjin Coin Breakout
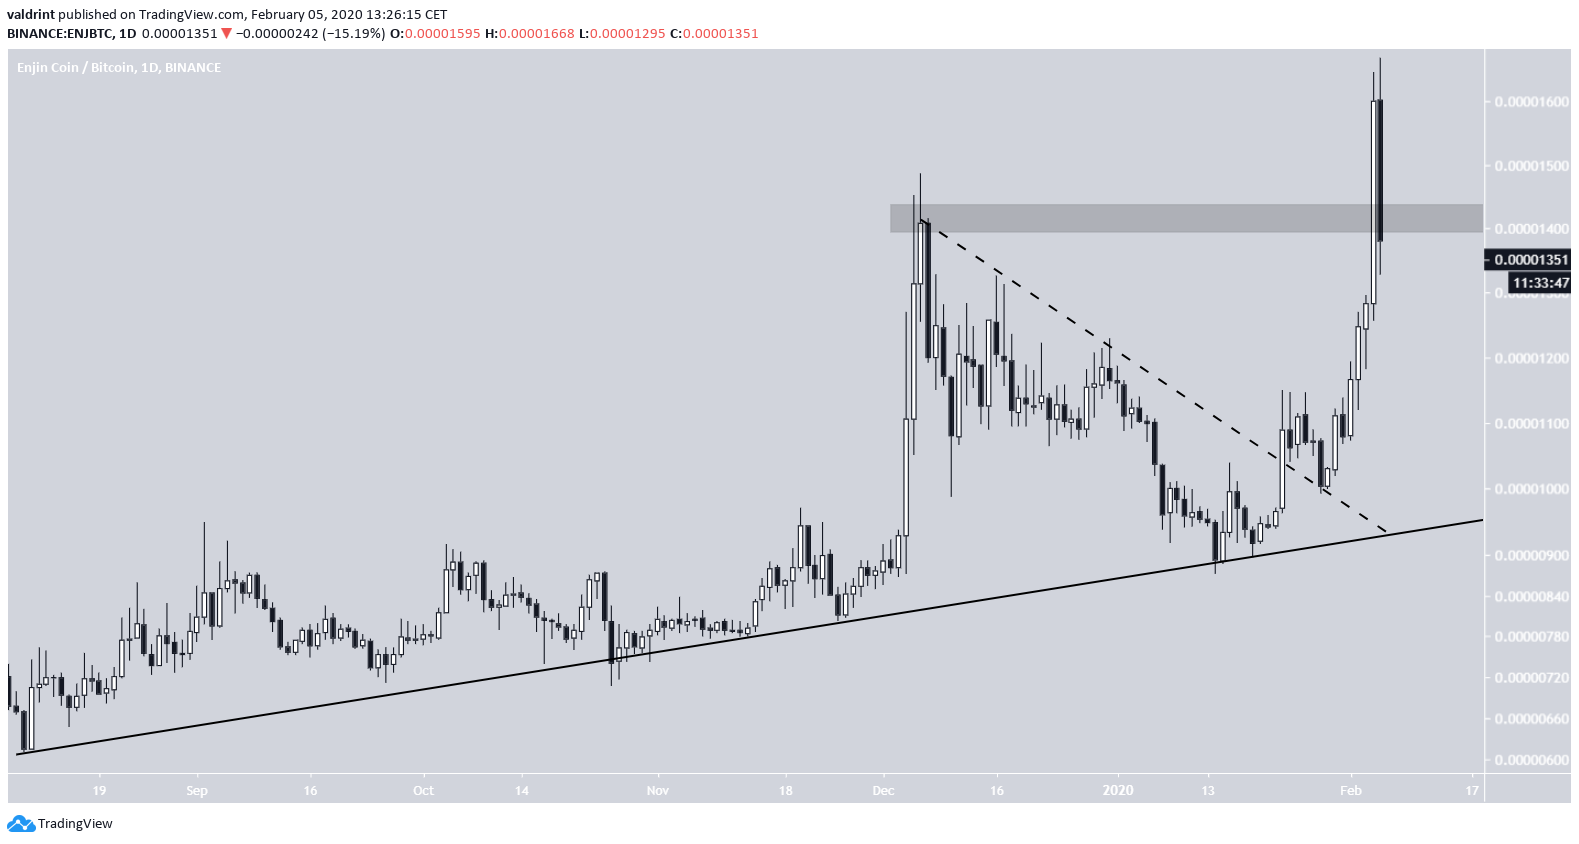
The ENJ price has been increasing at a rate measured by an ascending support line since August 9, 2019.
In addition, the price created a descending resistance line on December 19, out of which the price broke out on January 23. The price validated this line on January 28 and has been moving upwards since
There was resistance at 1400 satoshis, near the high of December 6, but the price moved above it without experiencing any type of retracement. Currently, it seems to be in the process of validating it as support.
Similarities
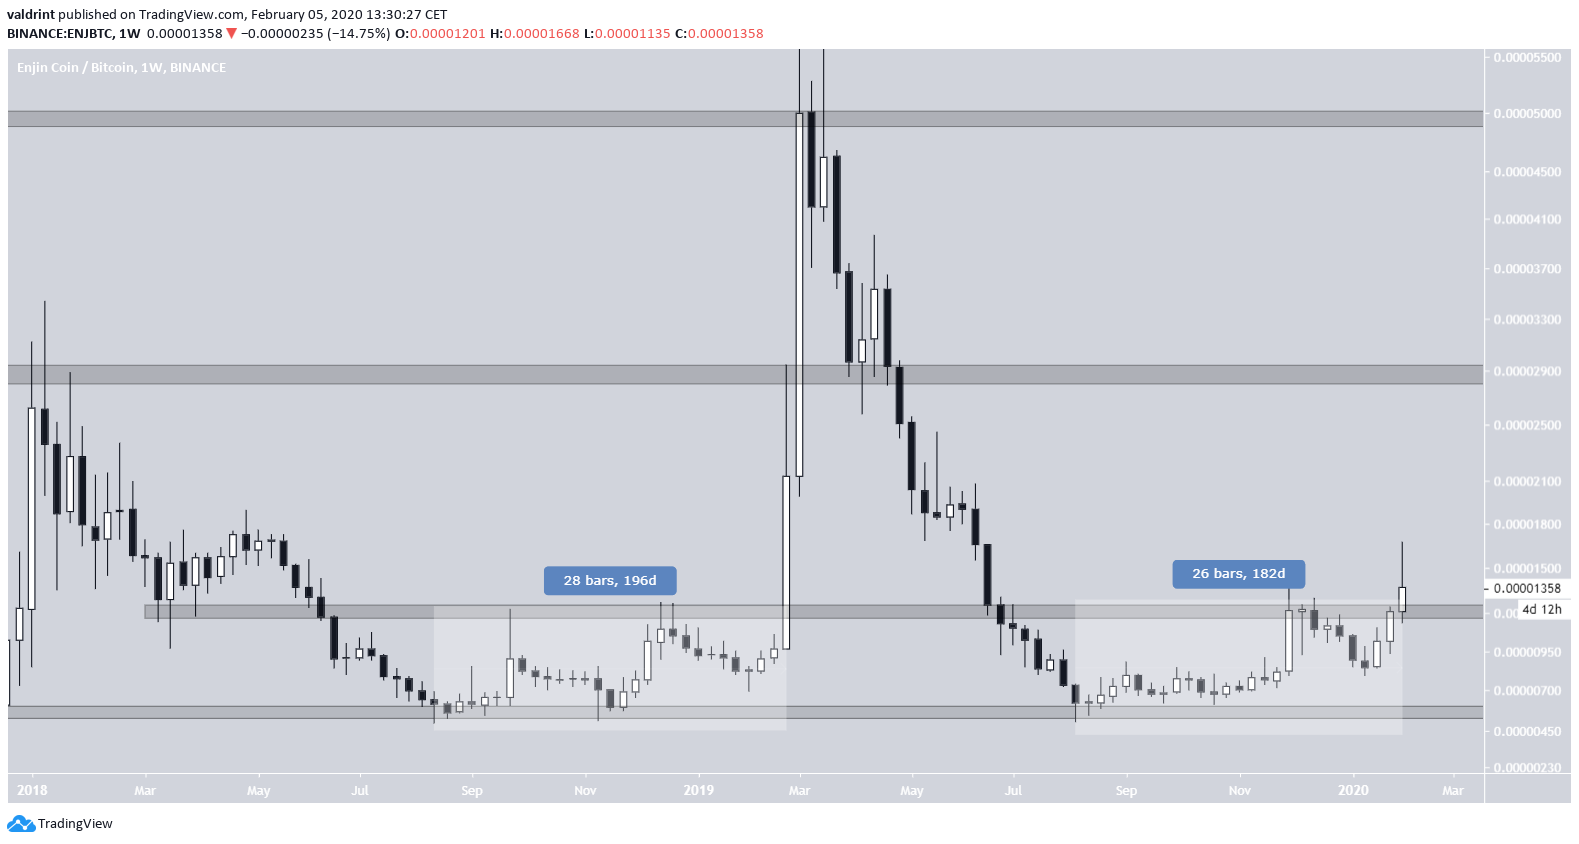
The other move outlined in the tweet transpired over August 2018-February 2019. The price consolidated between 550 and 1200 satoshis for 196 days before breaking out.
In the current movement, the ENJ price consolidated for 182 days before doing so.
The next resistance areas are found at 2900 and 5000 satoshis.
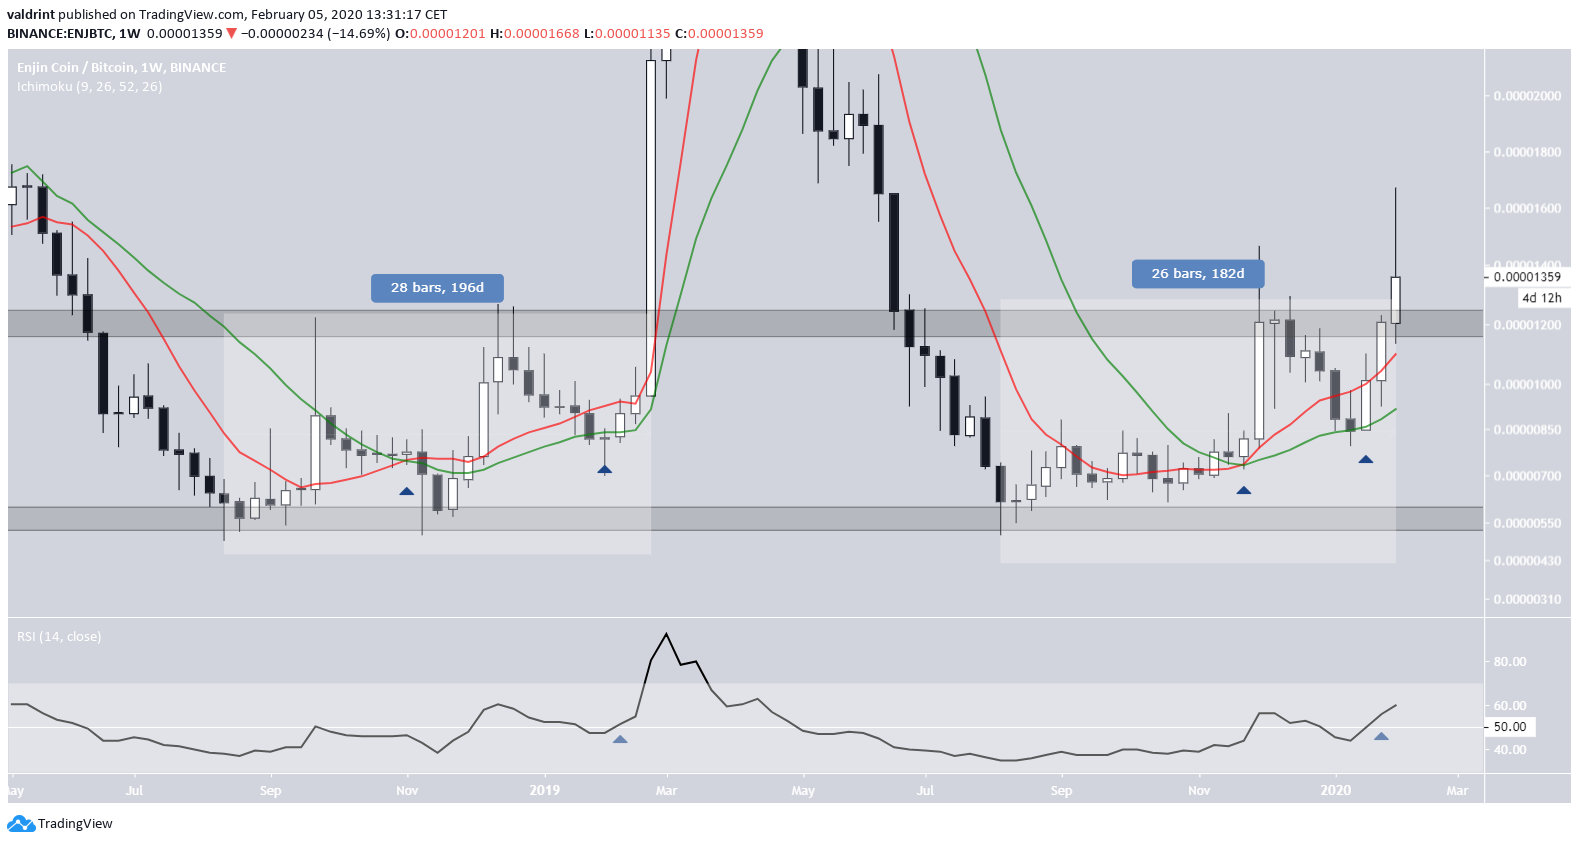
The technical readings between these two movements are almost identical.
A bullish cross between the 10- and 20-week moving averages (MAs) transpired in the middle of the consolidation period and led to the price reaching the resistance area.
Afterward, the ENJ price returned to validate the 20-week MA before breaking out above resistance. After the price validated the MA, the RSI moved above 50.
These readings have been true in both cases, confirming the similarity between the two movements.
Future Movement
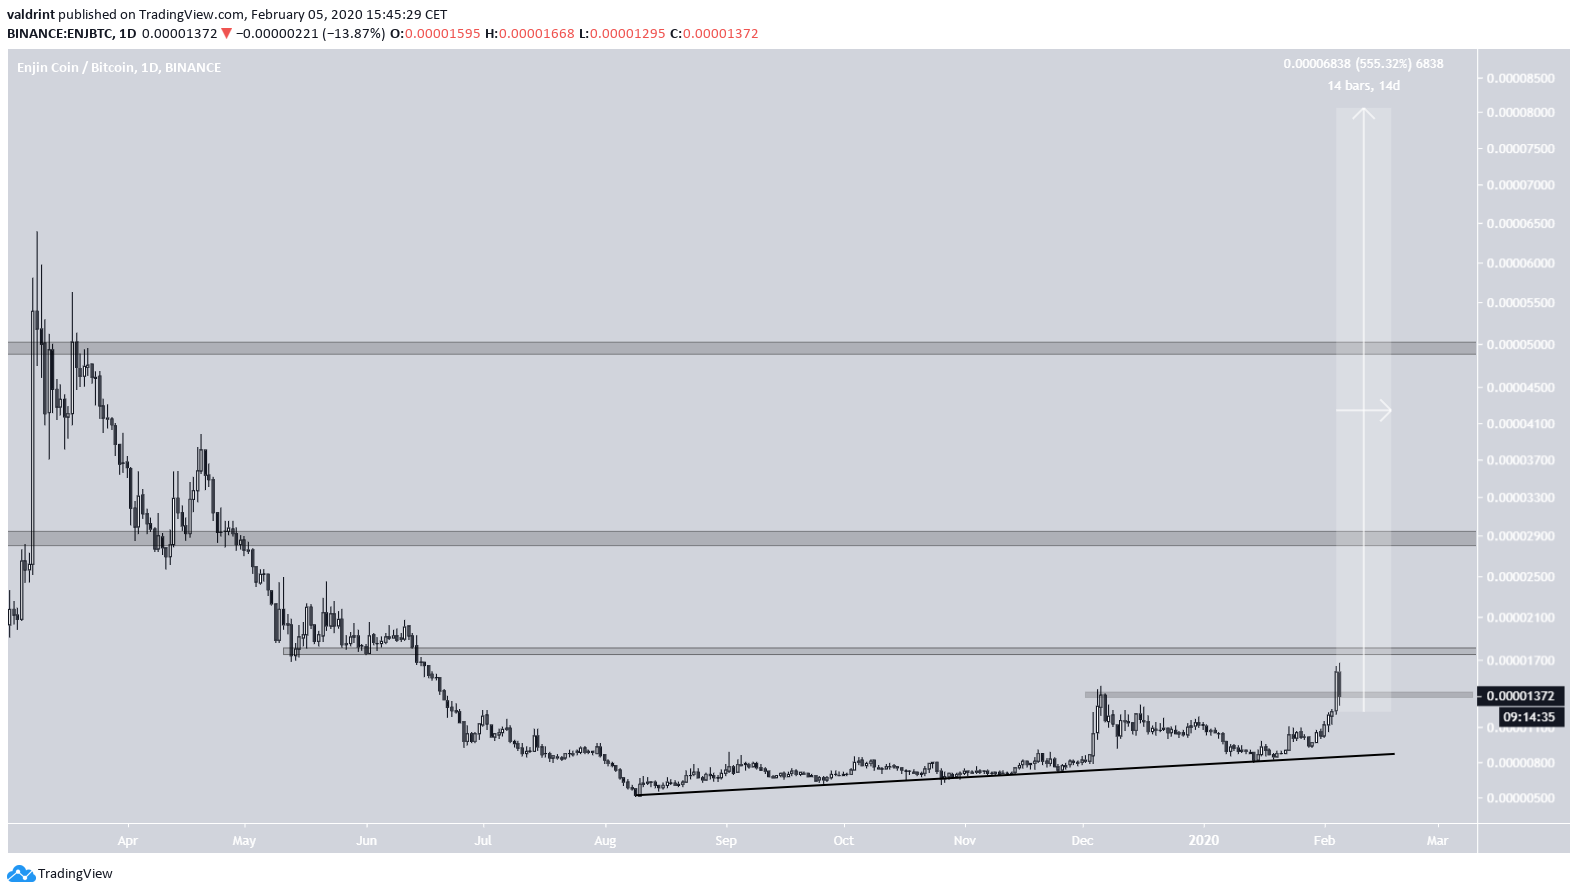
In February 2019, it took the price 14 days after the breakout to reach the all-time high — which was an increase of 564 percent, measuring from the low of the breakout candlestick.
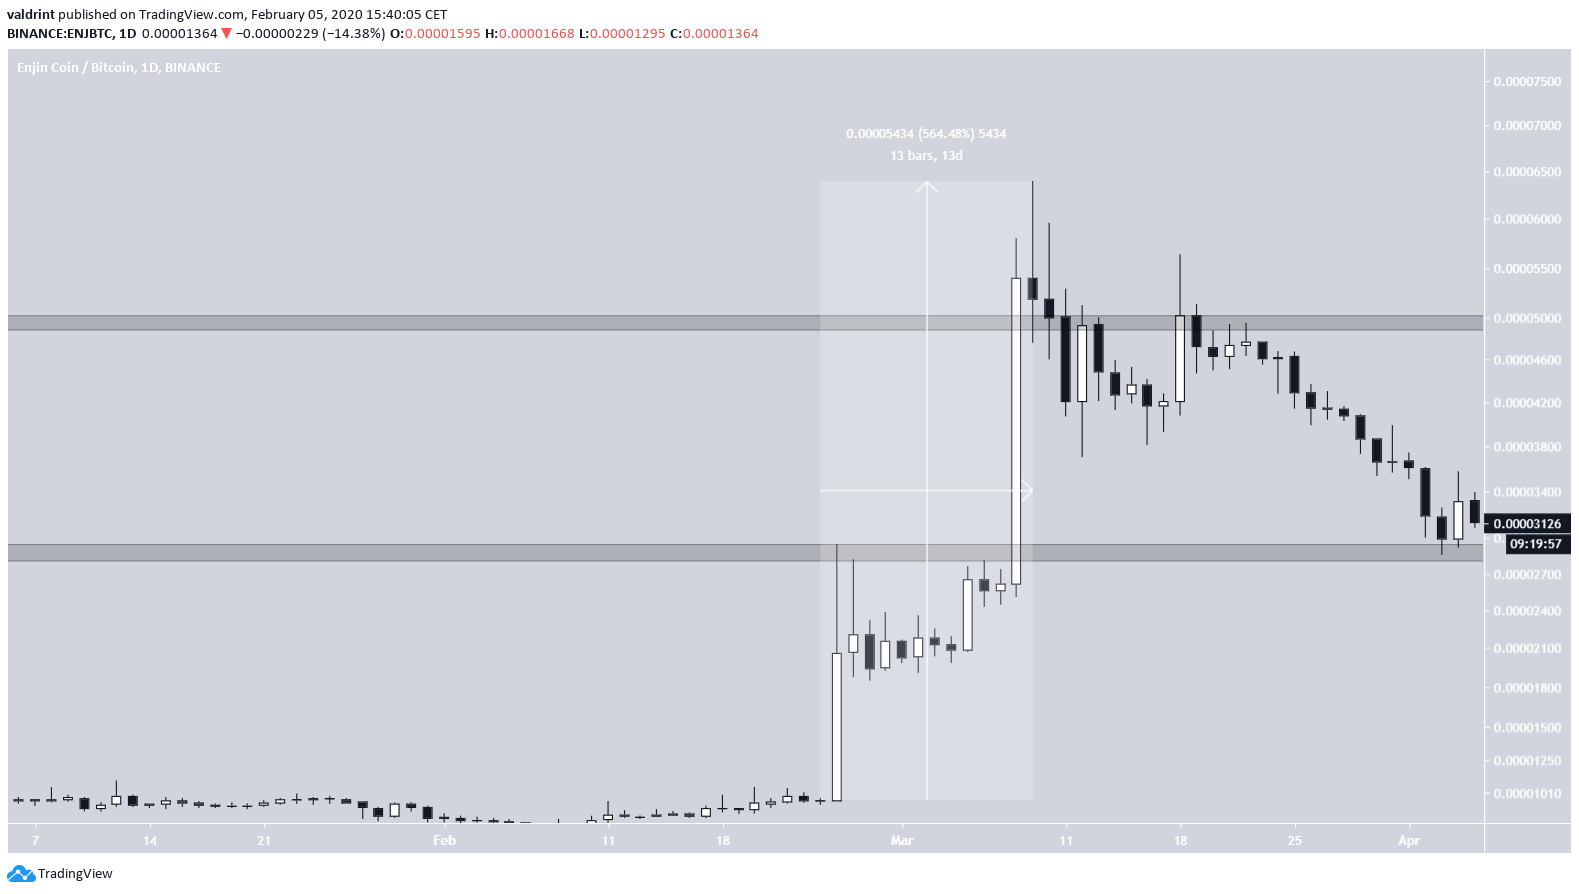
If an identical increase were to transpire, the ENJ price will reach a high of 8000 satoshis on February 14. While we do not expect the price to necessarily go on such a spree, the extreme similarities with the previous move make the first two targets at 1800 and 2900 satoshis very likely to be reached within the next two weeks.
To conclude, the ENJ price is in the process of breaking out above a significant resistance area. We believe this could be the beginning of a very rapid upward move, similar to that which transpired in February 2019.


