


If the Enjin Coin (ENJ) price follows a similar pattern that it had laid out in 2018, it could break out above the current trading range between February and May.
At the time of writing, the price was re-testing the 800 satoshi area, likely validating it as support. In addition, it is following an ascending support line with a very gradual slope. While the price has been decreasing since Dec 5, the corrective period might soon come to an end.
https://twitter.com/devchart/status/1217344483089637376?s=19
Well-known trader @devchart outlined an Enjin Coin price chart, stating that he is monitoring the price movement. If the price manages to increase above the 100-day moving average, things could get interesting.
Significant Areas for ENJ
The entire ENJ price history shows that the most significant price areas are found at 550 satoshis (support) and 1,250 satoshis (resistance).
The price has reached the support area twice, once in August 2018 and again in August 2019. In 2018, a breakout transpired after 196 days at the beginning of February.
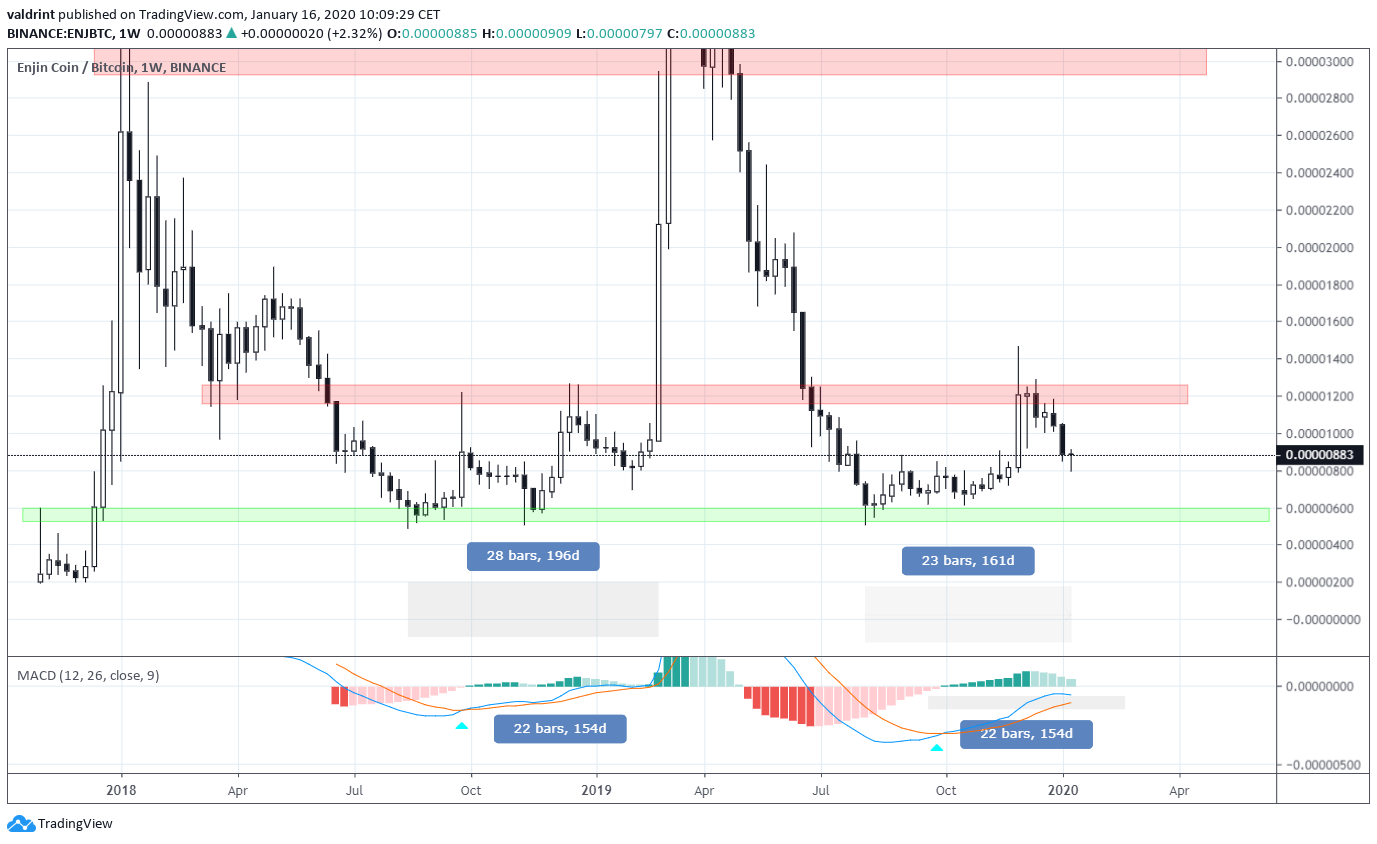
In the current movement, the price has reached the resistance area but failed to break out above it. If the move takes the same amount of time as in 2018, the price could break out as early as the end of February.
A similar target is given by the weekly MACD bullish cross. In 2018, the breakout transpired 154 days after the MACD bullish cross. If the same thing occurs this time around, the breakout could take place in early March. BeInCrypto reasoned that this breakout could take a while in a previous analysis.
Ascending Support
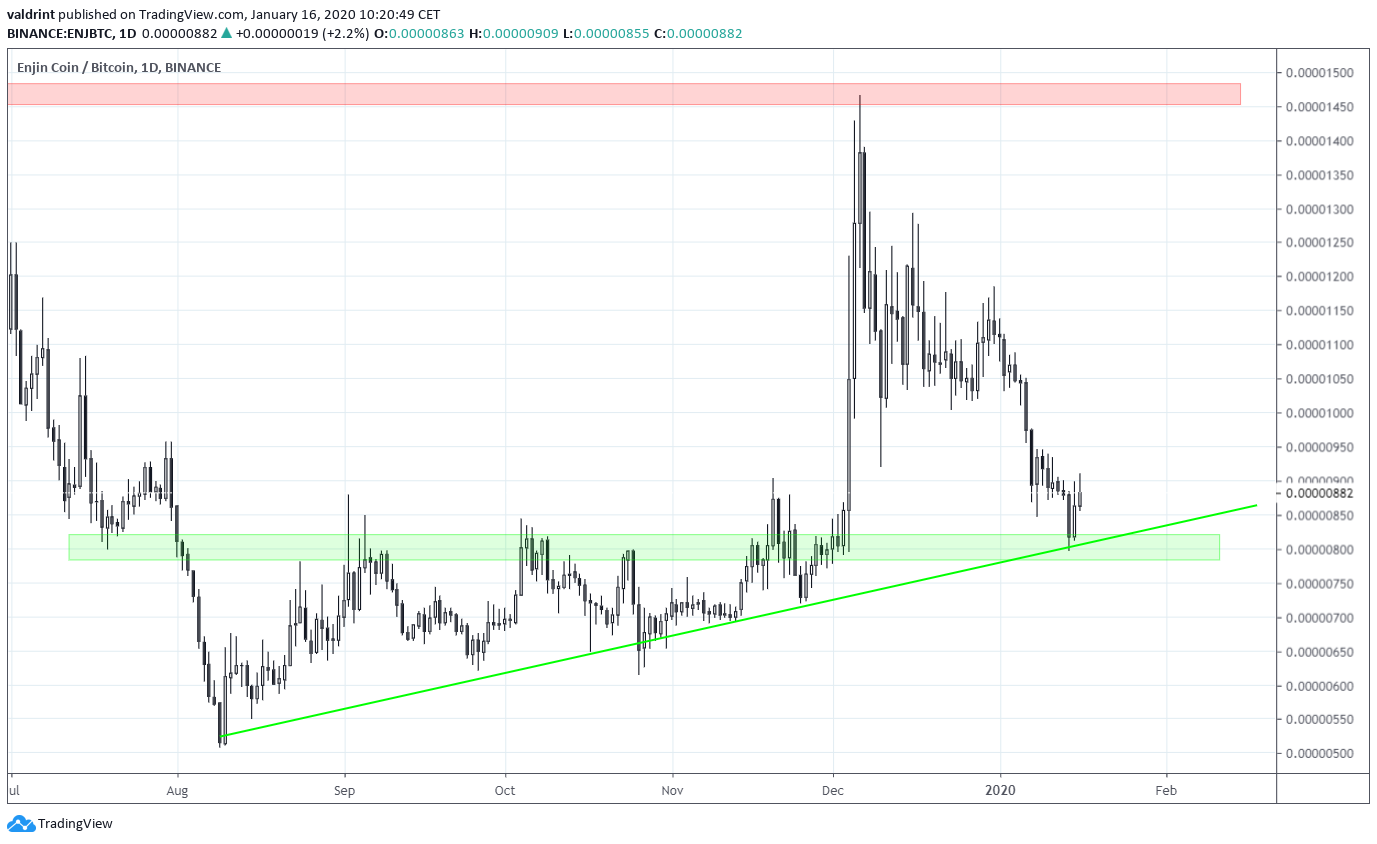
The daily chart shows that the ENJ price has been following an ascending support line since the first time it reached the aforementioned long-term support on Aug 9, 2019. At the time of writing, it was trading right on this support line.
In addition, the price has possibly validated the 800 satoshi area as support. This area acted as resistance throughout August-December. After the price broke out, it returned to retest the same area.
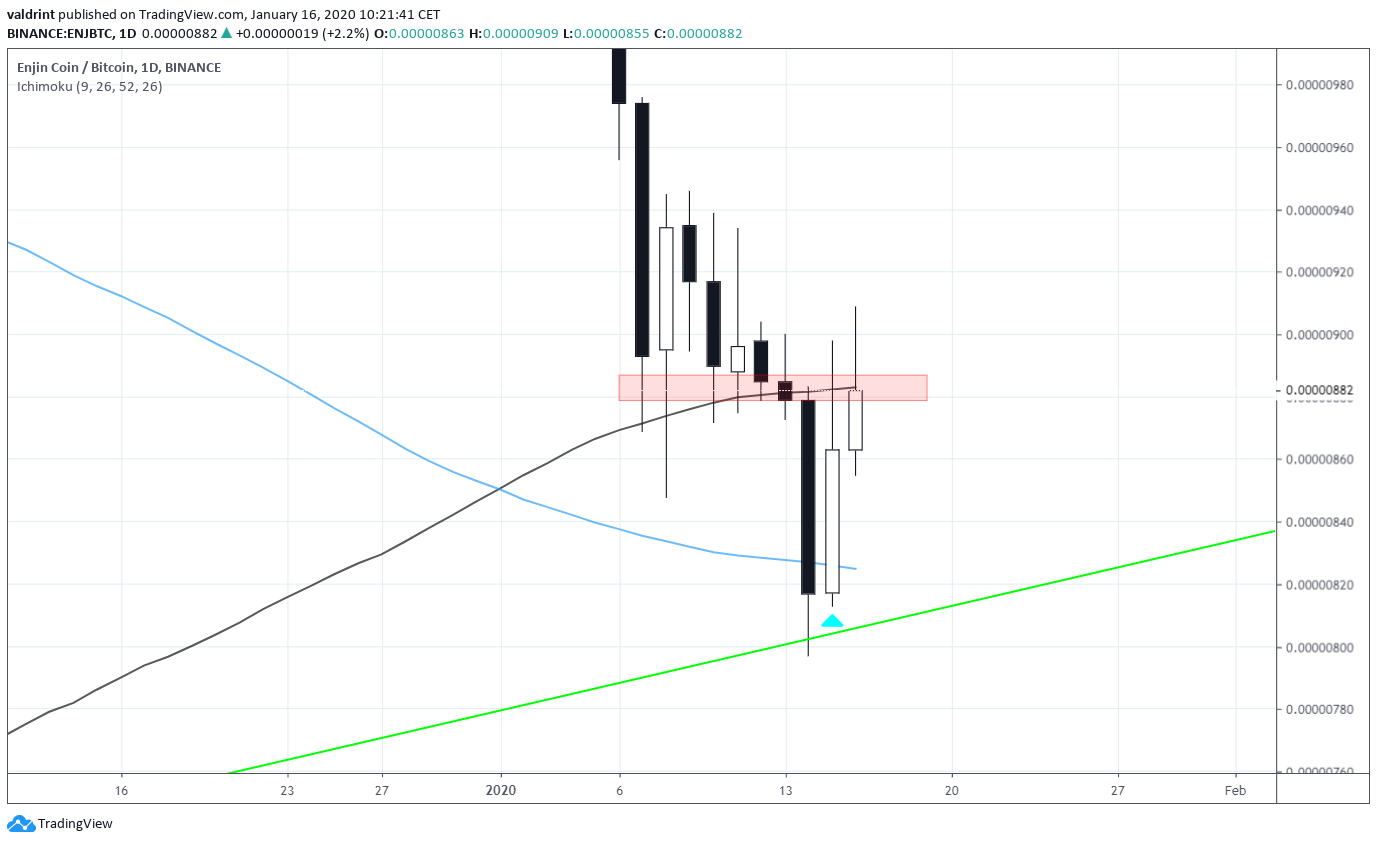
The price created a bearish engulfing candlestick on Jan 14, before attempting to reverse. A price close above 900 satoshis would confirm that the breakdown could not be sustained and the price is moving higher. In addition, this would cause the price to flip the 100-day MA and use it as support.
Trading Scenarios
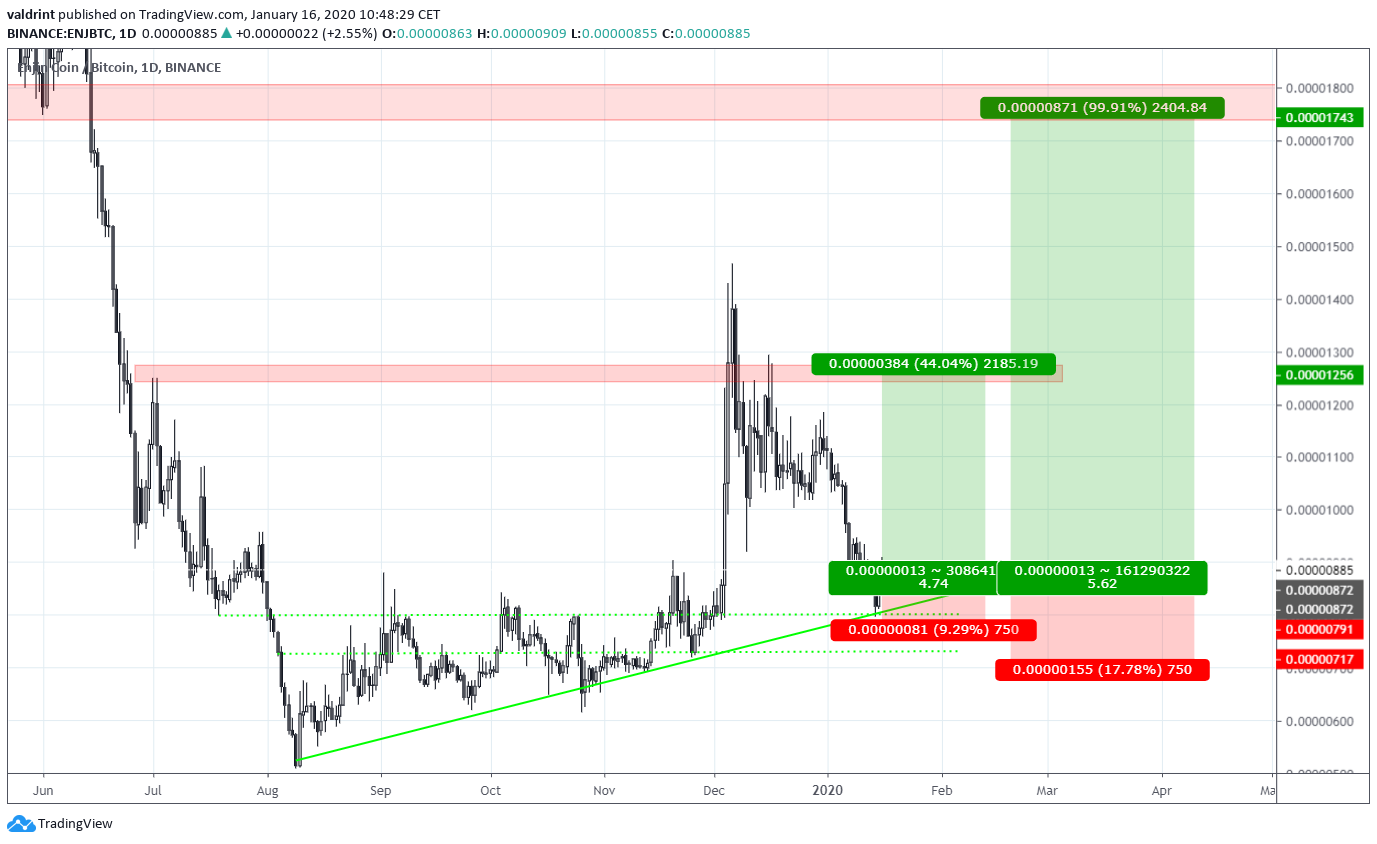
The current price movement offers the opportunity to initiate long trades with exceptional risk-to-reward ratios.
They are presented in the table below (all values in satoshis):
The first setup focuses on attempting to catch an upward move towards the range high, without anticipating a breakout. Therefore, this is a short/medium-term trade. The stop loss of 9% allows entering the trade with a relatively high percentage of the total portfolio since doing so with 5% would amount to a loss of only 0.5%. The setup would represent a risk-to-reward ratio of 4.75.
The second is more of a medium/long-term trade. While the entry price is the same, both the target and the stop losses are different. The stop-loss is placed well below the ascending support line and the middle of the previous support range at 719 satoshis. In addition, the target is the next support area at 1,749 satoshis. Therefore, a breakout would be required for the price to reach this target. The setup represents a risk-to-reward ratio of 5.6.
To conclude, the ENJ price is in the process of retesting a previous resistance area and validating it as support. A movement above the 100-day MA would indicate that the price should continue to move towards the range high. A breakout is expected sometime after February.


