


The Polkadot (DOT) price failed to break out from a key diagonal resistance line and fell below a crucial horizontal area afterward.
The long-term count suggests that the price has reached a long-term bottom and has begun a new bullish trend reversal. However, the price action does not confirm this possibility yet.
Polkadot Price Fails to Clear Resistance on Third Try
The technical analysis of the daily time frame indicates an undetermined outlook. The reasons behind this assessment are based on factors such as price action and indicator readings.
To begin with, the DOT price has lost the $5.20 horizontal level. The level has intermittently acted as both support and resistance since the beginning of March.
While it seemed that DOT regained it again at the beginning of July, the rejection from the descending resistance line on July 3 (red icon) caused a bearish trend reversal.
This was the third rejection from the same resistance line. The $5.20 area now acts as resistance again.
The wave count indicates a bullish scenario. By analyzing recurring long-term price patterns and investor psychology, Elliott Wave theory suggests that the DOT price has completed a corrective A-B-C structure marked (black).
This supports the notion that a bottom has been reached, aligning with the previously mentioned long-term double-bottom pattern.
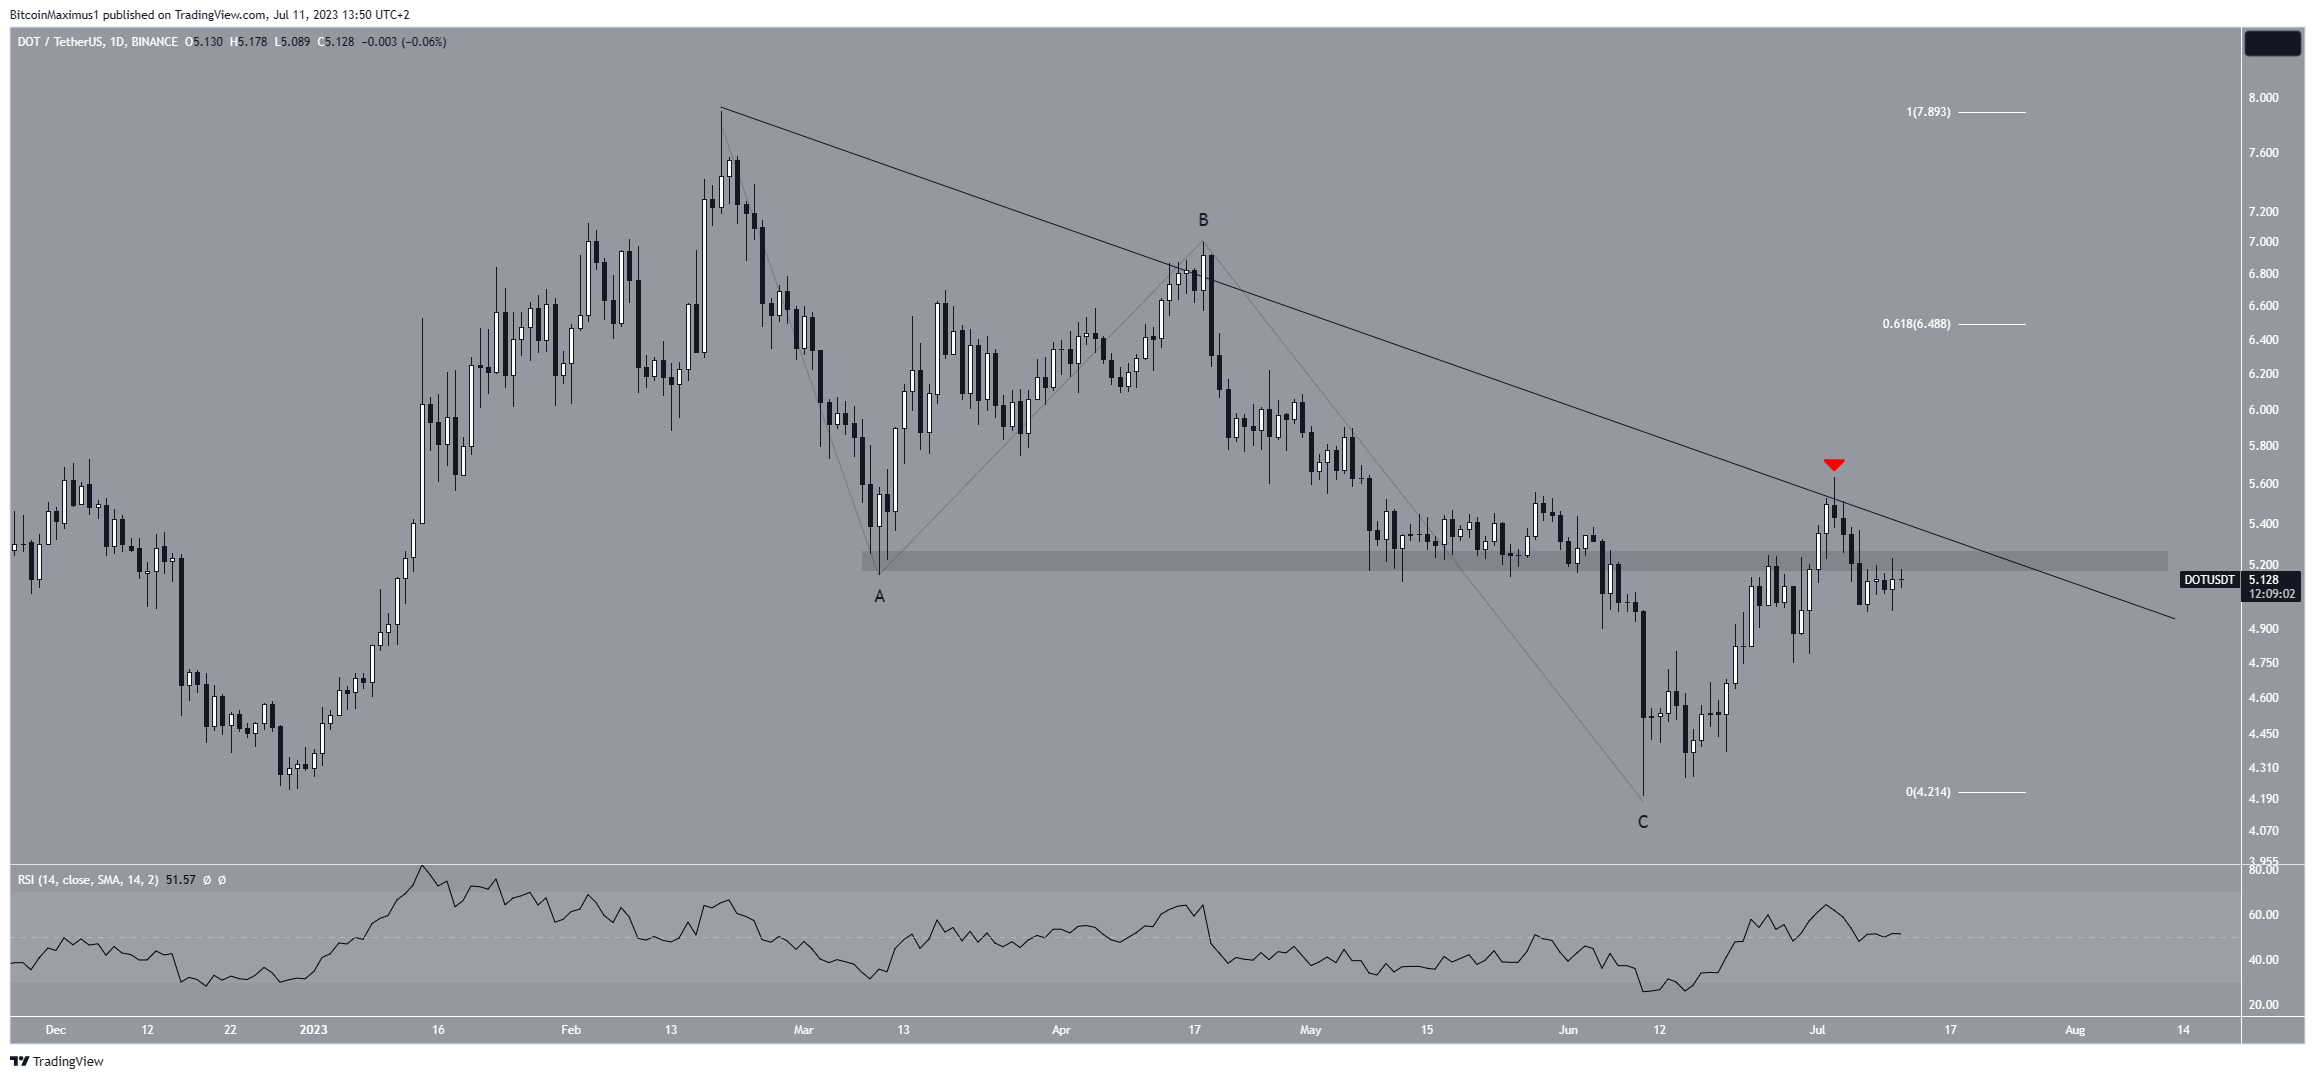
Next, the daily Relative Strength Index (RSI) gives an undetermined reading. With the RSI as a momentum indicator, traders can determine whether a market is overbought or oversold and decide whether to accumulate or sell an asset.
Bulls have an advantage if the RSI reading is above 50 and the trend is upward, but if the reading is below 50, the opposite is true. The daily RSI is at 50, a sign of a neutral trend.
Read More: Best Crypto Sign-Up Bonuses in 2023
DOT Price Prediction: Short-Term Drop Before Reversal
A closer look at the wave count for the short-term six-hour time frame suggests that the DOT price has begun a bullish trend reversal. However, an initial retracement will occur before the price resumes its increase.
Starting on June 10, the DOT price completed a five-wave increase, culminating with the $5.63 high on July 3. This aligns with the long-term count and suggests that the DOT price has begun a bullish trend reversal. However, if the count is correct, it also means that DOT is now in an A-B-C corrective structure.
Fibonacci retracement levels operate on the principle that after a significant price change in one direction, the price will retrace or revisit a previous price level.
Since DOT has completed a five-wave increase, it is likely for the price to retrace to the 0.5-0.618 Fib retracement support area at $4.75-$4.92 before resuming the long-term increase.
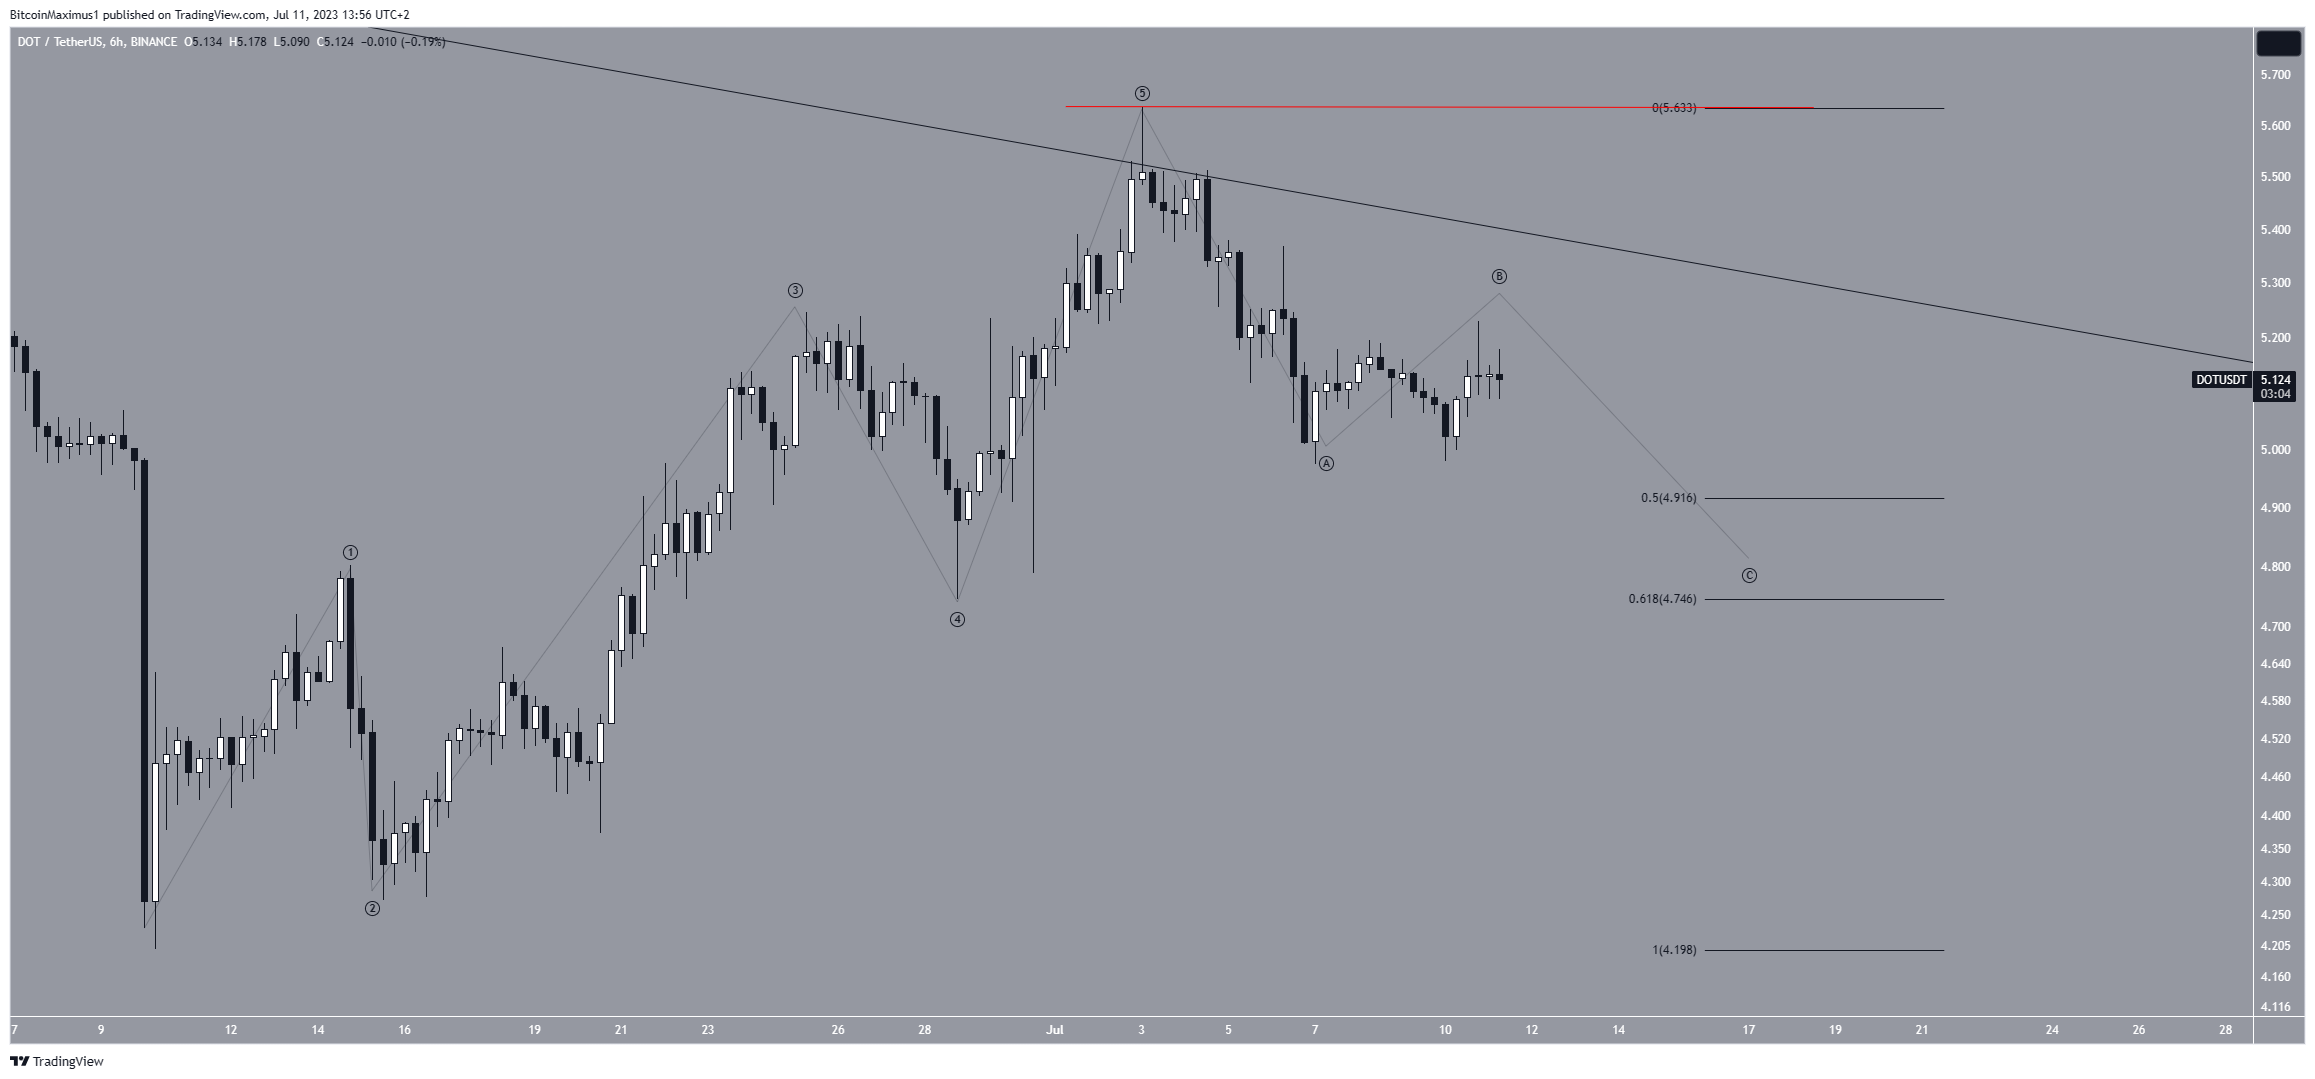
However, despite this bearish short-term DOT price prediction, an increase above the wave five high at $5.63 will mean the correction is over, and the trend is bullish. The DOT price can move to the next resistance at $6.50 in that case.
More From BeInCrypto: 9 Best AI Crypto Trading Bots to Maximize Your Profits
For BeInCrypto’s latest crypto market analysis, click here


