


The Dogecoin (DOGE) price is trading between critical horizontal resistance and support levels. Whether it breaks out or down will be crucial in the direction of the future trend.
Readings in both the weekly and daily time frame are inconclusive, failing to confirm which way the price will move next.
Dogecoin Price Consolidates Between Key Diagonal and Horizontal Levels
According to the technical analysis of the weekly time frame, it is observed that the price of DOGE has dropped below a descending resistance line after reaching its all-time high price of $0.739 in May 2021. This decline led to a low of $0.049 in June 2022.
Afterward, the DOGE price rebounded (green icon) and has been trading above the $0.060 horizontal support area. However, it has not yet managed to break out of the long-term descending resistance line, which has been in place for 798 days.
More recently, the DOGE price was rejected by the line last week (red icon). The price now trades very close to the convergence of the horizontal support area and the descending resistance line. So, a decisive movement is expected soon.
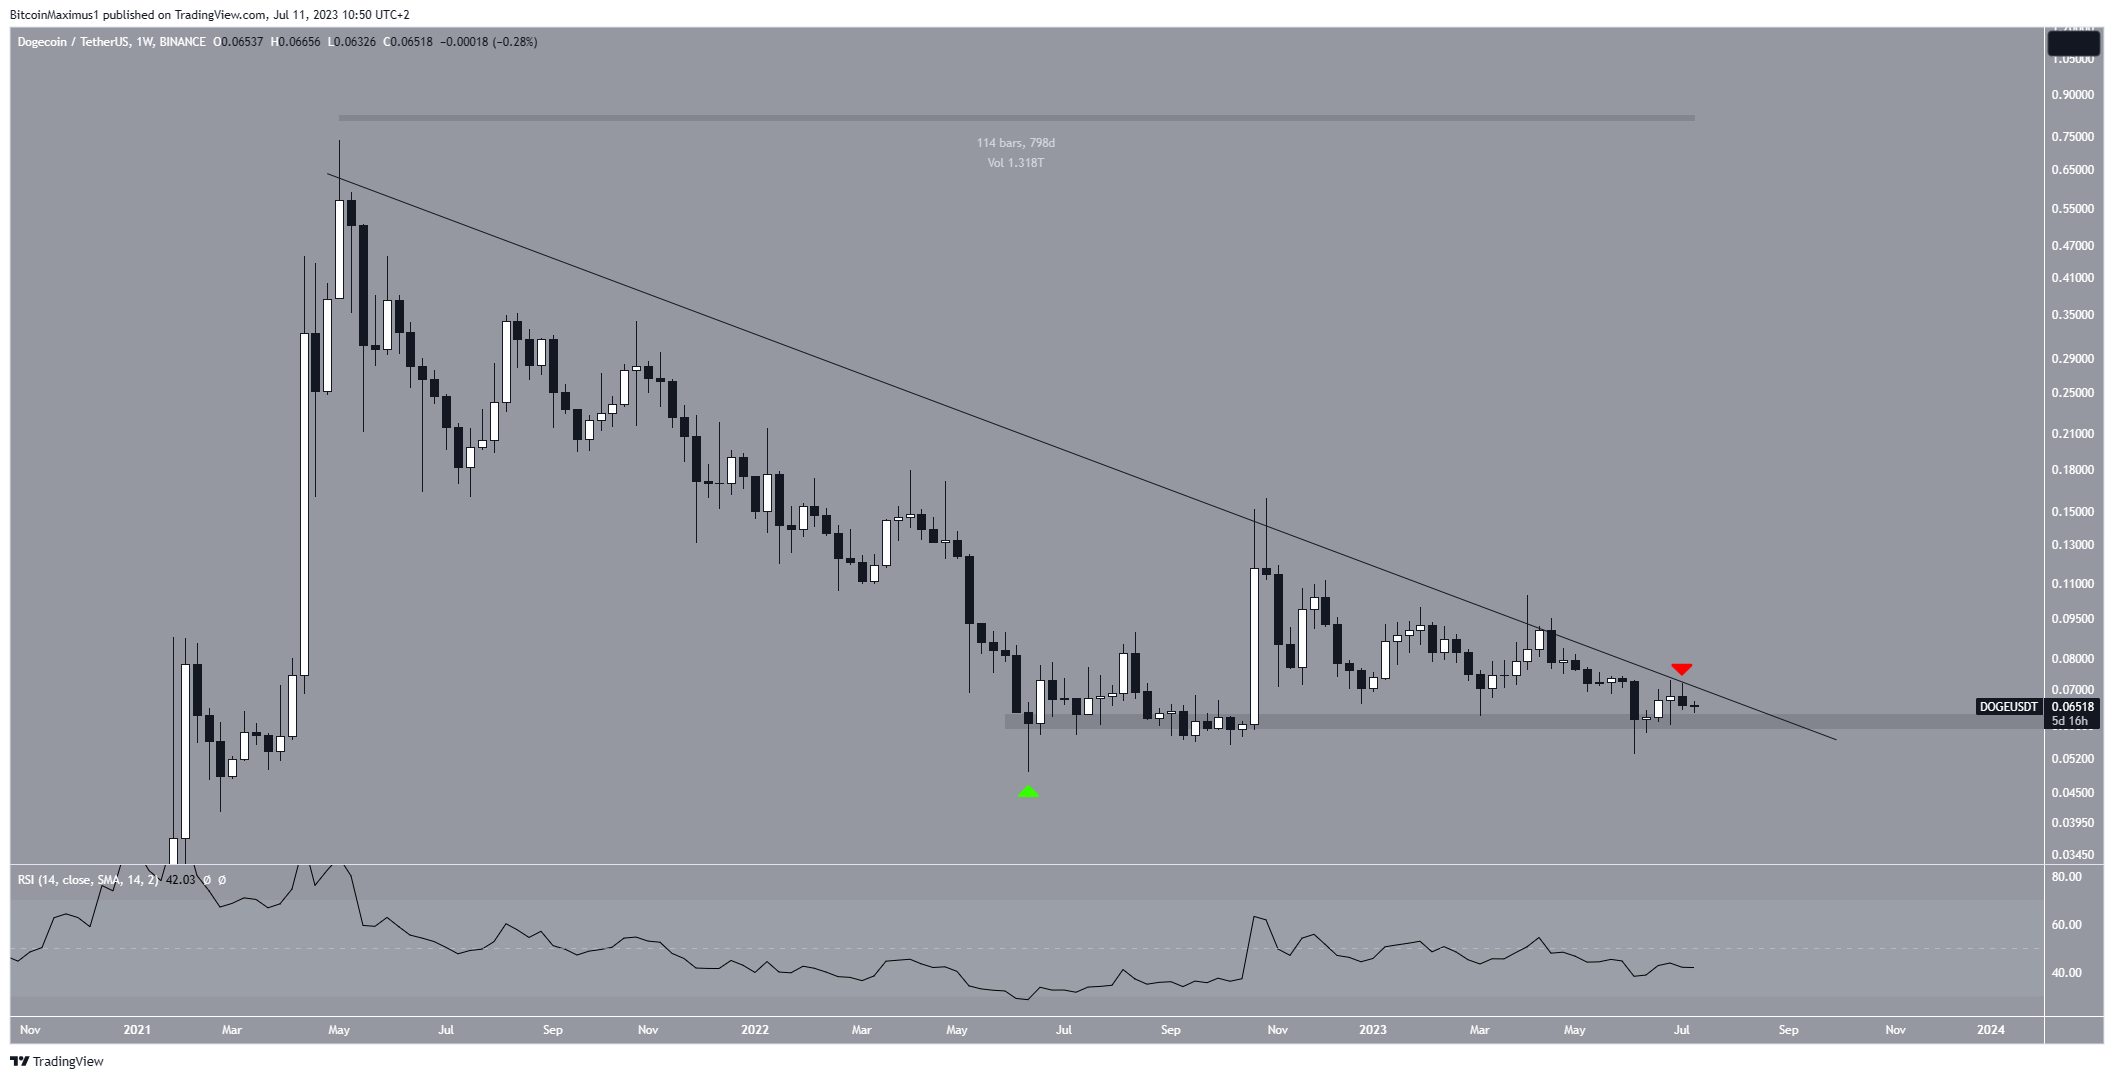
The weekly Relative Strength Index (RSI) reading is inconclusive. The RSI is a momentum indicator used by traders to assess whether a market is overbought or oversold, and to make decisions about buying or selling an asset.
Readings above 50, along with an upward trend, suggest that the bulls still hold an advantage. Conversely, readings below 50 indicate the opposite.
Currently, the RSI is increasing but remains below 50, indicating an uncertain trend. To confirm a bullish trend, we would need to see the RSI move above 50 and DOGE break out from the descending resistance line.
DOGE Price Fails to Sustain Breakout
While the weekly reading is unclear, the technical analysis of the Dogecoin price on the daily time frame suggests a positive outlook. This is primarily due to a deviation below the $0.065 horizontal level (green) and subsequent recovery. Such deviations often lead to significant price increases as they indicate that buyers have taken control after an unsuccessful attempt by sellers to cause a breakdown.
Furthermore, the DOGE price broke out from a descending resistance line that lasted for 79 days. This further supports the possibility of a bullish reversal. Currently, DOGE is trading slightly above the $0.065 support area, after it was rejected by the 0.382 Fibonacci retracement resistance level at $0.073 (red icon).
Fibonacci retracement levels operate on the principle that after a significant price change in one direction, the price tends to retrace or revisit a previous level before continuing in its original direction. Therefore, a move above the 0.382 Fib level would strongly suggest a bullish trend.
If the meme coin successfully breaks out, the next resistance level will be at $0.086, represented by the 0.618 Fibonacci retracement resistance level.
The daily Relative Strength Index (RSI) supports the breakout and ongoing upward movement. The indicator has broken out from a descending resistance line (shown as a green line). But, it has fallen slightly below 50, casting some doubt on the validity of the breakout.
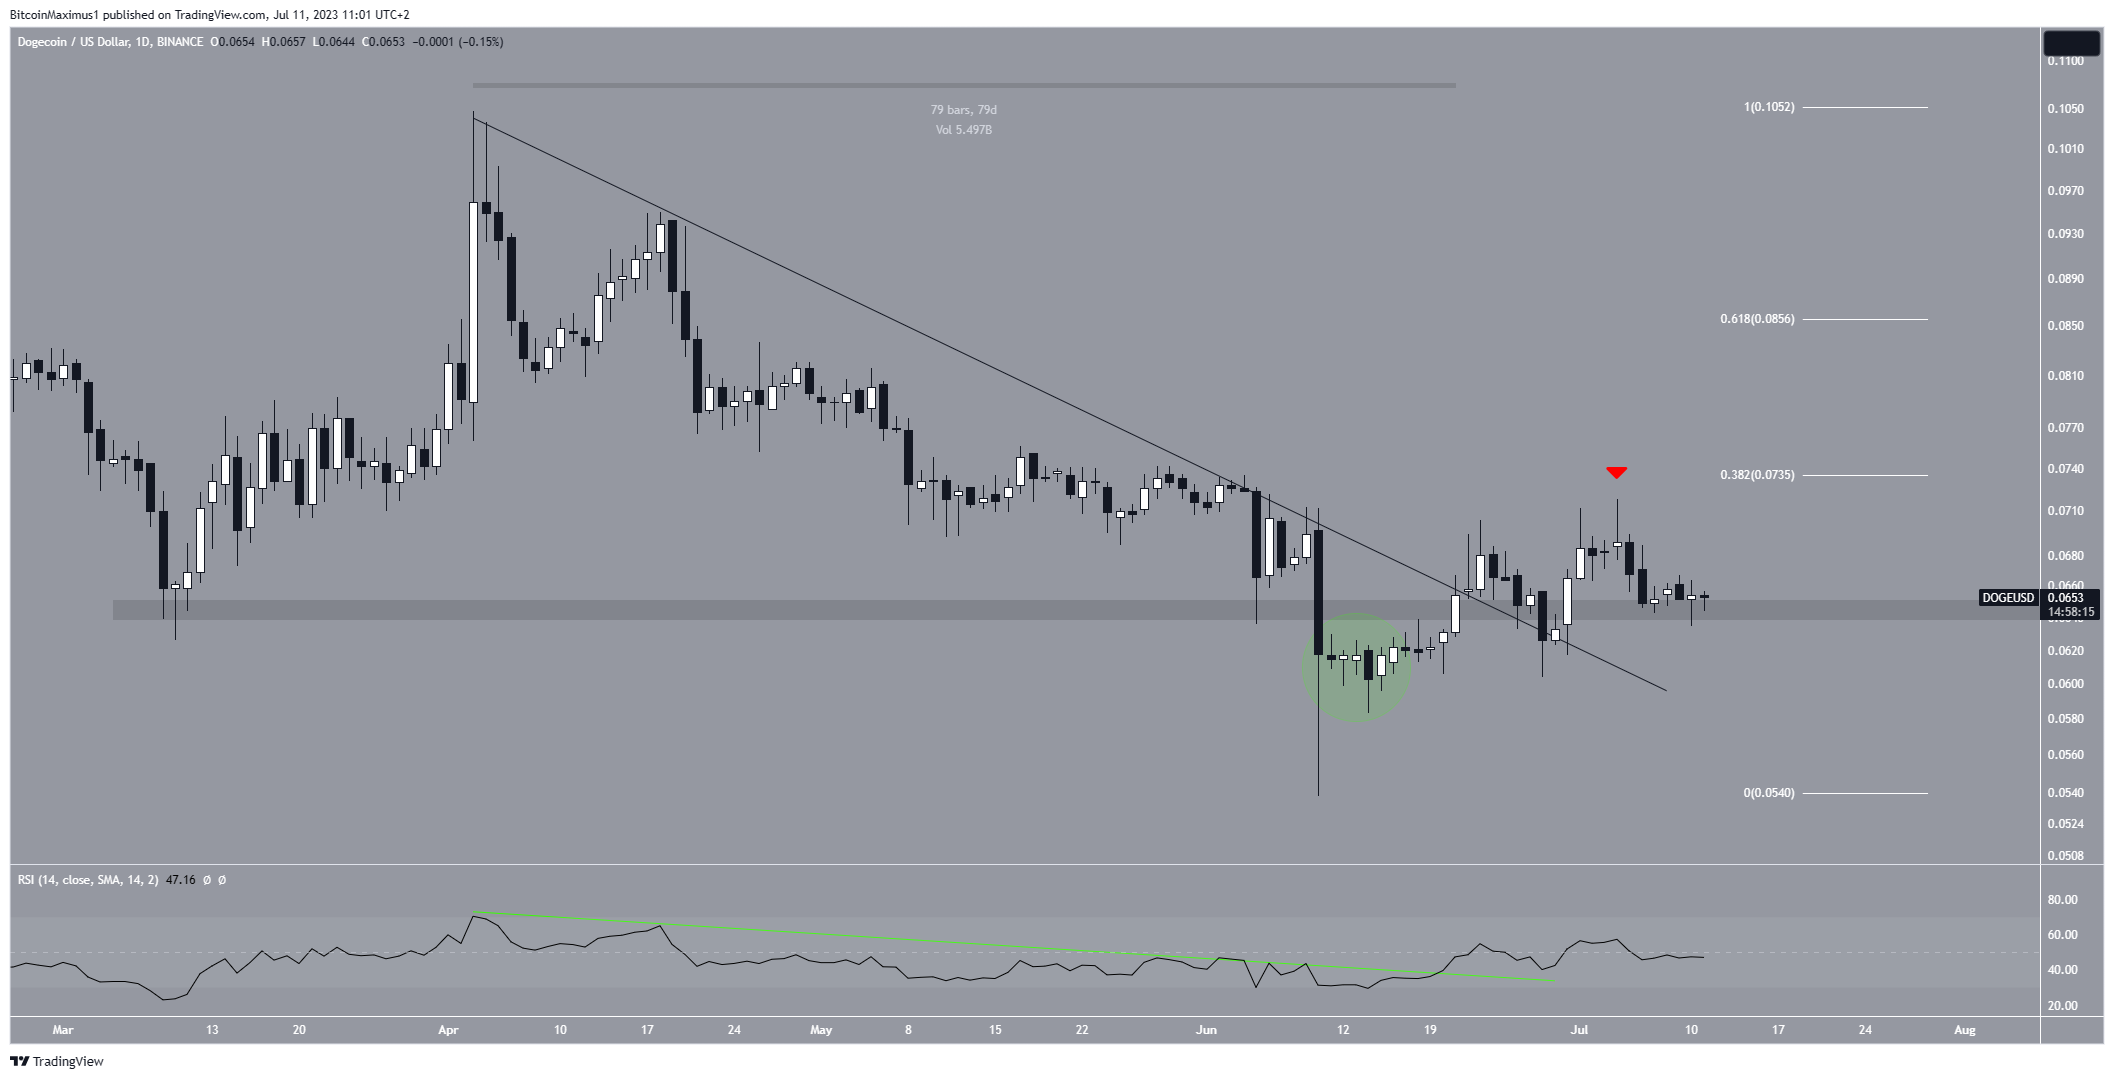
It is important to note that if the DOGE price fails to break out above the $0.073 region, there could be another test of the $0.065 horizontal support level and potentially the long-term $0.060 support level. Nevertheless, as long as the DOGE price remains above the latter, the long-term trend remains bullish.
For BeInCrypto’s latest crypto market analysis, click here.


