


The Dogecoin (DOGE) price is consolidating above an important support area and shows short-term bullish signs.
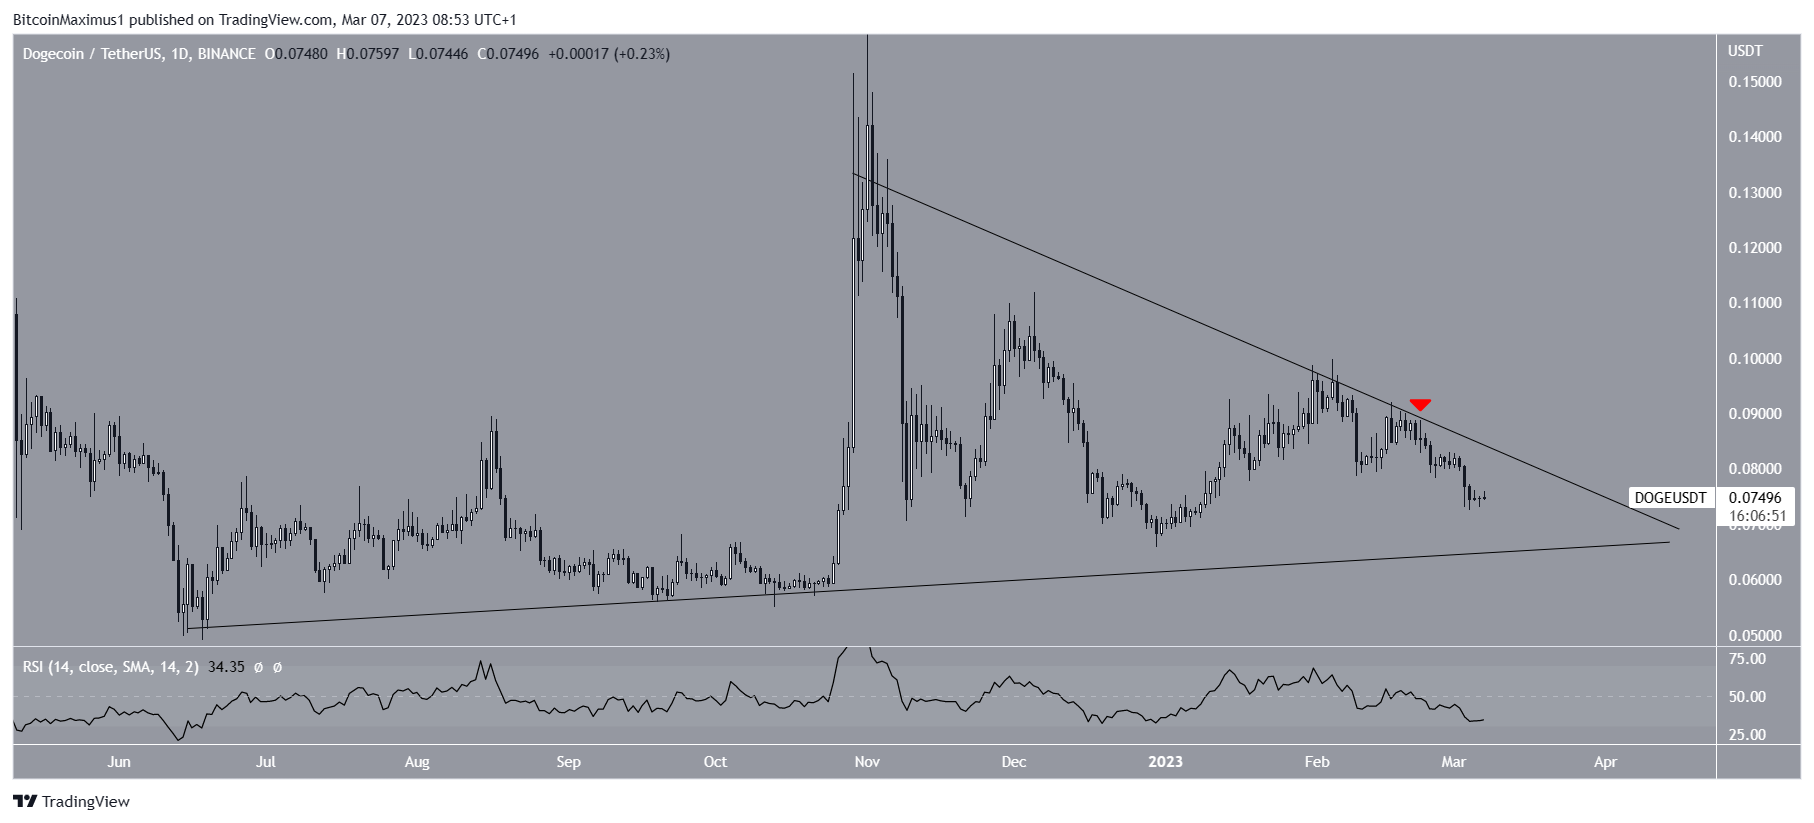
The Dogecoin (DOGE) price has decreased inside a symmetrical triangle since June 2022. The triangle caused numerous rejections in February, more recently on Feb. 22 (red icon). The rejection began the current downward movement.
The daily RSI is below 50 and decreasing, signifying a bearish trend. Therefore, a fall to the triangle’s support line is expected. The support line is currently at $0.067.
However, since the triangle is considered a neutral pattern, both a breakout and breakdown from the triangle still remain possible.
It is worth noting that the Dogecoin community has not reported any news relating to the meme coin, nor has Elon Musk tweeted anything that could cause the price of the token to move.
Has Dogecoin (DOGE) Completed Correction?
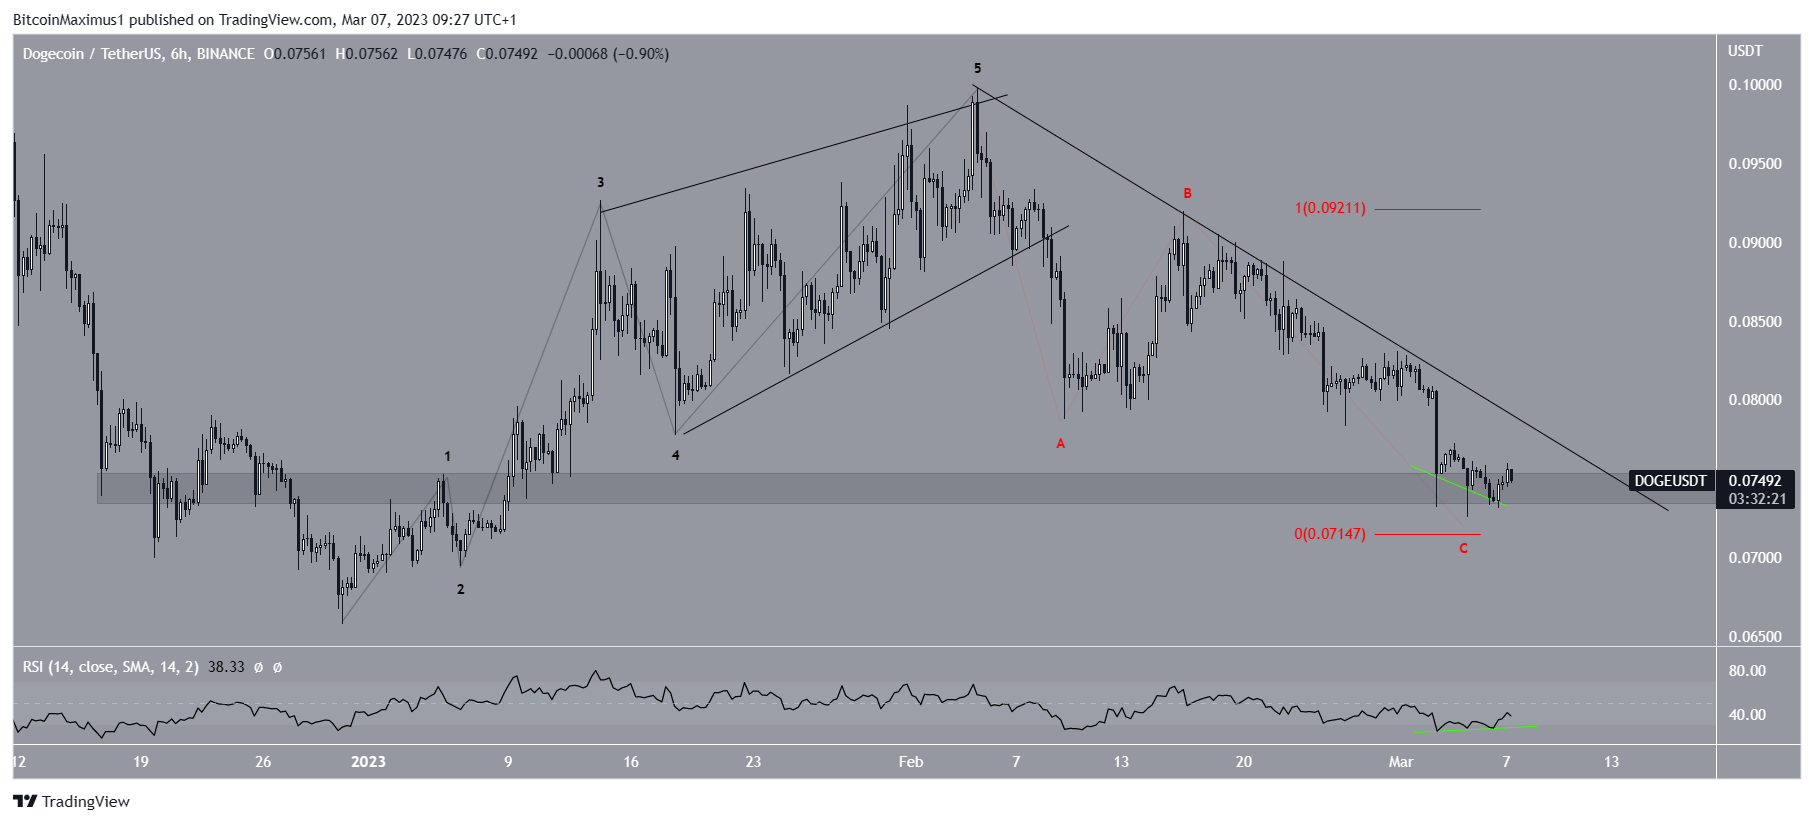
The technical analysis from the short-term six-hour chart provides an interesting outlook. The Dogecoin price has seemingly completed a five-wave upward movement (black), which was followed by an A-B-C corrective structure (red).
The current low of $0.072 is very close to giving waves A:C a 1:1 ratio, which is the most common in such corrections. Moreover, it is made inside the $0.074 horizontal support area. Therefore, it is a very suitable level for a low. Finally, the six-hour RSI has generated bullish divergence (green line), supporting the possibility of a bounce. This could occur in the next 24 hours.
If that occurs, the DOGE price can increase to the descending resistance line in place since January. Whether it breaks out or not can determine the future trend. A breakout could lead to an upward movement toward $0.092, while a rejection could lead to another test of the $0.074 support area.
If the DOGE price breaks down below $0.074, it could fall to $0.065.
To conclude, the most likely DOGE price forecast is a bounce toward the current descending resistance line. A close below $0.074 would invalidate this bullish hypothesis and could cause a fall to $0.065.
For BeInCrypto’s latest crypto market analysis, click here.


