


The Dogecoin (DOGE) price has increased significantly over the past five days. However, it has not confirmed its bullish reversal yet.
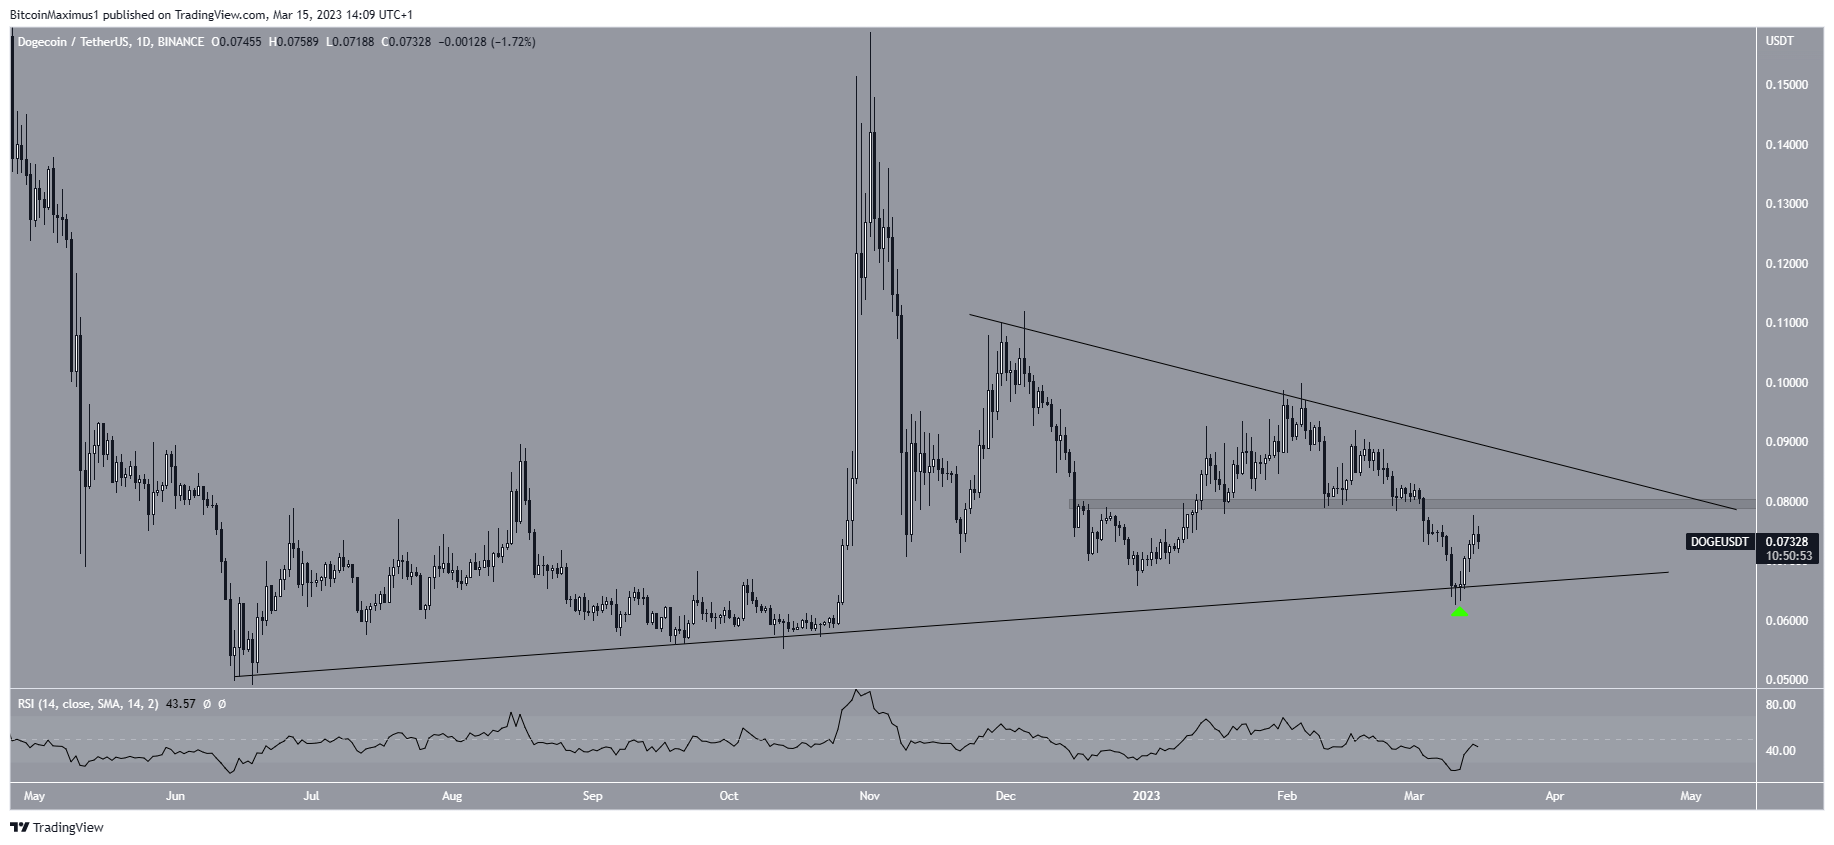
The DOGE price has followed a long-term ascending support line since June 2022. When combined with the resistance line that began in December of the same year, this creates a symmetrical triangle, which is considered a neutral pattern.
On March 10, the price bounced at the support line (green icon), after briefly falling to a new yearly low. Similar to other cryptocurrencies, Dogecoin has increased since, creating several successive bullish candlesticks.
However, the daily RSI is still below 50. Moreover, the price today failed to reach the $0.079 resistance area. As a result, the trend cannot be considered bullish yet.
Dogecoin (DOGE) Price Struggles to Confirm Trend
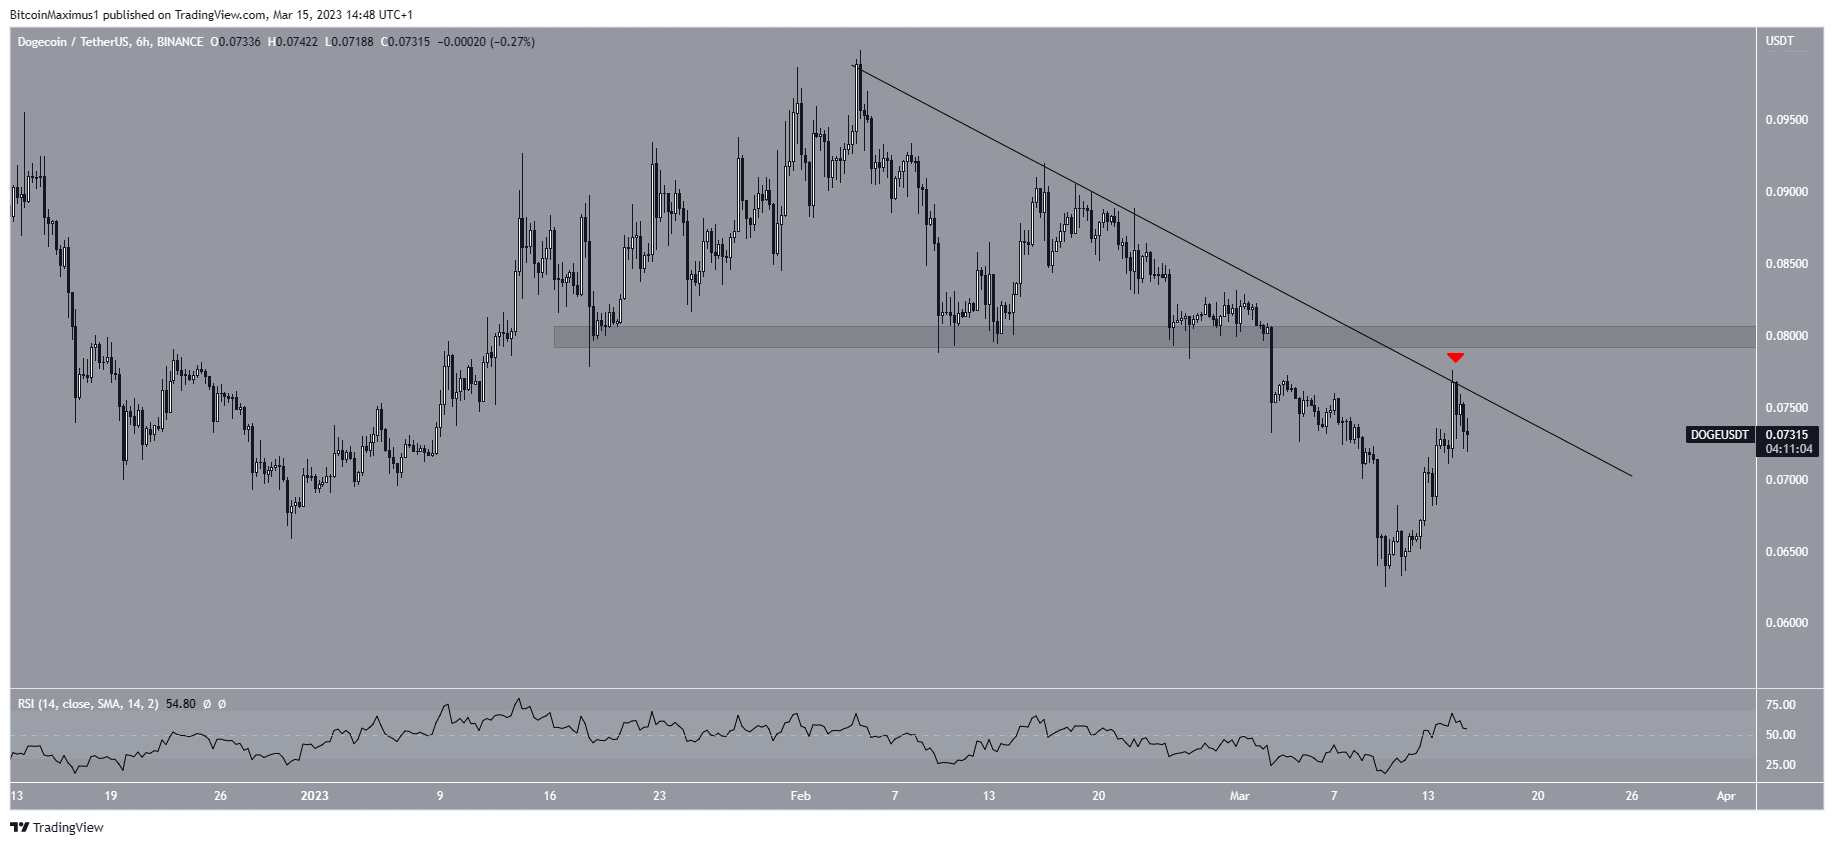
The technical analysis from the six-hour chart shows that the DOGE price has fallen under a descending resistance line since the beginning of February. More recently, the line caused a rejection on March 13 (red icon), ending the reversal that began after the new yearly low.
The six-hour chart reiterates the importance of the $0.079 resistance area. However, it does not help determine whether the digital currency will reach it and potentially break out. While the RSI is above 50, it has not generated any bullish divergence yet. Therefore, both a breakout and rejection remain possible.
So, the Dogecoin price trend is still undetermined. The short-term trend can be considered bearish until the price moves above $0.079. However, the direction of the long-term trend will be determined by whether the price breaks out or down from its symmetrical triangle. A breakout could lead to highs near $0.110, while a breakdown could lead to a fall to $0.050.
For BeInCrypto’s latest crypto market analysis, click here.


