


The Dogecoin (DOGE) price has decreased since its 2023 high of $0.107 on December 11.
DOGE is approaching the end of a short-term pattern. Will the price break down from it, or can it begin a reversal?
Dogecoin Consolidates Inside Channel
The technical analysis of the daily time frame shows that DOGE has traded inside an ascending parallel channel since June 2023. The upward movement culminated with a 2023 high of $0.107 in December.
The Dogecoin price has decreased since. While initially it bounced at the channel’s resistance trend line, it fell inside it in January 2024, validating it as resistance twice (red icons). DOGE now trades close to the channel’s midline.
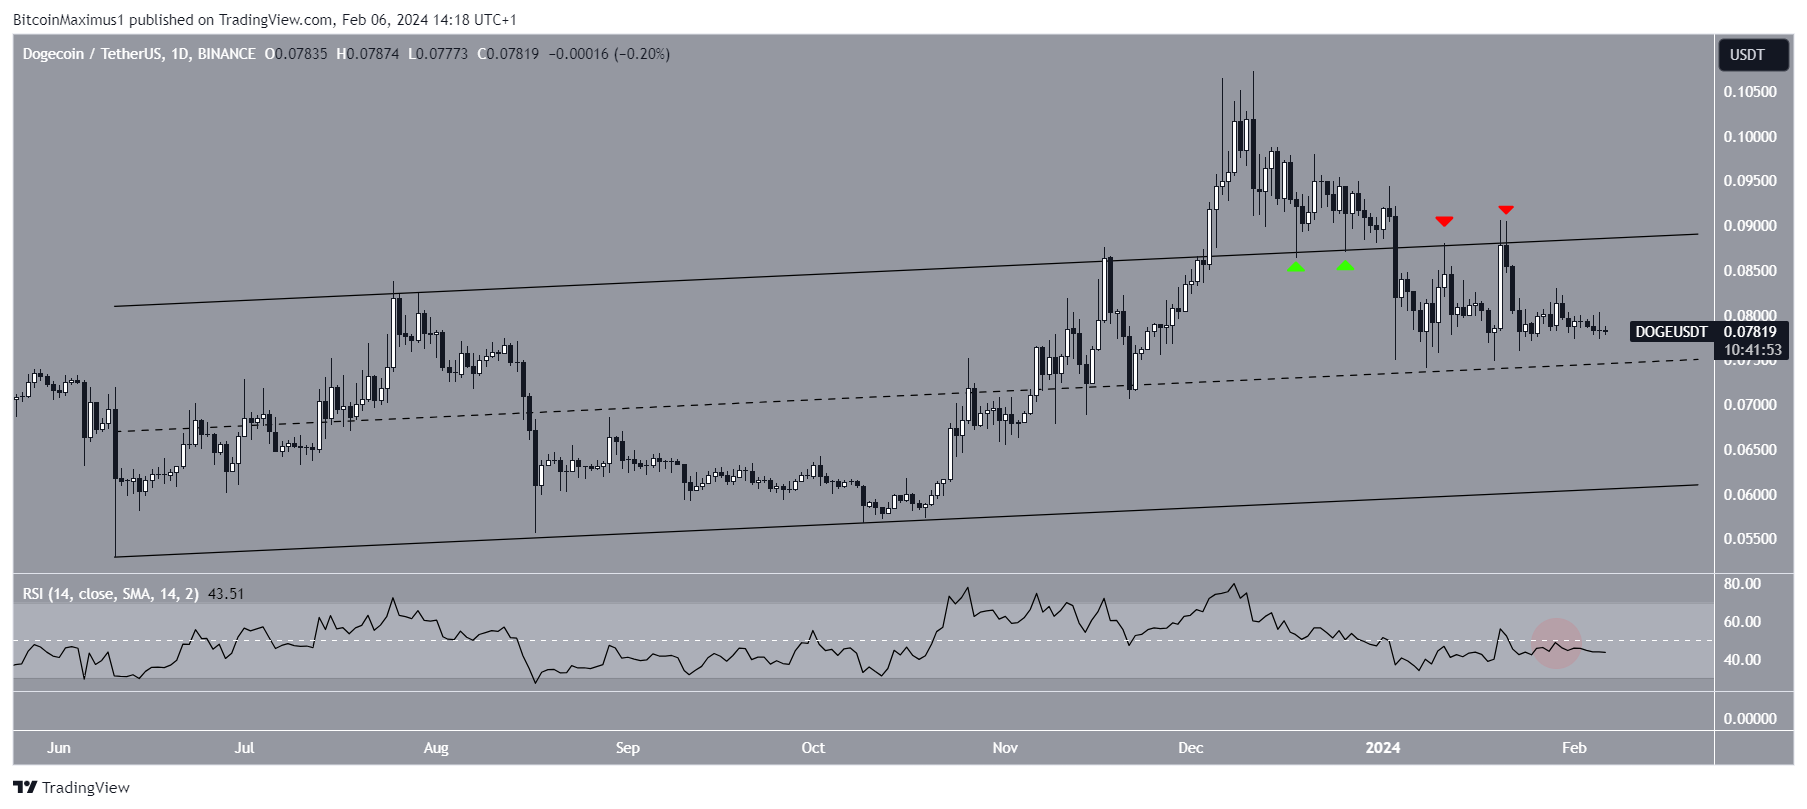
The daily Relative Strength Index (RSI) gives a mixed reading. Traders utilize the RSI as a momentum indicator to assess whether a market is overbought or oversold and whether to accumulate or sell an asset.
If the RSI reading is above 50 and the trend is upward, bulls still have an advantage, but if the reading is below 50, the opposite is true. While the indicator increases, it trades below 50 (red circle), indicating a mixed trend.
Read More: Dogecoin vs. Bitcoin: An Ultimate Comparison
DOGE Price Prediction: Will Breakdown Occur?
The technical analysis of the six-hour time frame gives a bearish outlook because of the Dogecoin price action. The movement since December 2023 resembles a descending triangle, considered a bearish pattern.
It is worth mentioning that despite the decline, there has been a significant expansion in Dogecoin wallets. More specifically, Dogecoin has seen 413,800 new wallets enter the network in the last two weeks.
Read More: How to Buy Dogecoin (DOGE) Anonymously
DOGE is approaching the end of the pattern, so a decisive movement is expected to occur soon.
The six-hour RSI does not confirm the trend’s direction since the indicator is exactly at 50. If the DOGE price breaks down from the triangle, it can fall 27% to the closest support area at $0.058.
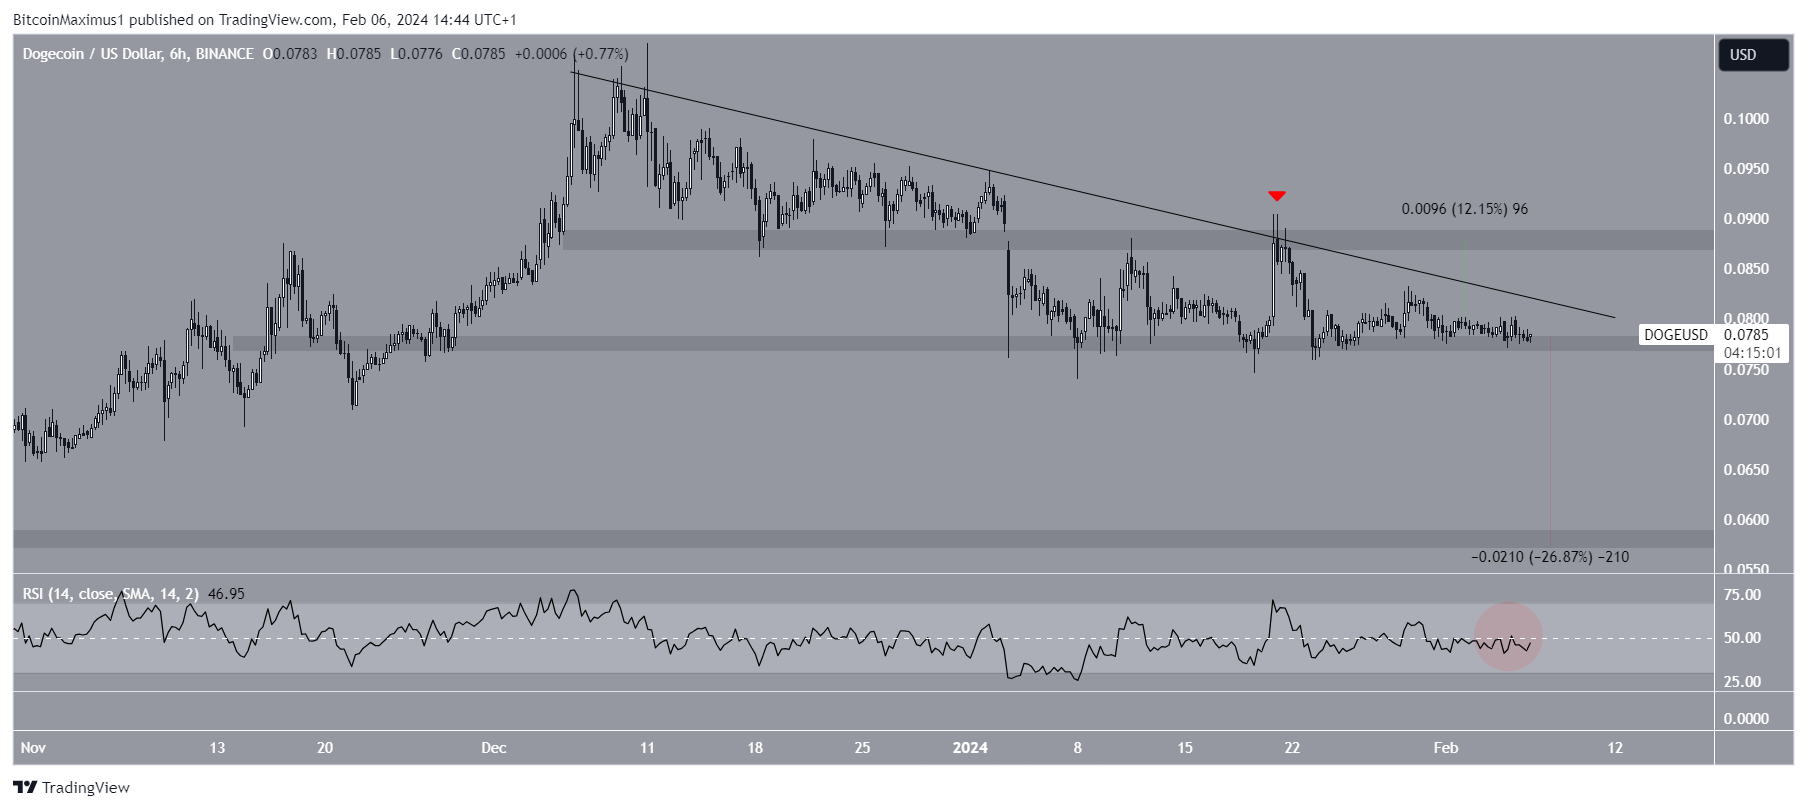
Despite the bearish Dogecoin price prediction, a breakout from the resistance trend line can initiate a 12% upward movement to the next closest resistance at $0.088.
For BeInCrypto‘s latest crypto market analysis, click here


