


The Dogecoin (DOGE) price bounced this week, validating a descending resistance trend line from which it previously broke out.
Despite the bounce, DOGE still trades inside the confines of another long-term corrective pattern, but it attempts to break out.
Dogecoin Retests Resistance After Breakout
The weekly time frame technical analysis shows that the DOGE price has increased swiftly since October 2023. The price broke out from a descending resistance trend line in November. At the time, the trend line has been in place for 400 days.
After breaking out, DOGE reached a new yearly high of $0.107 in December. However, it has fallen since, creating four successive bearish weekly candlesticks.
The decrease temporarily ended with this week’s Dogecoin price bounce, validating a horizontal resistance area and the descending trend line.
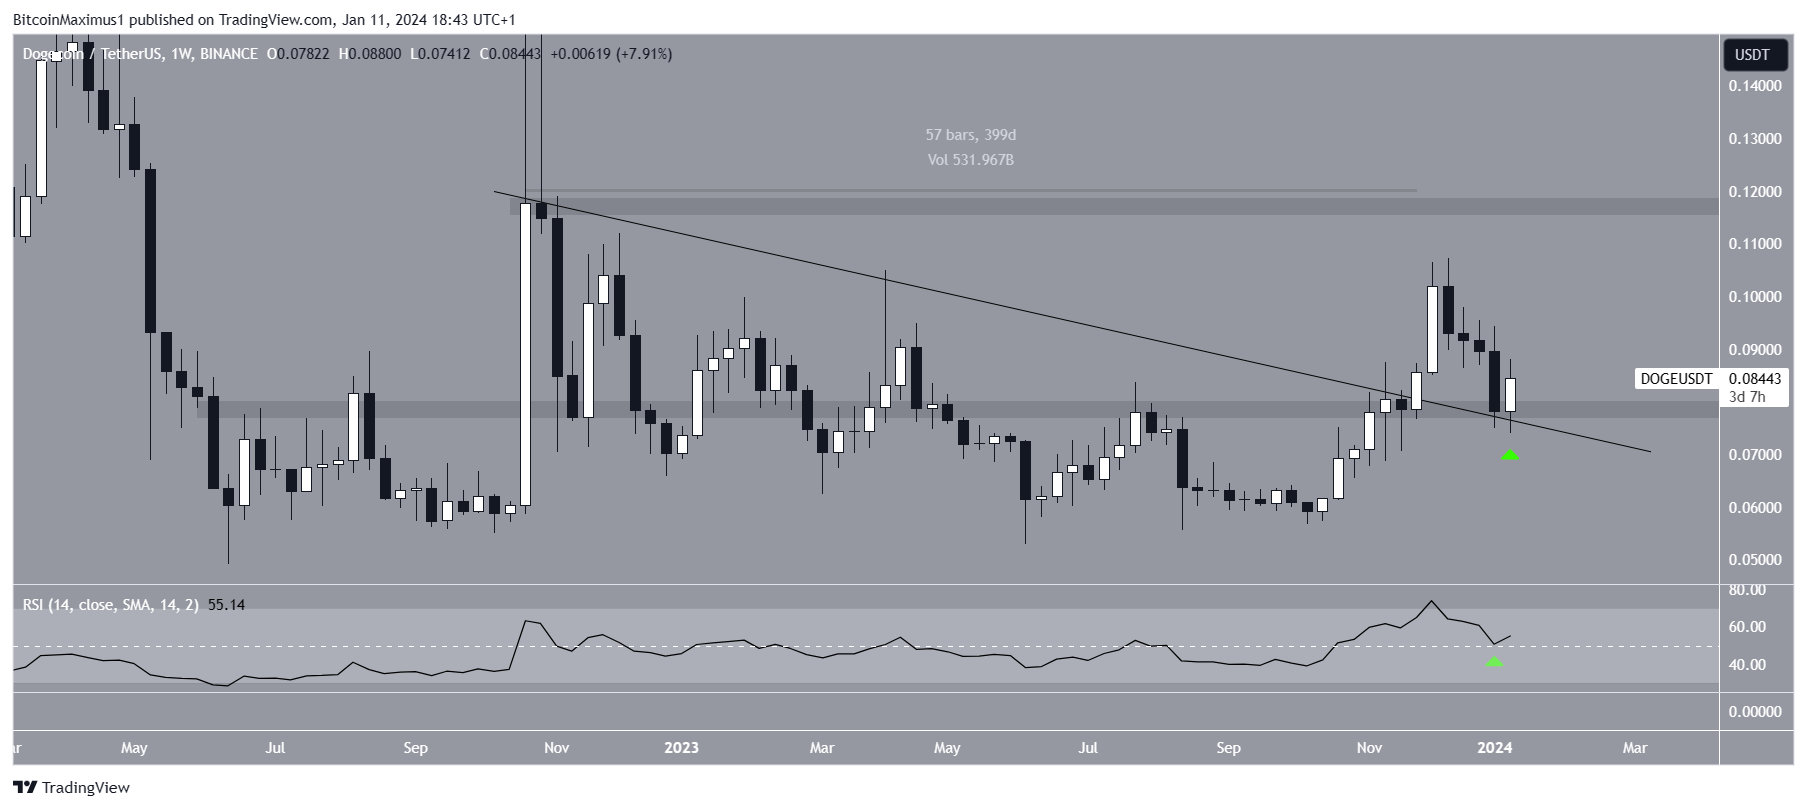
The weekly Relative Strength Index (RSI) supports the bounce.
The RSI is a momentum indicator traders use to evaluate whether a market is overbought or oversold and whether to accumulate or sell an asset.
Readings above 50 and an upward trend suggest that bulls still have an advantage, while readings below 50 indicate the opposite. The indicator bounced at 50 while the price bounced, legitimizing the movement.
Read More: How to Buy Dogecoin (DOGE)
DOGE Price Prediction: Will Price Begin a Bullish Trend Reversal?
Unlike the weekly time frame, the daily chart does not determine the trend’s direction is and is leaning bearish.
The price action shows that DOGE failed to gain support (green icons) above its resistance trend line after breaking out from an ascending parallel channel.
Currently, the DOGE price trades just below the channel’s resistance trend line (red icon).
Read More: Dogecoin – Should You Buy into the Hype?
Intriguingly, the RSI also attempts to move above the 50-trend line, providing resistance. So, a DOGE price breakout will likely cause an RSI breakout above 50.
Therefore, whether the price breaks out from the channel or gets rejected will determine the future DOGE trend direction.
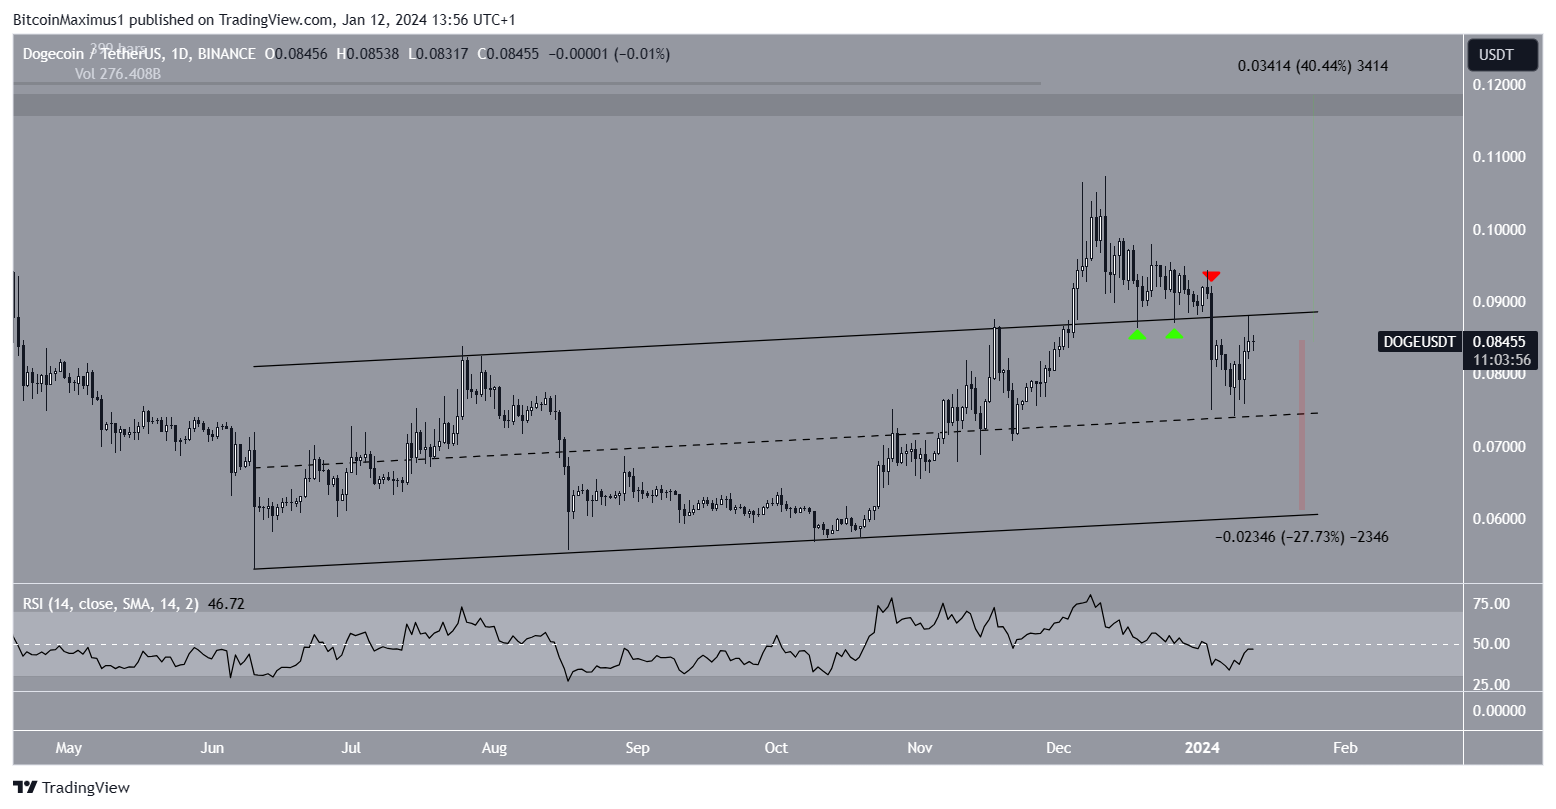
A breakout from the channel can trigger a 40% increase to the next resistance at $0.115. On the other hand, a rejection from the resistance trend line can cause a 28% drop to the support trend line at $0.062.
For BeInCrypto’s latest crypto market analysis, click here.



