


On Oct 20, the Bitcoin (BTC) price moved above the $12,050 resistance area, regaining all of the losses stemming from the early September fall.
Despite this move, it’s not yet clear whether this is a new upward move or an upwards correction.
Bullish Bitcoin Wave Count
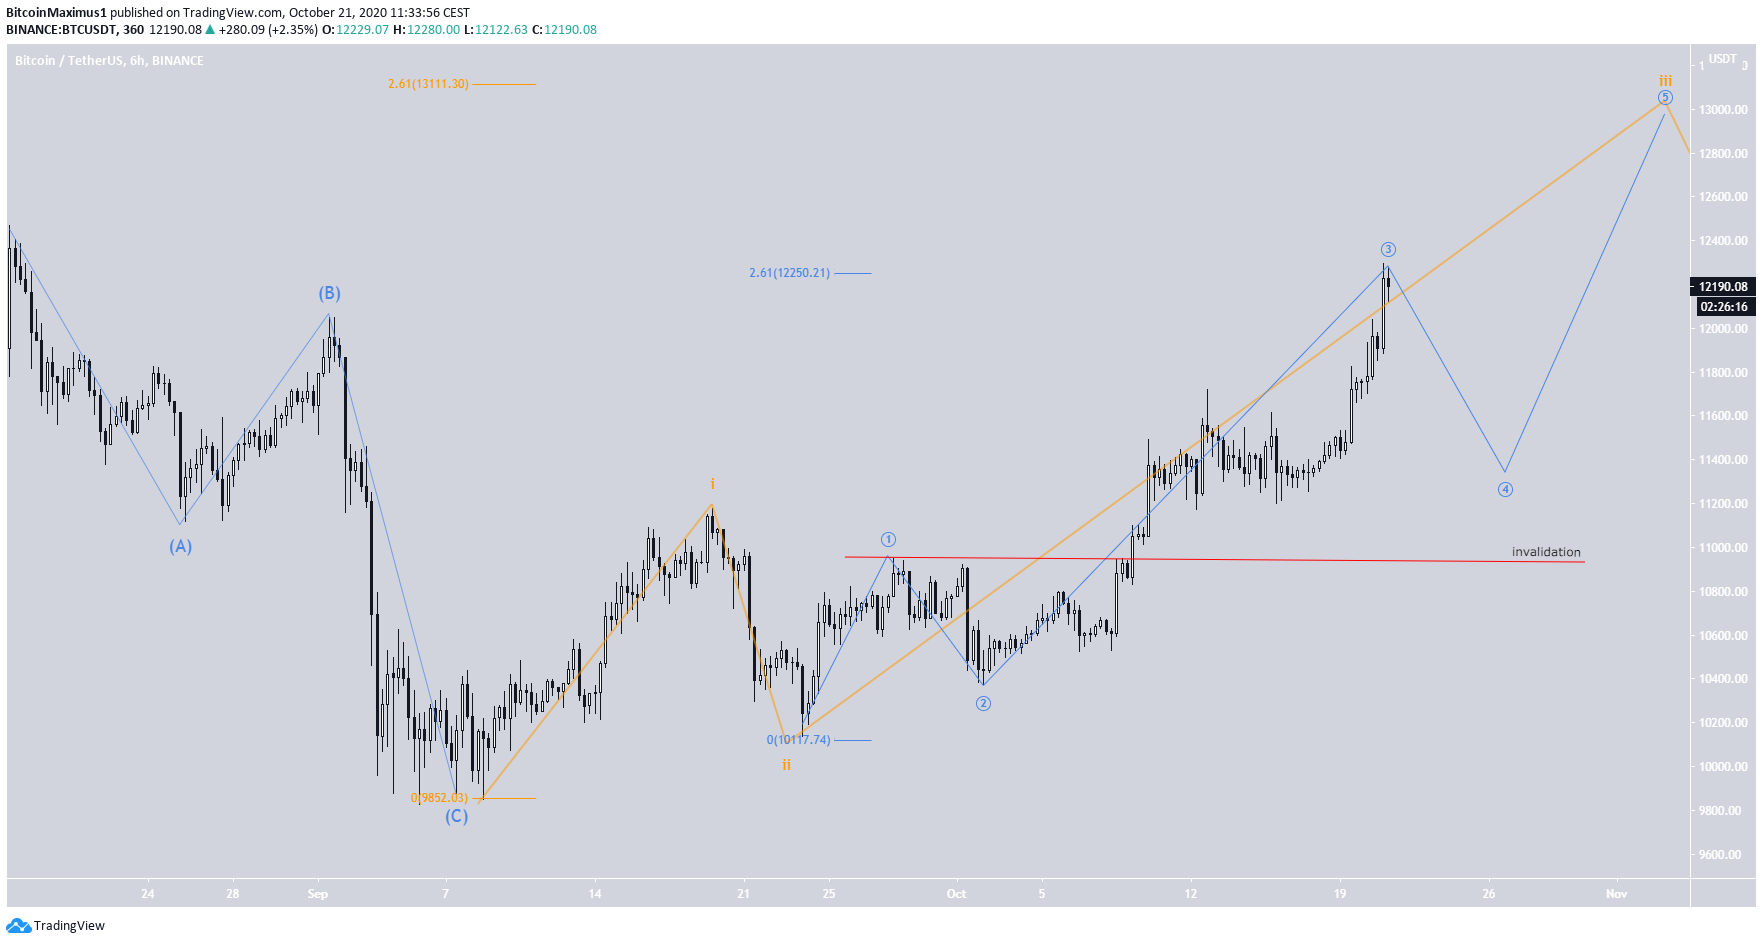
BTC’s bullish count suggests that the price has begun a bullish impulse (shown in orange below), currently trading in wave 3. The impulse is expected to be a part of a longer-term wave 5, which could take the price all the way to $14,000.
If the count is correct, the BTC price has just completed sub-wave 3 (blue) and will soon begin to correct. A decline below the sub-wave 1 high at $10,950 would invalidate this particular wave count.
Alternation
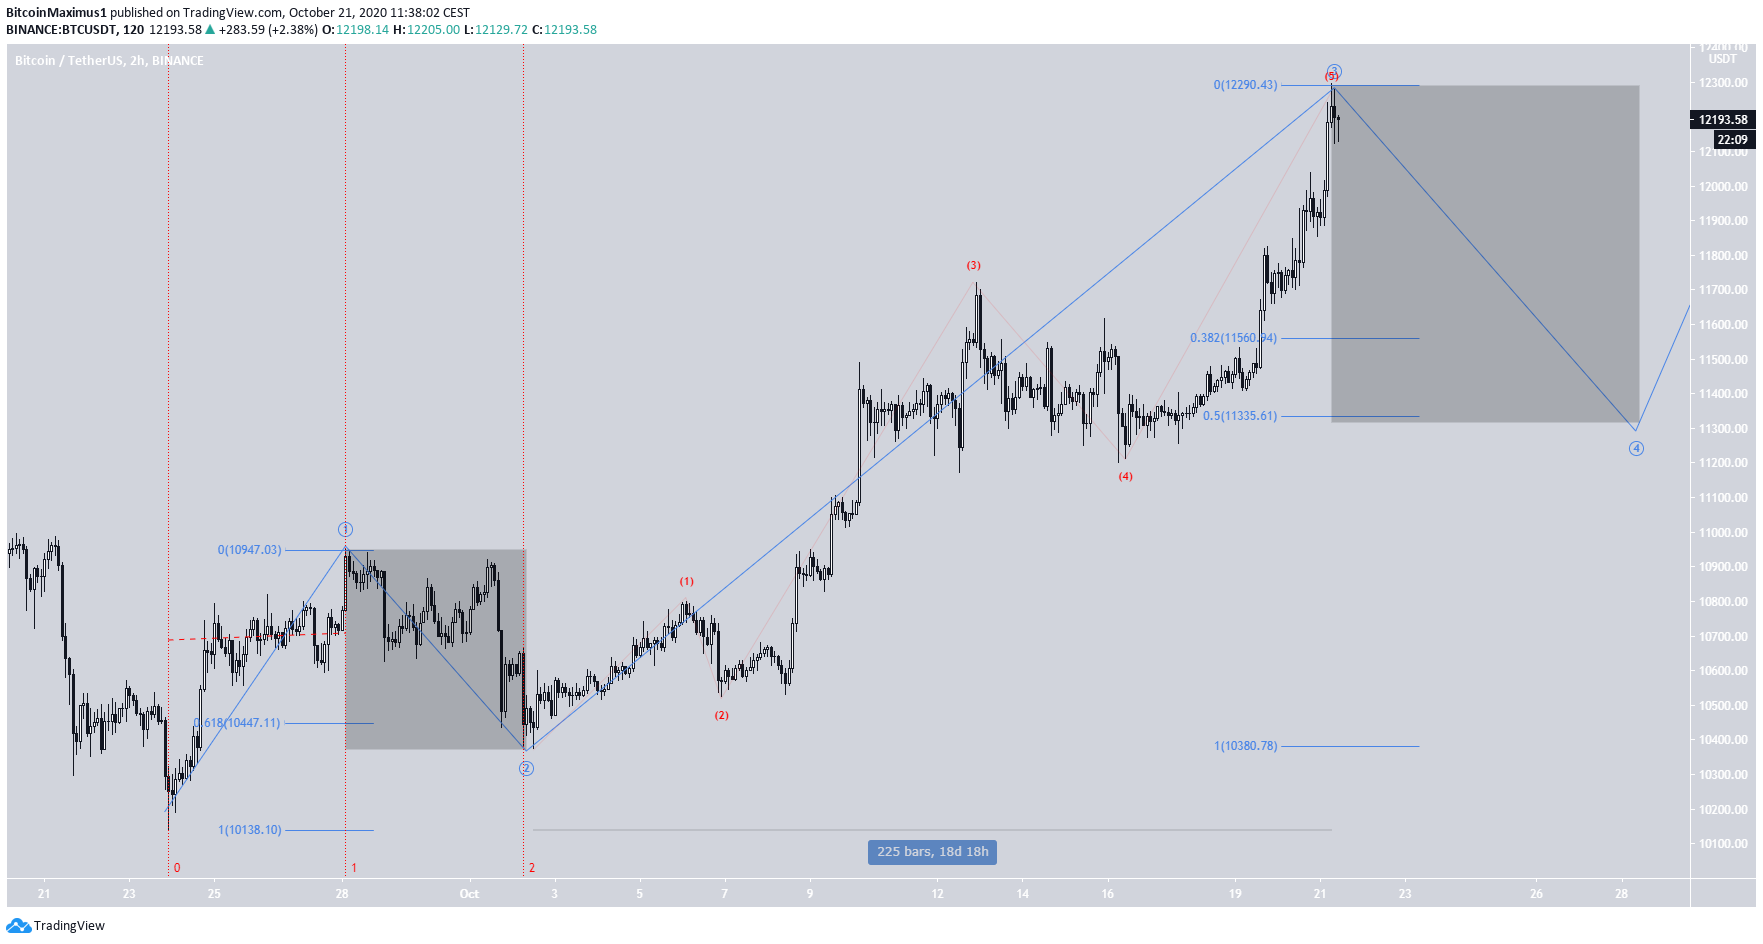
To determine the target for the potential corrective move, we need to look at sub-waves 1-2 (blue).
Due to EW rules, sub-waves 2 and 4 need to alternate between each other. The correction for sub-wave 2 was a flat correction, which completed a deep retracement (0.618) and took the same amount of time as sub-wave 1.
Ideally, sub-wave 4 would be a shallow zig-zag (0.382 – 0.5), which would end near $11,325. Furthermore, it should complete at a shorter time than sub-wave 3. Since sub-wave 3 took 18 days, we would expect sub-wave 4 to complete after about eight days.
Bearish Wave Count
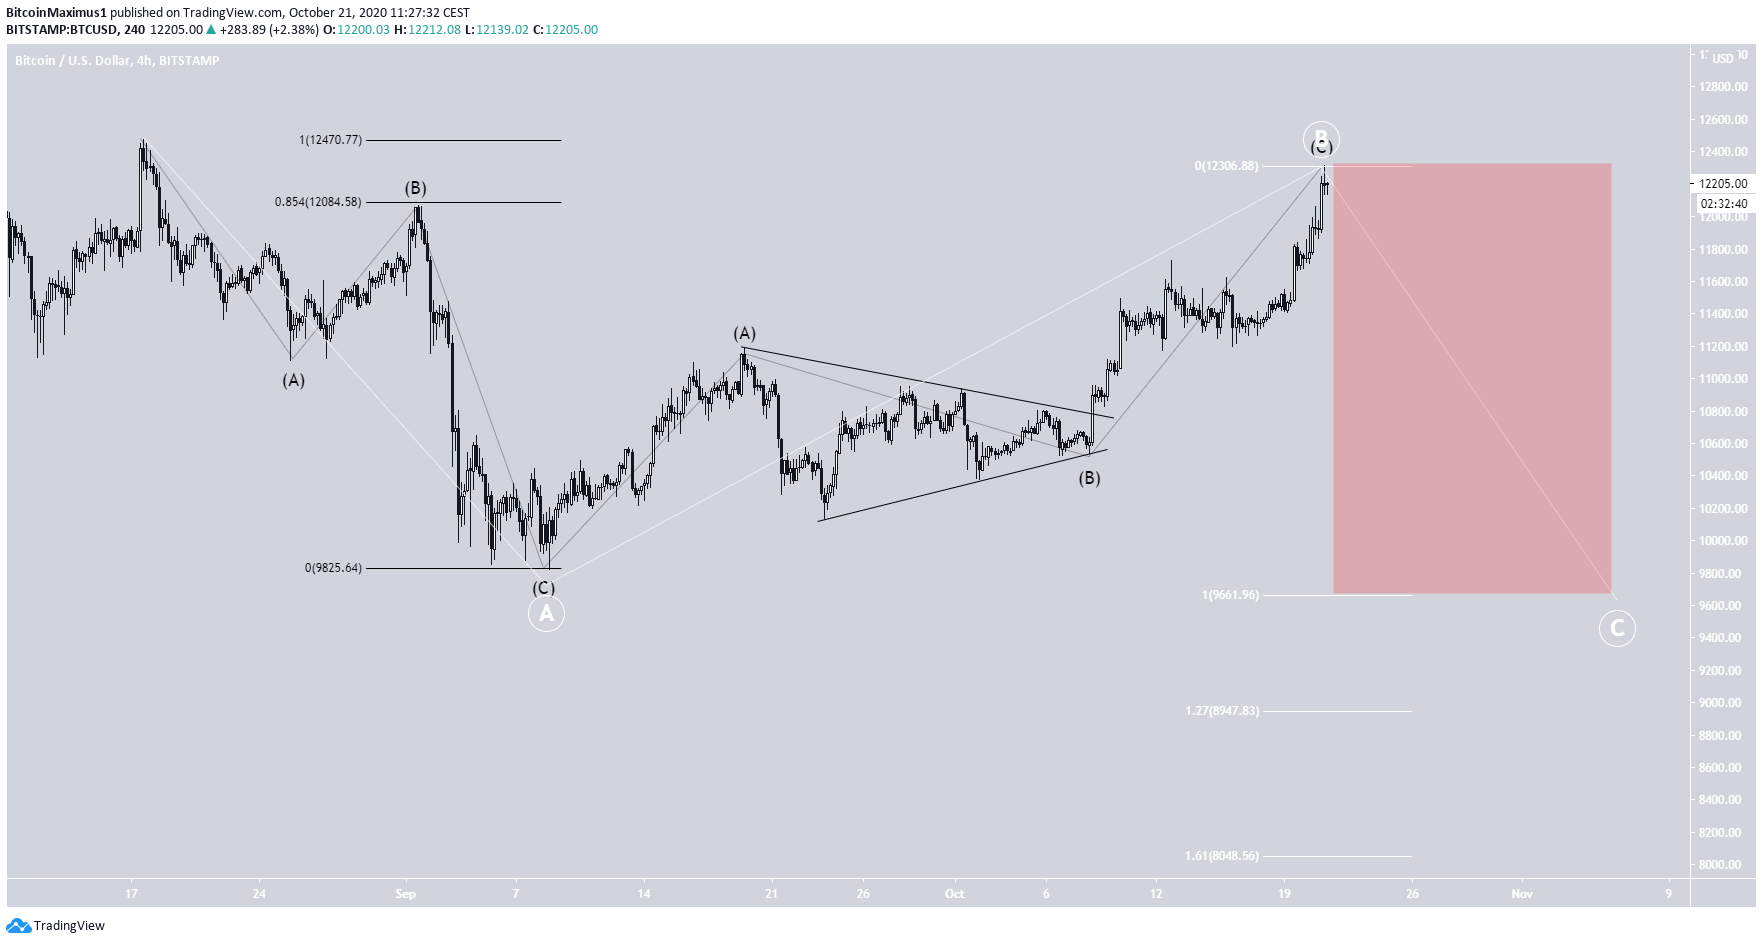
The bearish wave count suggests that the current rally is corrective, being part of the C-wave (black) of a longer-term B wave (white).
Since the initial A wave (white) took place in three subdivisions, the correction is considered a flat correction (3-3-5 sub-wave count). The B wave (white) has increased above the 0.85 Fib level of the entire decline, making it a valid flat correction.
While the price could technically rally above the $12,470 high of Aug 17 and create an expanded flat, those are rarer corrections.
What should follow after the completion of the current move is an impulse which completes the C wave. The three most likely targets for the bottom of this wave are at $9661, $8947, and $8048, the 1, 1.27, and 1.61 Fib projections of wave A (white).
To conclude, the decline from the current resistance level will be crucial in determining whether the trend is bullish or bearish.
For BeInCrypto’s previous Bitcoin analysis, click here!
Disclaimer: Cryptocurrency trading carries a high level of risk and may not be suitable for all investors. The views expressed in this article do not reflect those of BeInCrypto.


