


BitTorrent is the world’s largest peer-to-peer (P2P) filesharing network. It was acquired by the TRON Foundation in July 2018. On 2019, an ICO for TRON’s BitTorrent Token (BTT) was hosted on Binance Launchpad.
All tokens were sold within 15 minutes. Several days later it was trading on Binance and other exchanges. On Feb 11, BTT announced that it would be sponsoring the #VoiceYourLove Campaign to raise funds for ALS Association.
With all of the recent hype and the past success of BitTorrent, BTT looks poised to make steady gains. However, sometimes things can go seriously awry.
Will BitTorrent hit the moon or crash upon impact?
Key Highlights For Mar 6
- The price reached a swing high of $0.00083 on Mar 3
- A gradual decrease dropped it to $0.00074
- There is a resistance area near $0.000785 and $0.000805
- There is a bullish divergence in the RSI and the MACD
- Price is trading inside a symmetrical triangle
- There is support near $0.00074
A Gradual Decrease.
The price of BTT on Binance is analyzed on 1-Hour intervals from Mar 3 to Mar 6.
On Mar 3, the price of BTT reached a high of $0.00083. Prices have followed a gradual downward trend since.
Along the downward trend, there was observed general volatility with several minor rises and dips observed. Each rise produced a slightly lower high than the last. Tracing four of these, a descending resistance line is drawn.

The breakout from the resistance line by a wick in a volatile market is relatively unimportant as long as it is not preceded by continued breakouts. In the case of BTT, hourly highs rarely broke past the resistance and were not supported by maintained gains.
For this reason, the price can be considered to have decreased at the same rate predicted by the descending resistance line. The descending line can act as a ceiling to price, preventing it from reaching levels above it.
However, a breakout above could be the catalyst of a rapid price increase. As hype around BTT increases, such an increase is not entirely improbable. However, in the case of TRON, hype has not been able to produce an upward trend.
The Symmetrical Triangle
After the second high on Mar 4, the price dropped sharply to $0.00074. The price gradually increased, forming successive higher lows. Tracing these lows gives us the ascending support line.
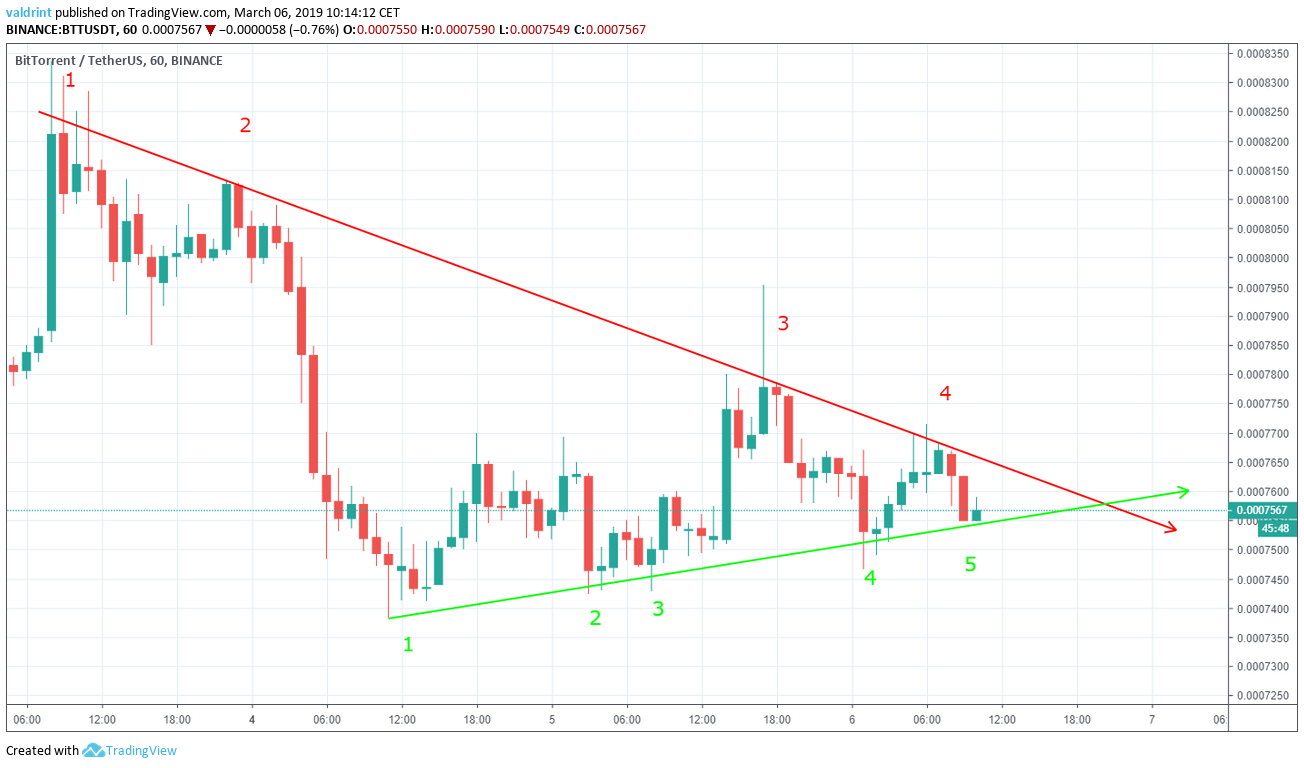
The support line has been touched five times.
The resistance and support lines give us a symmetrical triangle. By Mar 7, it is projected that BTT will have left the symmetrical triangle—either breaking down below the support or breaking out above the resistance. Because The triangle is a neutral pattern, a breakout and breakdown being equally likely.
Spotting The Divergence
The moving average convergence divergence (MACD) is a trend indicator that shows the relationship between two moving averages (long and short-term) and the price. It is used to measure the strength of a move. The relative strength index (RSI) is an indicator which calculates the size of the changes in price in order to determine oversold or overbought conditions in the market.
Combining MACD and RSI bullish/bearish divergence with support/resistance essentially predicts price fluctuations. It is especially effective when there is a bullish divergence on a bullish pattern or support line and vice versa. If both indicators are in agreement, they can be used to further add validity to the divergence analysis.

After the the Mar 4 bottom at $0.00073, the price again reached the same level on Mar 5. During the same interval, the MACD and RSI did not move in the same manner. They both reached a low on Mar 4 with high lows following throughout Mar 5.
This is called bullish divergence. It often precedes increases in price. Based on this, BTT may be more likely to breakout above resistance rather than breakdown below support. If this occurrences, price increases for BTT are likely, but it is unknown whether they will be able to reverse the current downward trend.
After the Breakout
Resistance and support areas are formed when the price reaches a certain level several times. They can act as a ceiling/floor that prevents the price from moving further in that direction.

The first resistance area is found near $0.000785 with the second near $0.000805. Conversely, the closest support area is found between $0.000740 and $0.000745.
Based on this analysis, a breakout above the resistance appears more likely than a breakdown below support. If the price of BTT moves toward past the first resistance point, such a prediction may be partially validated. If the price reaches or exceeds $0.000805, this prediction will be fully validated.
If the price of BTT, however, decreases below $0.000745, support may be threatened. A breakdown would become more likely. Breaking the support and dropping below $0.000740 could mean that the current downtrend is bound to continue for an indeterminate period into the future.
If the price does breakout past the resistance, the downtrend may still continue. Furthermore, subsequent dips after a breakout are also possible given the current downtrend.
Do you think BitTorrent will breakout of the symmetrical triangle and grow past the resistance or will it breakdown below the support? Let us know your thoughts in the comments, and be sure to check out our in-depth Litecoin (LTC) price analysis.
Disclaimer: This article is not trading advice and should not be construed as such. Always consult a trained financial professional before investing in cryptocurrencies, as the market is particularly volatile.


