


Over the last several weeks, Justin Sun and the TRON Foundation have engaged in various projects to promote TRON (TRX). Most recently, Sun announced that the stable coin Tether (USDT) would be integrated into the TRON blockchain.
Despite the shill, TRON‘s price has been on a downward trend for over 50 days. As losses increased throughout early March, the coin’s future becomes uncertain.
Will TRON overcome these losses or will its marketing campaigns prove to be a dismal failure?
Key Highlights
- Price has been following a descending resistance line for the past 53 days.
- It was trading in the range between the resistance line and the $0.023 support area until March 2nd when it broke down.
- TRON continues trading below both short and long-term moving averages.
- There is major resistance near $0.024.
- There is major support near $0.021.
- There is no clear trading pattern developing.
We are making big steps to achieve decentralized finance with @Tether_to. #TRON will soon have its own stablecoin! This will benefit our entire ecosystem and make it easier for institutions to access the TRON blockchain👏🏼 $TRX $BTT https://t.co/8mGcypBf9J
— H.E. Justin Sun 🍌 (@justinsuntron) March 4, 2019
53 Days of Turmoil
A look at the 2-hour chart for TRON shows that for the past 53 days, the price has been following a descending support line. This line has been validated five times. With a price of $0.027, Tron briefly touched the support line on Feb 24, 2019.
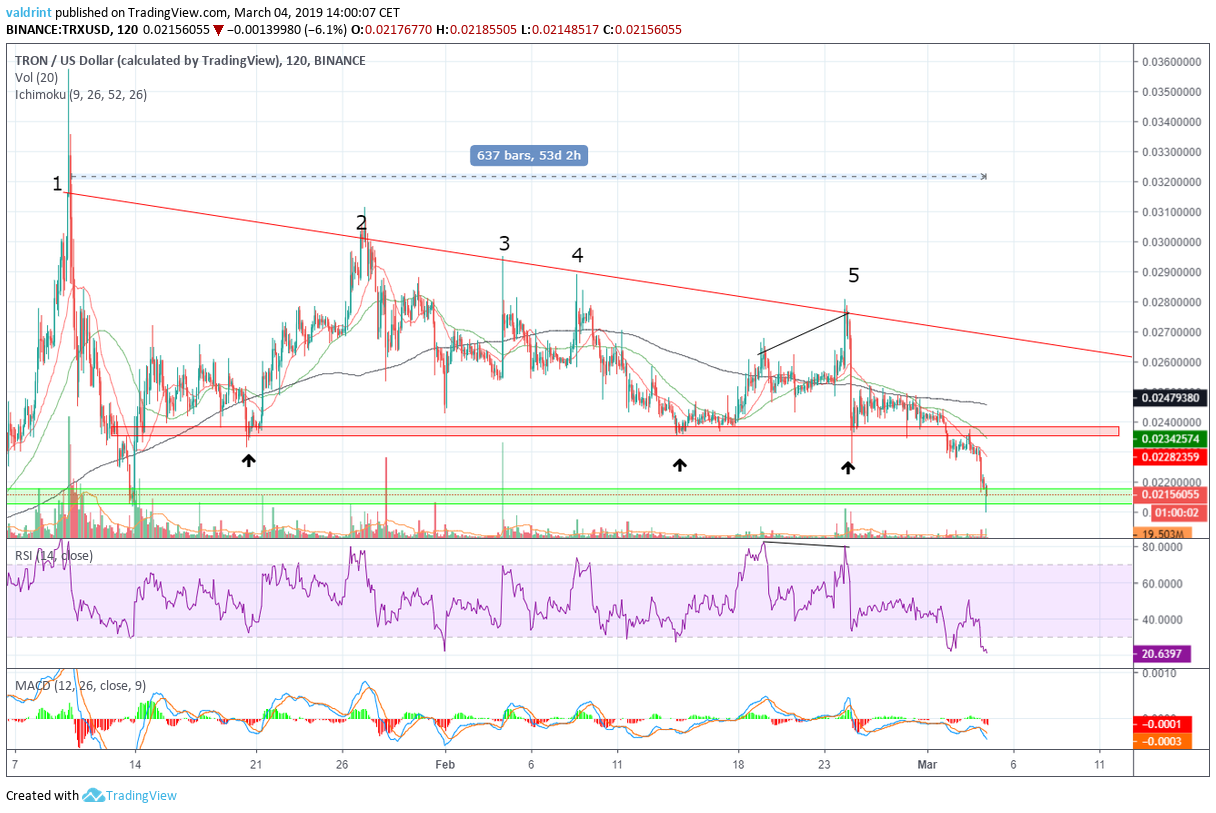
This was combined with a bearish divergence in both the relative strength index (RSI) and moving average convergence divergence (MACD). A flash crash affecting the entire market brought TRX to a low of $0.023.
This price appeared as a possible support area. However, in early March, the price broke down to $0.021—a new possible support. It is unclear whether or not this support will hold.
Currently, TRON is trading below the 21,50 and 200-period moving averages (red, green and black respectively). These have made numerous bearish crosses. The RSI is at 20, indicating oversold conditions but there is no divergence developing. The MACD is negative and falling.
The Breakdown
A look at the 15-minutes chart gives us a clearer view of when the breakdown occurred. We can see that it was characterized by bearish engulfing candles with higher than usual volume.
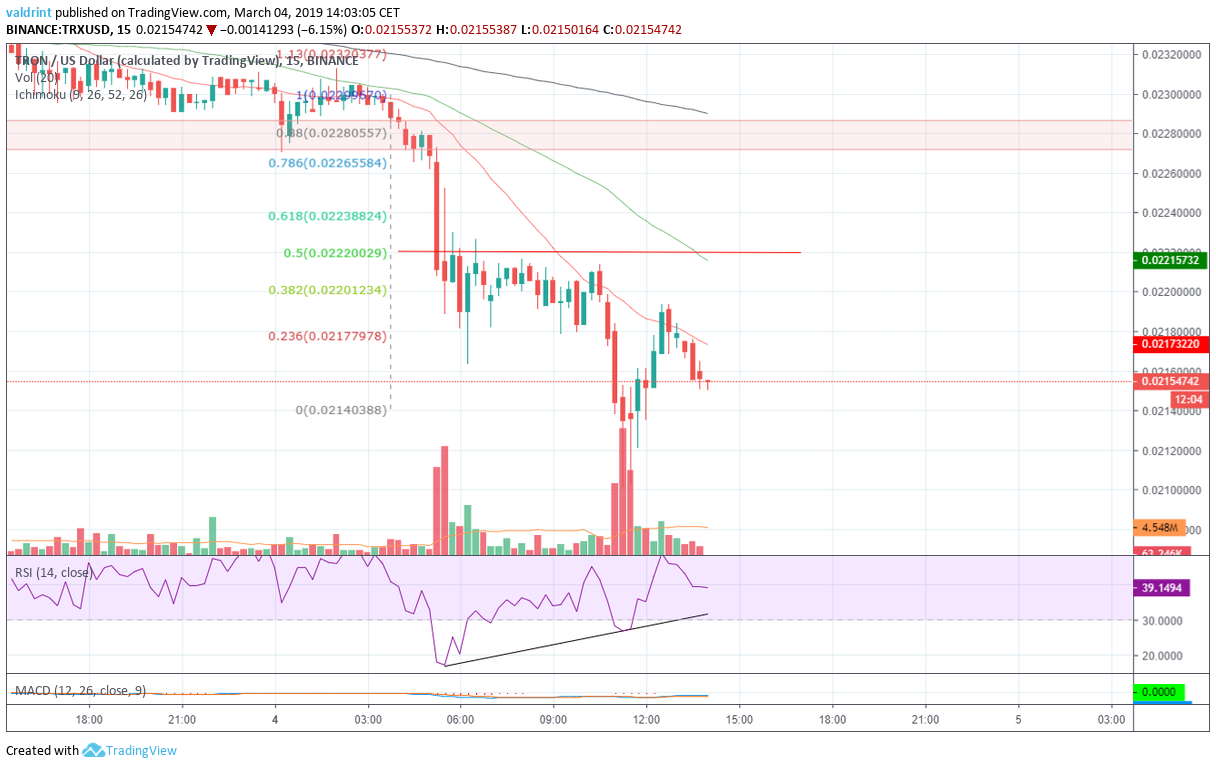
The price made a temporary bottom at $0.021, before starting to retrace. However, it has had difficulty retracing above the 0.382 fib line for the entire drop at $0.0220. There is strong resistance at the 0.5 fib line of $0.0222. This coincides with the 50-period moving average.
All of these indicators seem to suggest that continued decreasing average prices. However, if the marketing campaigns by the TRON Foundation prove successful, the price may increase above the current resistance line.
Do you think that TRON’s marketing will help increase the price or will shill prove ineffective? Tell us what you think in the comments, and check out our Bitcoin Price Prediction for 2019 and beyond!
Disclaimer: This article is not trading advice and should not be construed as such. Always consult a trained financial professional before investing in cryptocurrencies, as the market is particularly volatile


