
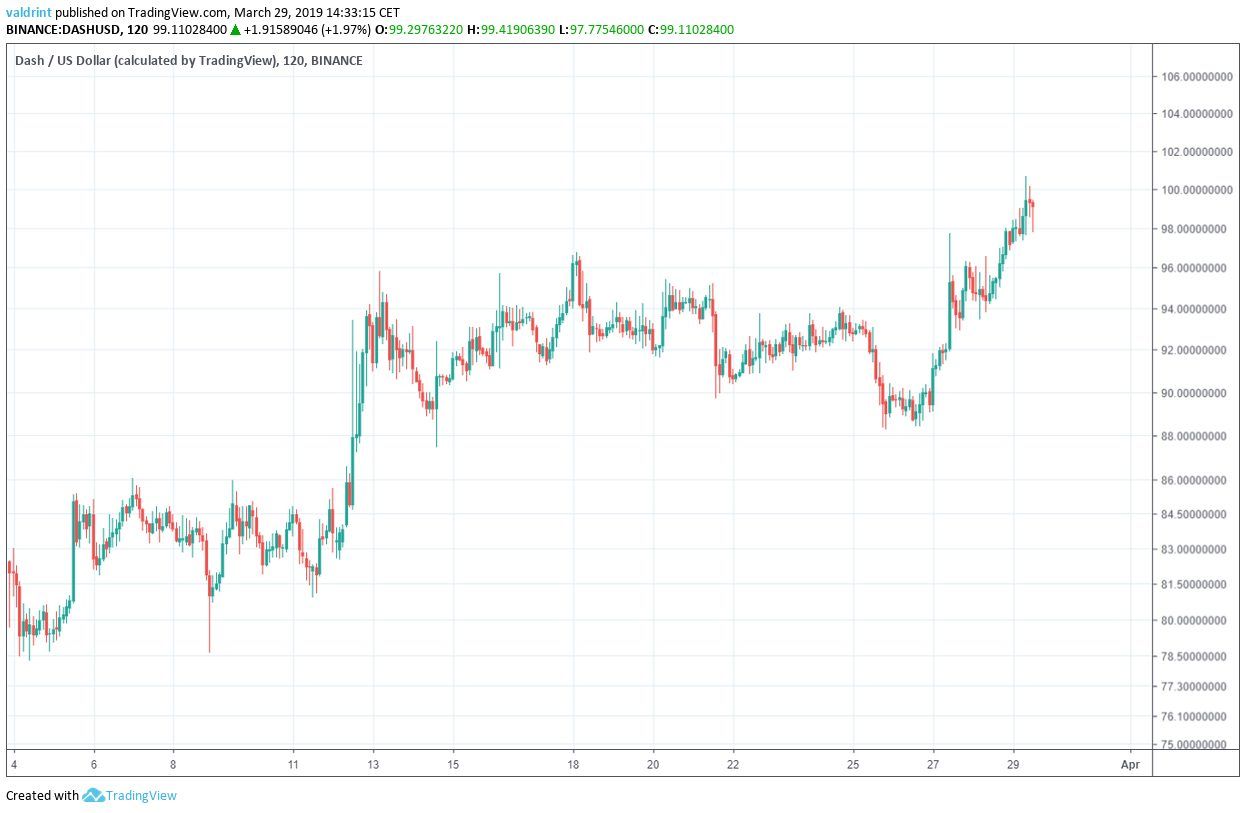
On Mar 4, the price made a low of $78.20. It has been gradually increasing throughout March. Currently, DASH is currently trading near $100—its highest value since Dec 2018.
DASH (DASH): Trends And Highlights For March 29, 2018
- DASH has been on an uptrend since Mar 4.
- It is trading inside an ascending channel.
- There is bearish divergence developing in the RSI and the MACD.
- There is resistance near $102.
- There is support near $78.
Ascending Channel
The price reached a low of $78.20 on Mar 4. An upward move followed.
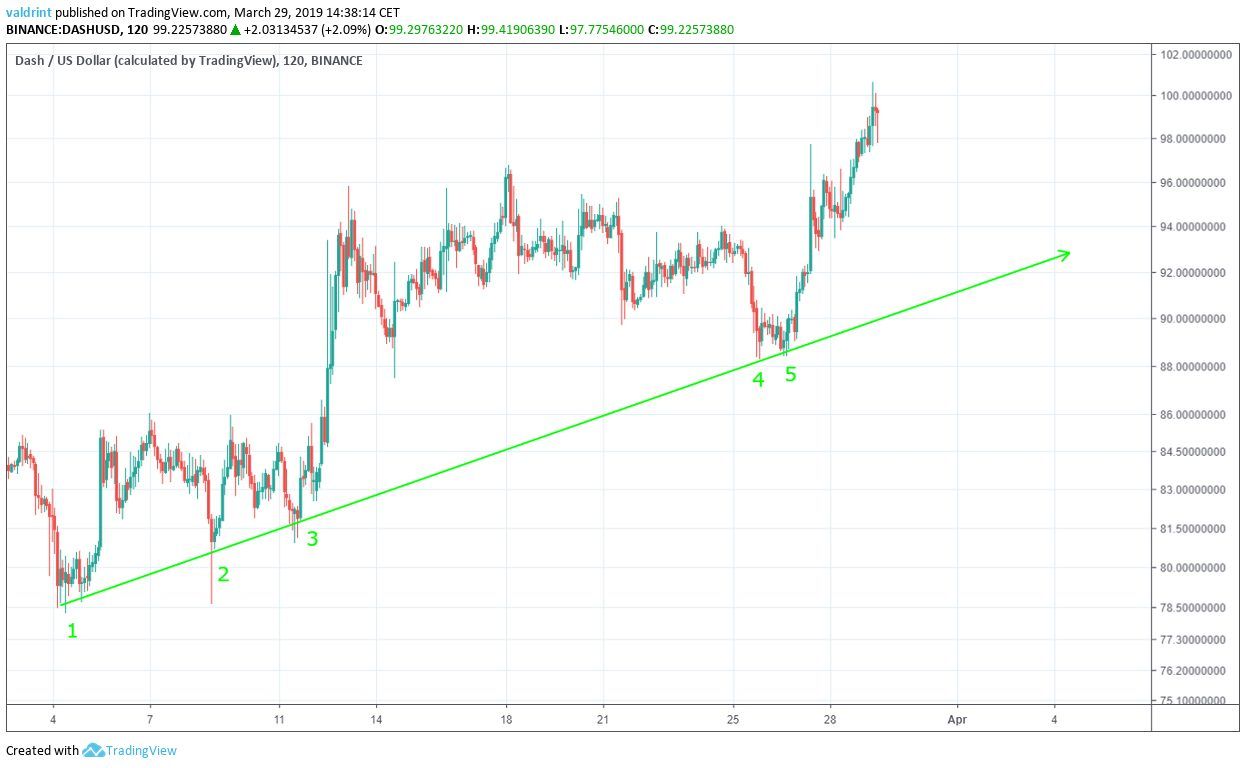
Several market cycles have been completed since, with each low being higher than the previous one. Tracing the closing prices corresponding to these lows gives us an ascending support line.
Furthermore, the price reached a high of $95.79 on Mar 13. It proceeded to make higher highs on Mar 16 and Mar 18. Tracing these highs gives us an ascending resistance line.
The resistance and support lines combine to create an ascending parallel channel:
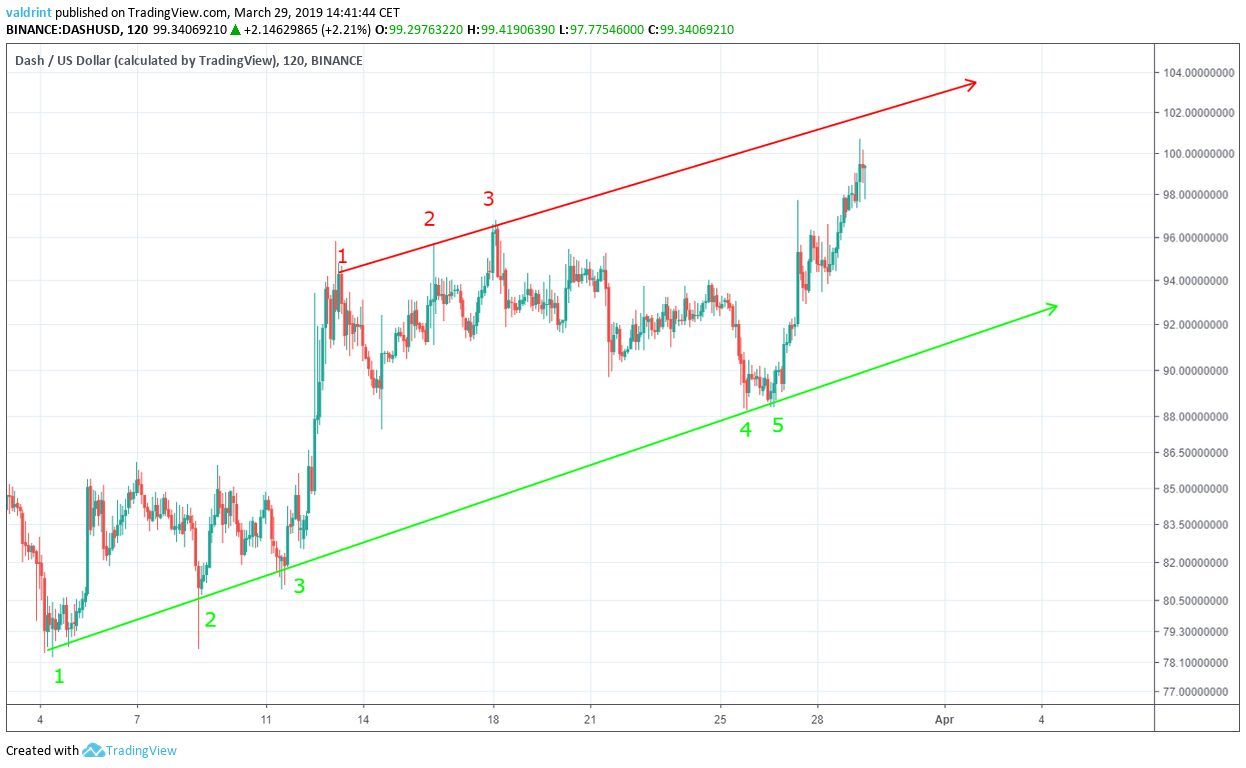
Parallel channels are typically neutral patterns with prices gains and losses expected within the confines of the channel. While this remains the case with DASH, the upward direction of the channel suggest long-term growth.
Based on this channel, highs and lows should continue to grow successively larger over the long-term despite possible short-term losses.
Reversal Areas
In order to predict possible future price levels, the price of DASH on Binance was analyzed at one-day intervals from Dec 1, 2018 to Mar 29, 2019 alongside resistance and support areas.
The first resistance area is found between approximately $98 and $102. Price reached this resistance area on Mar 29 when highs exceeded $100. If prices continue rising, DASH might break out of the current channel traced above.
In such a case, price increases might accelerate.
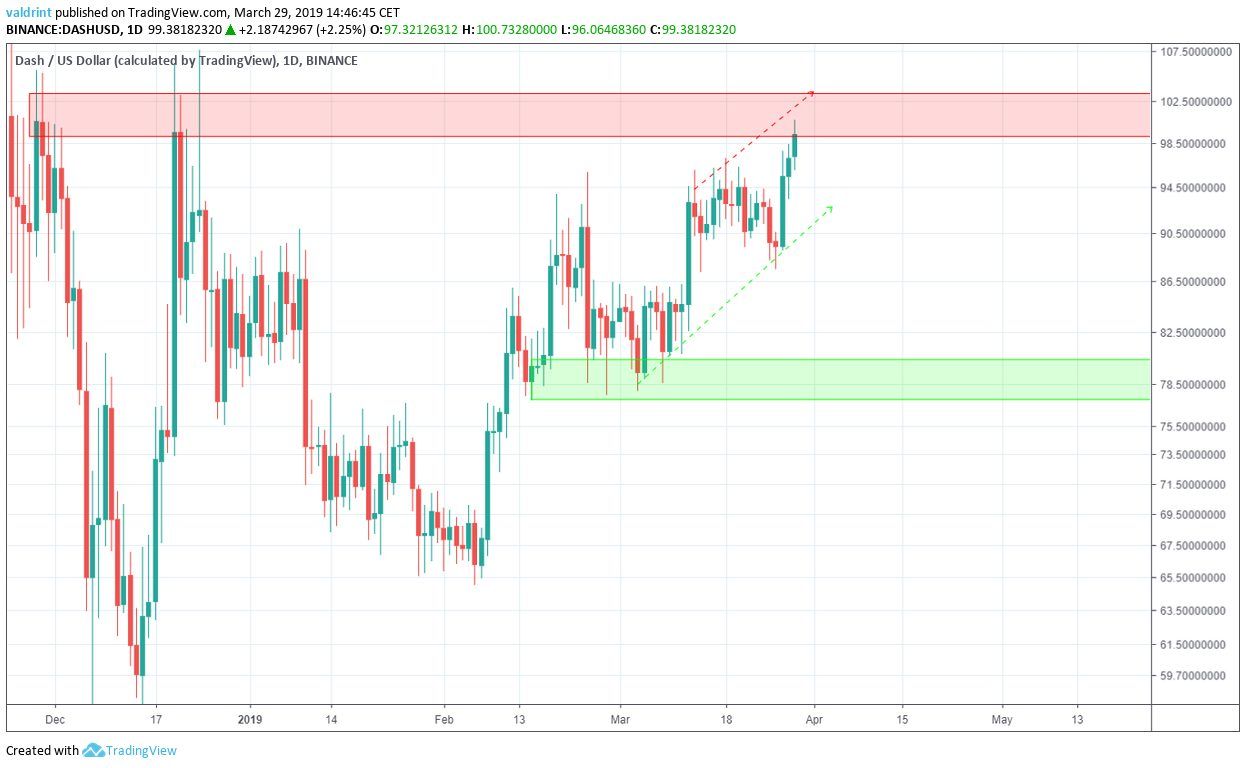
DASH might also drop toward the support area found near $78. However, this may be unlikely because this support area is now well below the support line of the current trading pattern.
This means that the levels could only be reached if DASH brokedown from the current channel. Based on this information alone, however, we cannot accurately predict whether or not a breakdown or breakout is likely
Looking Out For a Reversal
To better predict possible future price fluctuations, we must incorporate technical indicators into our analysis.
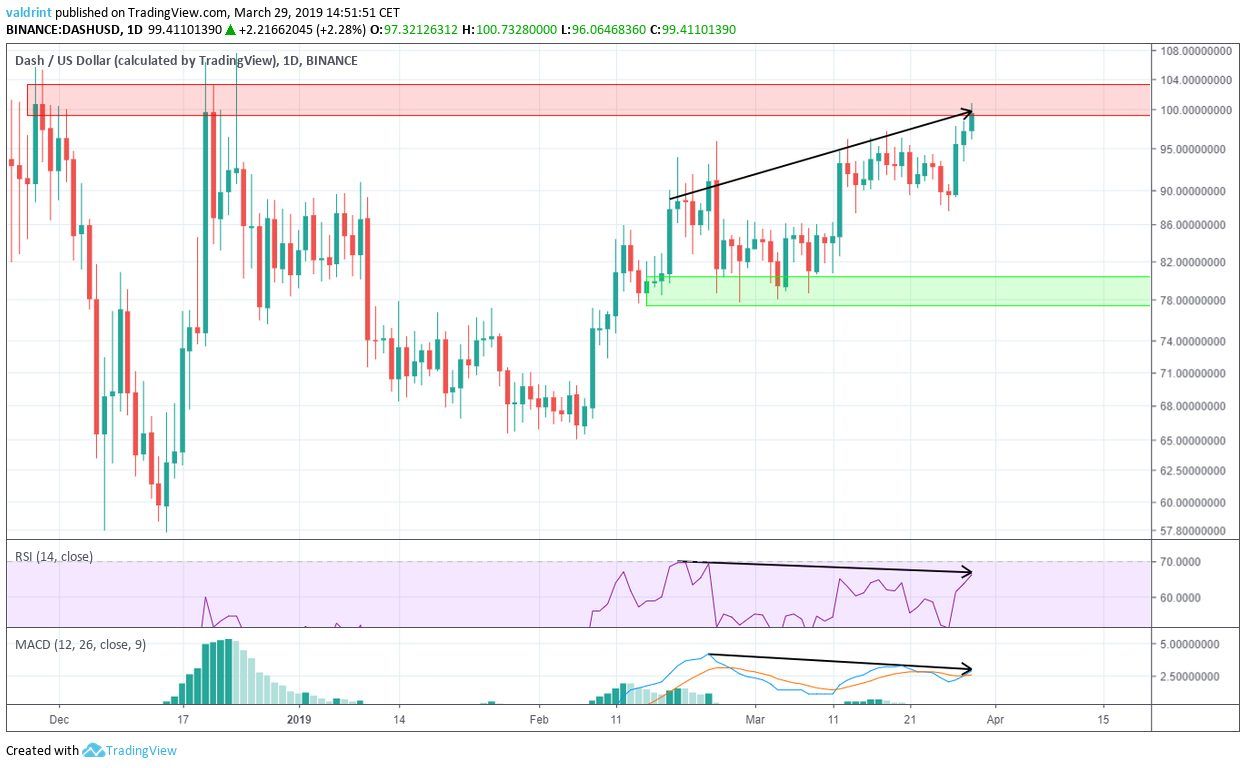
On Feb 19, the price made a high of $93.9. Since then, it has made several higher highs, culminating with the $100.2 high on Mar 29.
Similarly, the RSI and the MACD reached a high on Feb 19. However, they have proceeded to generate lower values.
This is known as bearish divergence and often precedes price decreases. The level of divergence is significant and is occurring inside a major resistance area. This further validates the possibility of price decreases.
Price may soon drop toward the support line of the channel. It is possible—albeit less likely—that price will breakdown below support and reach the support area around $78.
However, such lows may be reached in the months to come if a corrective period follows the gains seen since Feb.
Summary of Analysis
Based on this analysis, it is likely that the price will keep trading inside the confines of the ascending channel. Price is expected to drop to the support line. It is unlikely that we will see a breakdown below support in the immediate future. However, such a breakdown may occur in the longer-term to correct for DASH’s recent highs.
Do you think the price of DASH will keep increasing? Let us know in the comments below.
Disclaimer: This article is not trading advice and should not be construed as such. Always consult a trained financial professional before investing in cryptocurrencies, as the market is particularly volatile.
