


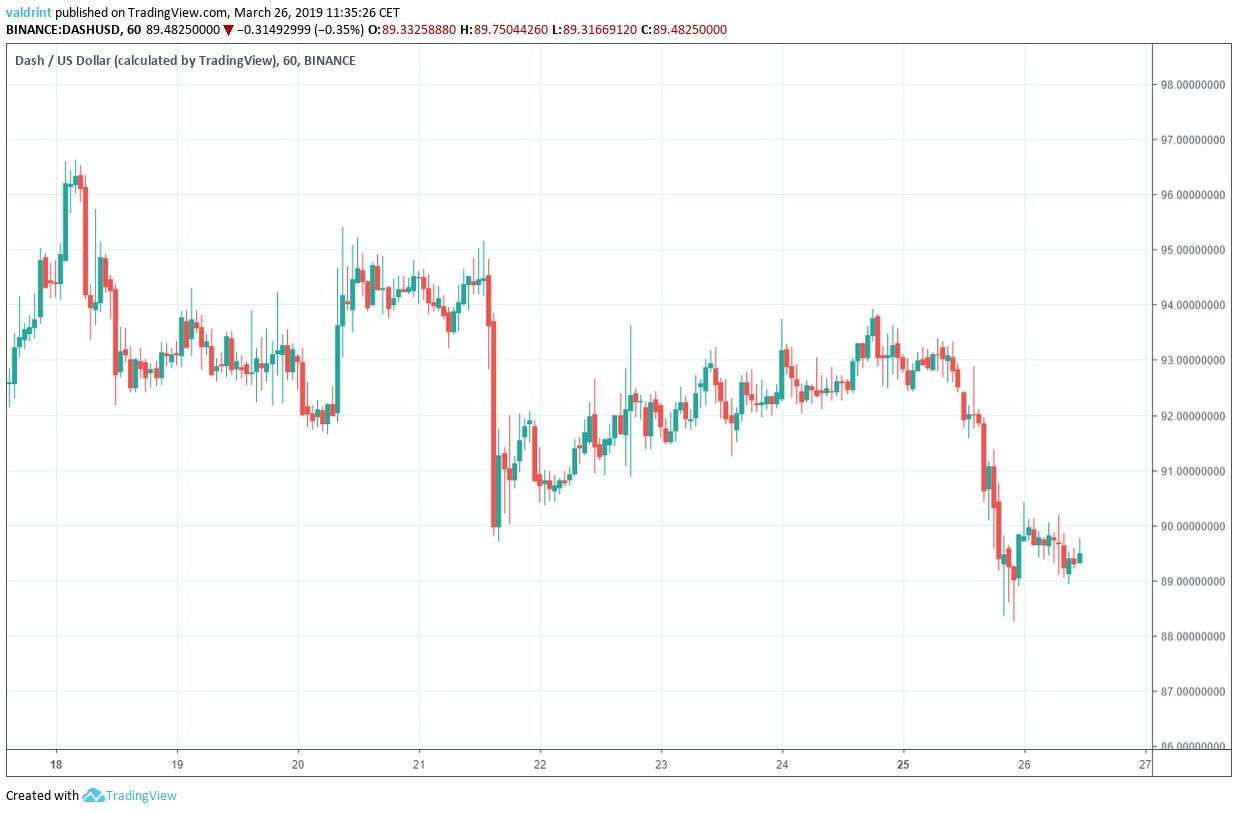
The price of DASH (DASH) reached a high of nearly $97 on Mar 18. Prices gradually fell to around $92 A gradual decrease ensued.
On Mar 20 and 21, highs over $95 were reached. A rapid on Mar 21, however, brought prices to under $90.
A gradual recovery took prices back to nearly $94 on Mar 24 before more significant losses occurred. Lows near $88 were experienced the following day.
At the time of writing on Mar 26, the price was trading between $89 and $90.
Since Mar 18, DASH has experienced gradual prices losses despite volatility. Highs have continued to get lower and DASH is struggling to rebound.
When will this downward trend end? Will DASH ever make it back to $100?
Based on today’s analysis, we predict that DASH will experience continued price decreases within its current trading pattern. DASH is currently trading within a descending channel defined below.
DASH: Trends And Highlights For March 26
- DASH broke down from an ascending wedge on Mar 18.
- DASH has been on a downward trend since.
- DASH is trading inside a descending channel.
- The MACD and SMAs triggered the beginning of a downtrend.
- There is resistance near $95.
- There is support near $88 and $84.
Previous Movement
The price reached a low of $87.94 on Mar 14. A gradual upward move ensued.
Several market cycles have been completed since, with each low being higher than the previous one. Tracing the closing prices corresponding to these lows gives us an ascending support line.
The price reached a high of $95.79 on Mar 13. It proceeded to make a higher high on Mar 18. Tracing these highs gives us an ascending resistance line.
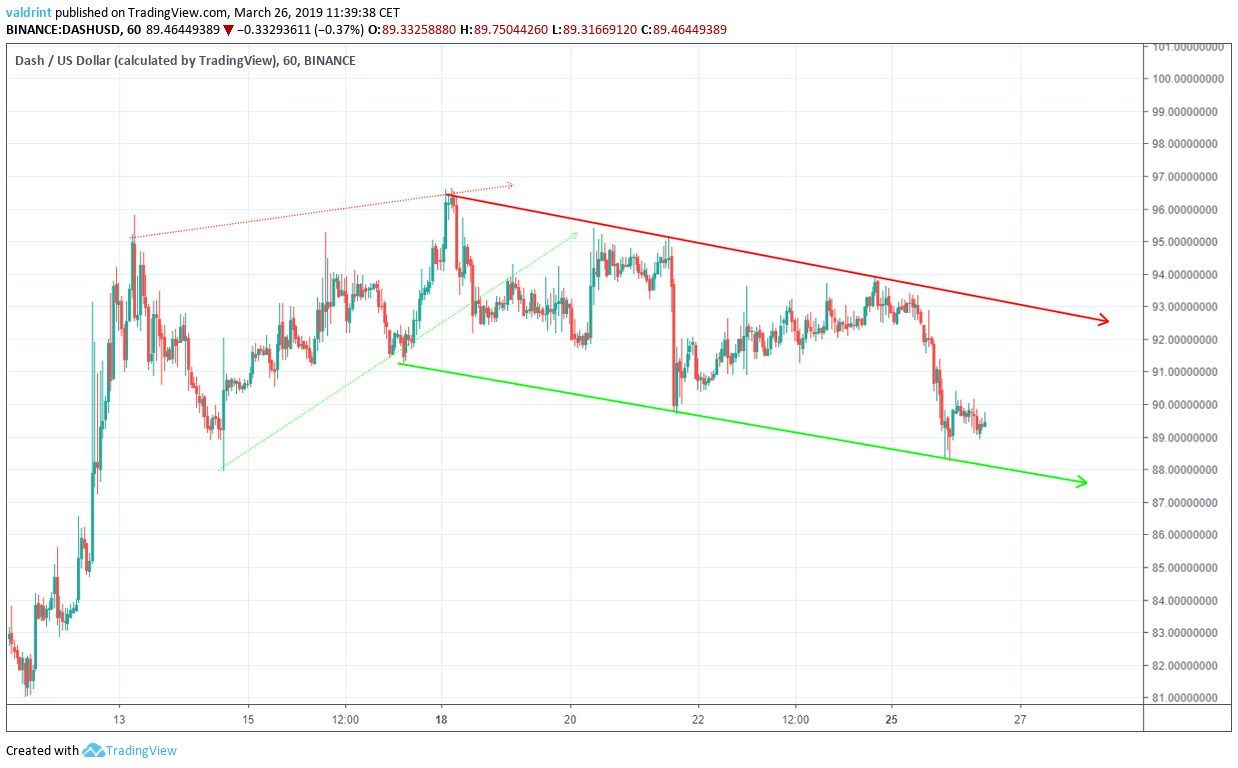
The resistance and support lines combine to create an ascending wedge. This is a bearish pattern. Taken alone, it suggests forthcoming price losses.
These prices losses began following a breakdown from the wedge on Mar 18. At that point, new support and resistance lines emerged to define a new trading pattern. In short, the current downward trend is a continuation of the breakdown from the ascending wedge.
It is a natural market response to rapid price gains experienced earlier in the month.
Horizontal Resistance
The price of Dash (DASH) on Binance is analyzed at one-hour intervals from Mar 18 to Mar 26 to trace the resistance and support lines.
The price reached a high of $96.78 on Mar 18. A gradual decrease ensued before price rebounded to make a lower high of $95.24 on Mar 21.
Tracing these highs gives us an ascending resistance line. This is the second resistance line seen in the graph above.
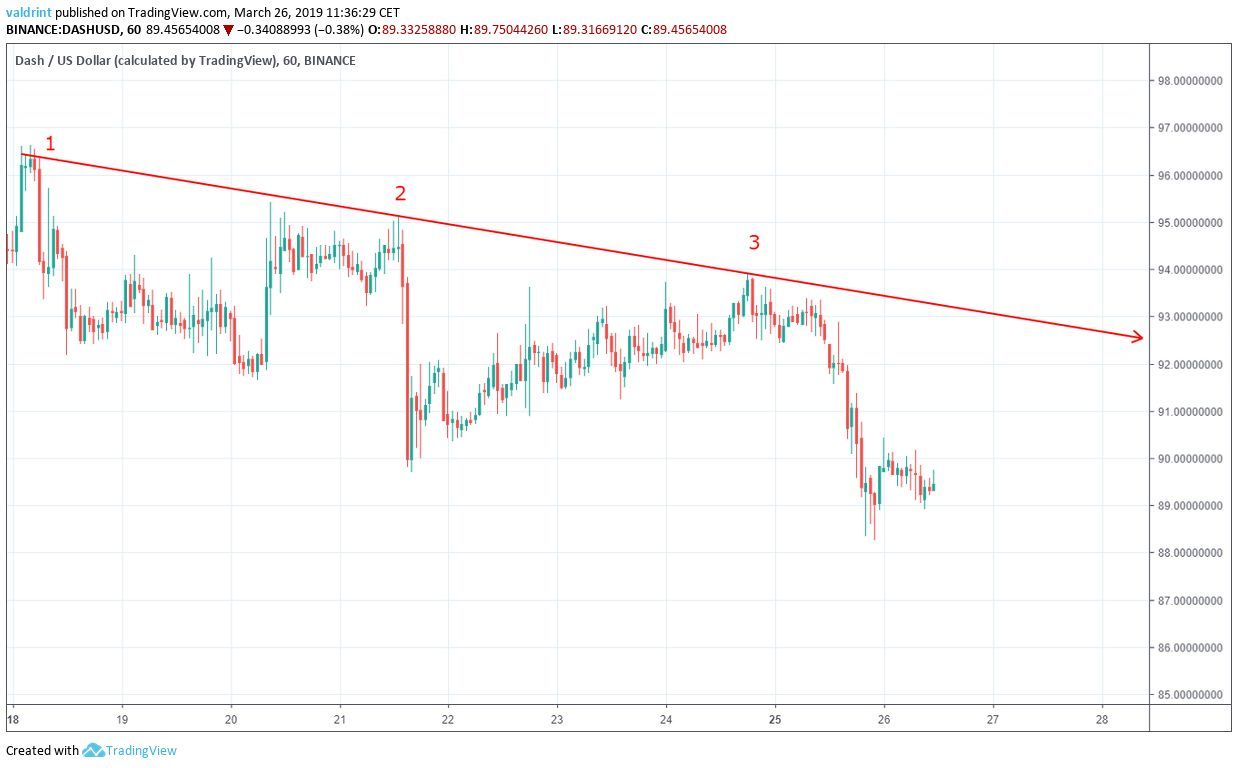
The resistance line theoritically traces the upper limits of price over a period of time. If the line is an accurate gauge of a price’s trend, then price should trade at or below the rate specified by the line whenever it is descending.
DASH had been trading at the rate defined by the resistance until Mar 25 when prices losses accelerated. Based on the current trend, it is possible that DASH may experience price increases toward the resistance. However, longitudinal price losses should be expected based on the direction of the resistance line.
Descending Channel
Having traced the resistance line, we turn toward the support. Once both are traced, we will have defined the descending channel in which DASH is currently trading.
On Mar 17, the price made a low of $91.2. A sharp move ensued followed by a gradual drop. Several market cycles have been completed, with each low being lower than the previous one.
Tracing these lows gives us a descending support line.
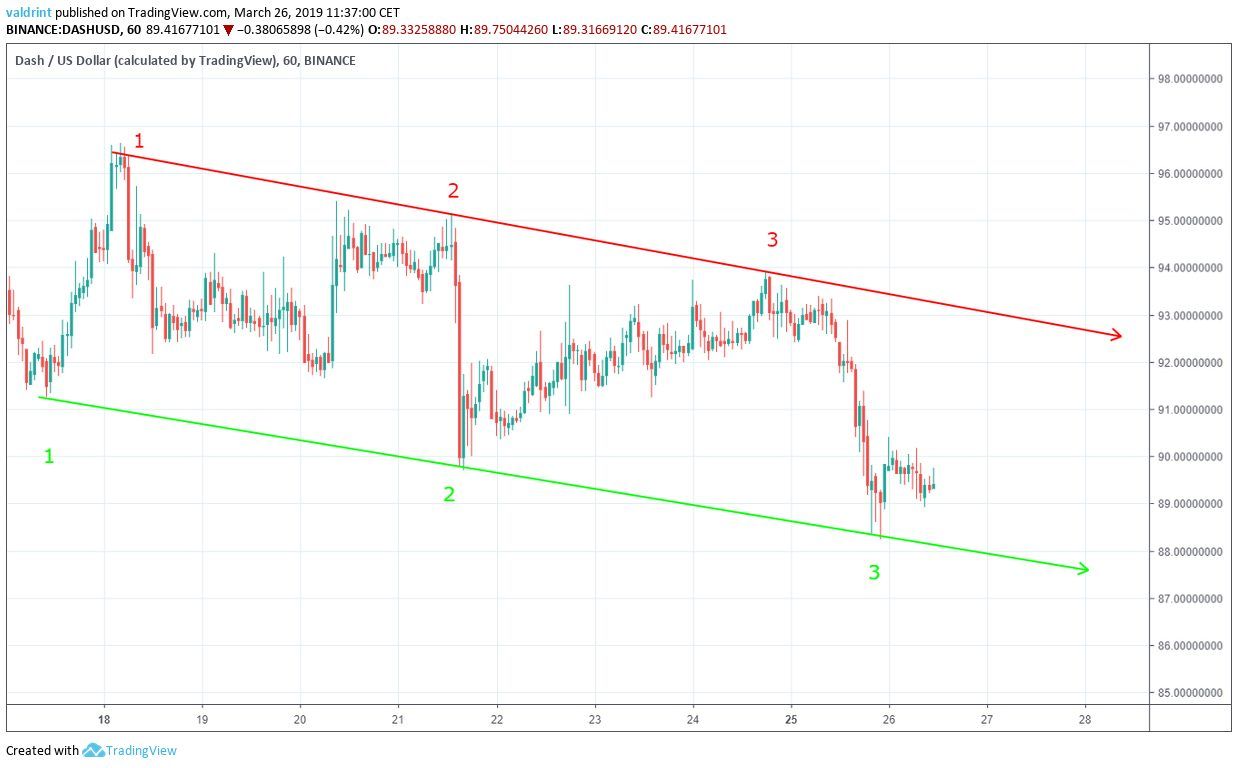
Similar to the resistance line, the support line acts as a floor to price, preventing further downward movement. It also measures the rate of an asset’s decline. The price has decreased at the same rate as predicted by the support line.
The resistance and support lines combine to create a descending channel. This is a generally netural pattern. The price of DASH is likely to rise and fall within the channel.
Because the channel is descending, long-term price losses should be expected despite possible short-term gains. In fact, if DASH returns to the resistance, short-term gains may be experienced in the near future. However, the downward facing resistance suggests that the next high to be experienced will be lower than the last.
To better assess future price fluctuations, we must integrate technical indicators into our analysis.
Looking Out For a Reversal
The moving average convergence divergence (MACD) is a trend indicator that shows the relationship between two moving averages (long and short-term) and the price. Combined with simple moving averages (SMA), MACD can be used as a trigger for buy and sell signals.
Signals are triggered whenever the MACD line is above 0 and the price is above the 10 (red) and 50-period (green) SMAs.
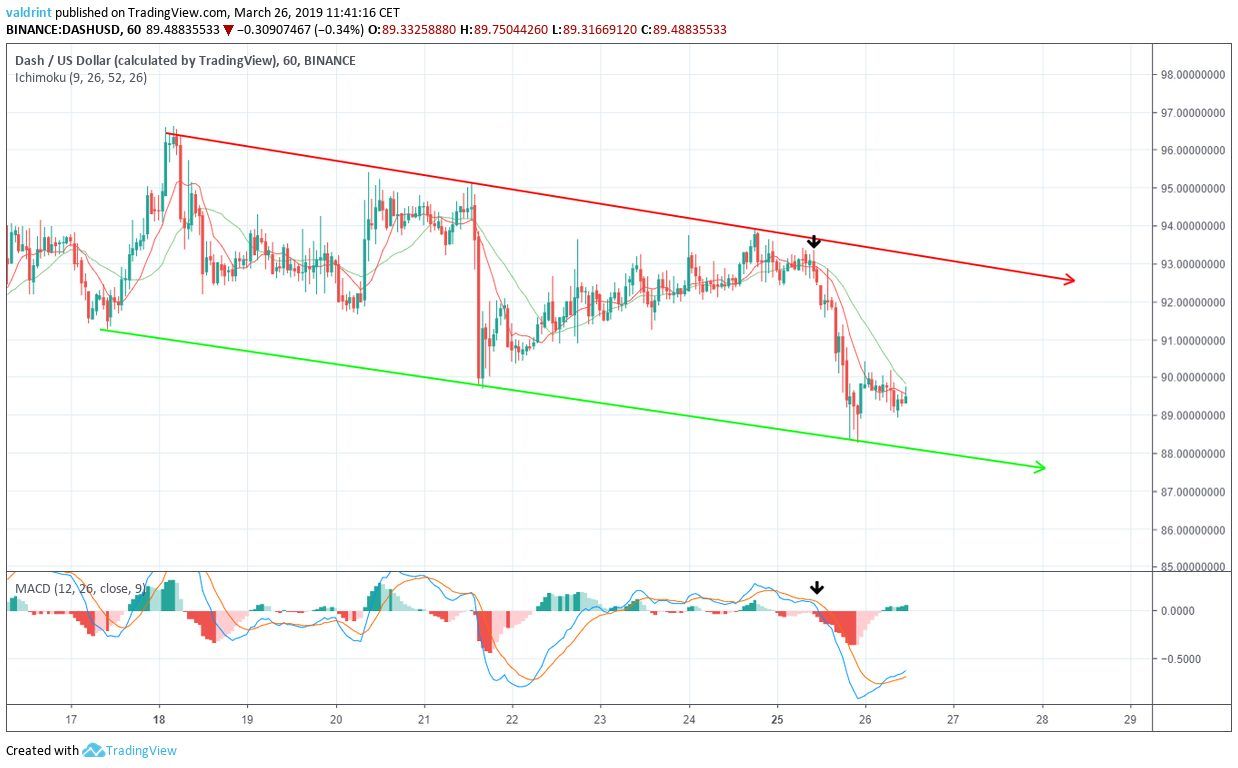
On Mar 25, the 10-period MA crossed below the 21-period one. Similarly, the MACD line crossed below 0.
These movements indicate that the current trend may be over and a new downtrend may have already begun.
Currently, the 10-period MA is very close to crossing above the 21-period MA. Furthermore, the MACD line is moving upward, attempting to cross above 0.
If both attempts are successful, it would indicate that an uptrend may have begun and the price would likely head towards the resistance line.
These indicators appear to outline the possibility that the price will move towards the resistance line of the channel but that we should continue to expect long-term price losses despite any new highs that may reached in the short-term.
Future Movements
In order to predict possible future reversal areas, the price of DASH on Binance was analyzed at two-hour intervals from Feb 25 to Mar 26.
Resistance and support areas are formed when the price revisits the same level several times.
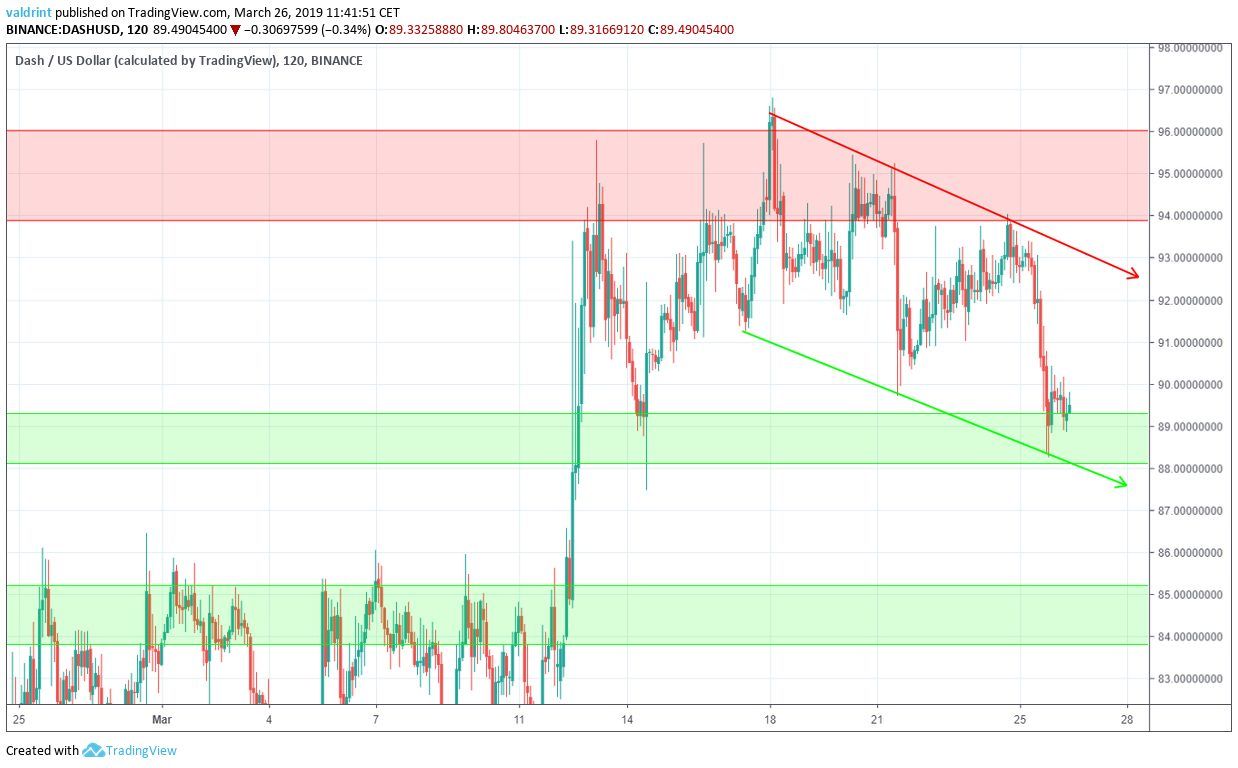
The first resistance area is found near $95, coinciding with the top of the channel. If the price breaks out of the channel, it would provide a likely reversal area. According to our analysis, it is unlikely that the price will reach this level soon even if there are price increases as predicted. As the resistance line continues moving downward, the highs should consistently drop farther away from the $95 level.
Conversely, the closest support area is found near $88. DASH has already reached this support. Continued price decreases along the support may lead to DASH to the second support area of $84.
Price is likely to rise toward the resistance before dropping closer to the second support. However, the rise should precipitate greater losses.
Summary of Analysis
Based on this analysis, it is likely that the price will keep decreasing at the rate predicted by the channel. This suggests that prices might increase toward the resistance line in the near future before dropping back toward the first support area of $88. Prices might drop toward the second resistance area of $84, but it unclear when these levels will be reached.
Do you think the price of DASH will keep decreasing? Let us know in the comments below.
Disclaimer: This article is not trading advice and should not be construed as such. Always consult a trained financial professional before investing in cryptocurrencies, as the market is particularly volatile.


