
Dash (DASH) looks to be approaching the apex of its current pattern, making a decisive move outside this pattern crucial in determining the future trend.
The DASH price has been decreasing alongside a descending resistance line since reaching $198.80 in May 2019. The slope of the line is not entirely clear due to the presence of many long upper wicks.
DASH Long-Term Levels
More recently, the price began an upward move in the period between March-Aug 2020. Currently, DASH is approaching the $61 support level, which is the 0.618 Fib level of the aforementioned upward move.
If the area is successful in initiating a bounce and DASH begins to move upwards, the closest resistance level would be found at $86, coinciding with the descending resistance line.

Lack Of Confirmation
The daily time-frame offers some signs of a possible bullish reversal, but do not confirm it. The strongest signal is given by the growing bullish divergence in the RSI. Furthermore, the MACD has also generated some bullish divergence and is increasing.
However, the Stochastic Oscillator has made a bearish cross once again, casting some doubt on the bullish scenario.

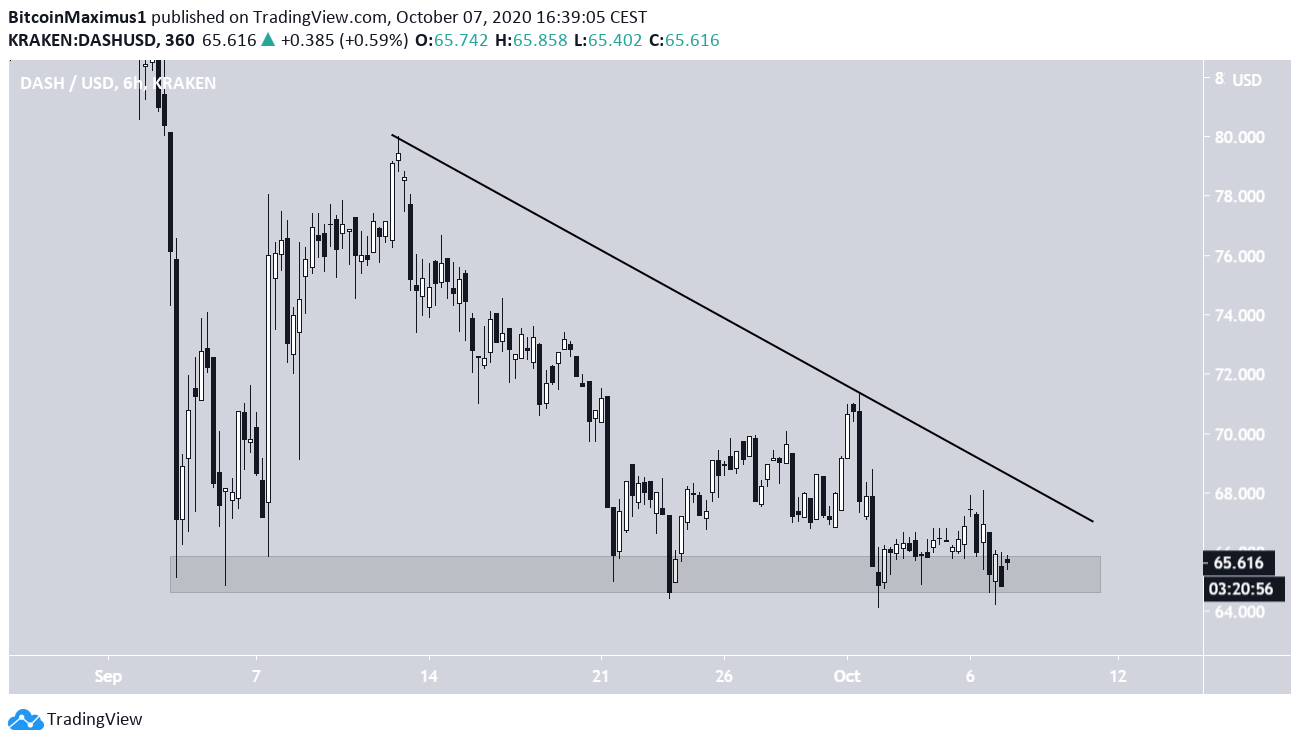
The daily chart also shows a possible descending wedge, which has an unusual formation. The price is rapidly approaching the point of convergence between resistance and support, so a decisive move should occur soon.

However, the six-hour chart shows a possible descending triangle, which is normally considered a bearish pattern. In addition, each bounce from the minor $65 area has been weaker than the preceding one, a sign of dissipating buyer strength.
Therefore, a movement outside of either the resistance or the support levels will be required to determine the future trend.
Wave Count
Cryptocurrency trader @Tradingsurfers outlined a DASH chart which shows a long-term wave count that shows two options, a bullish scenario towards new yearly highs and a bearish trend towards new yearly lows.
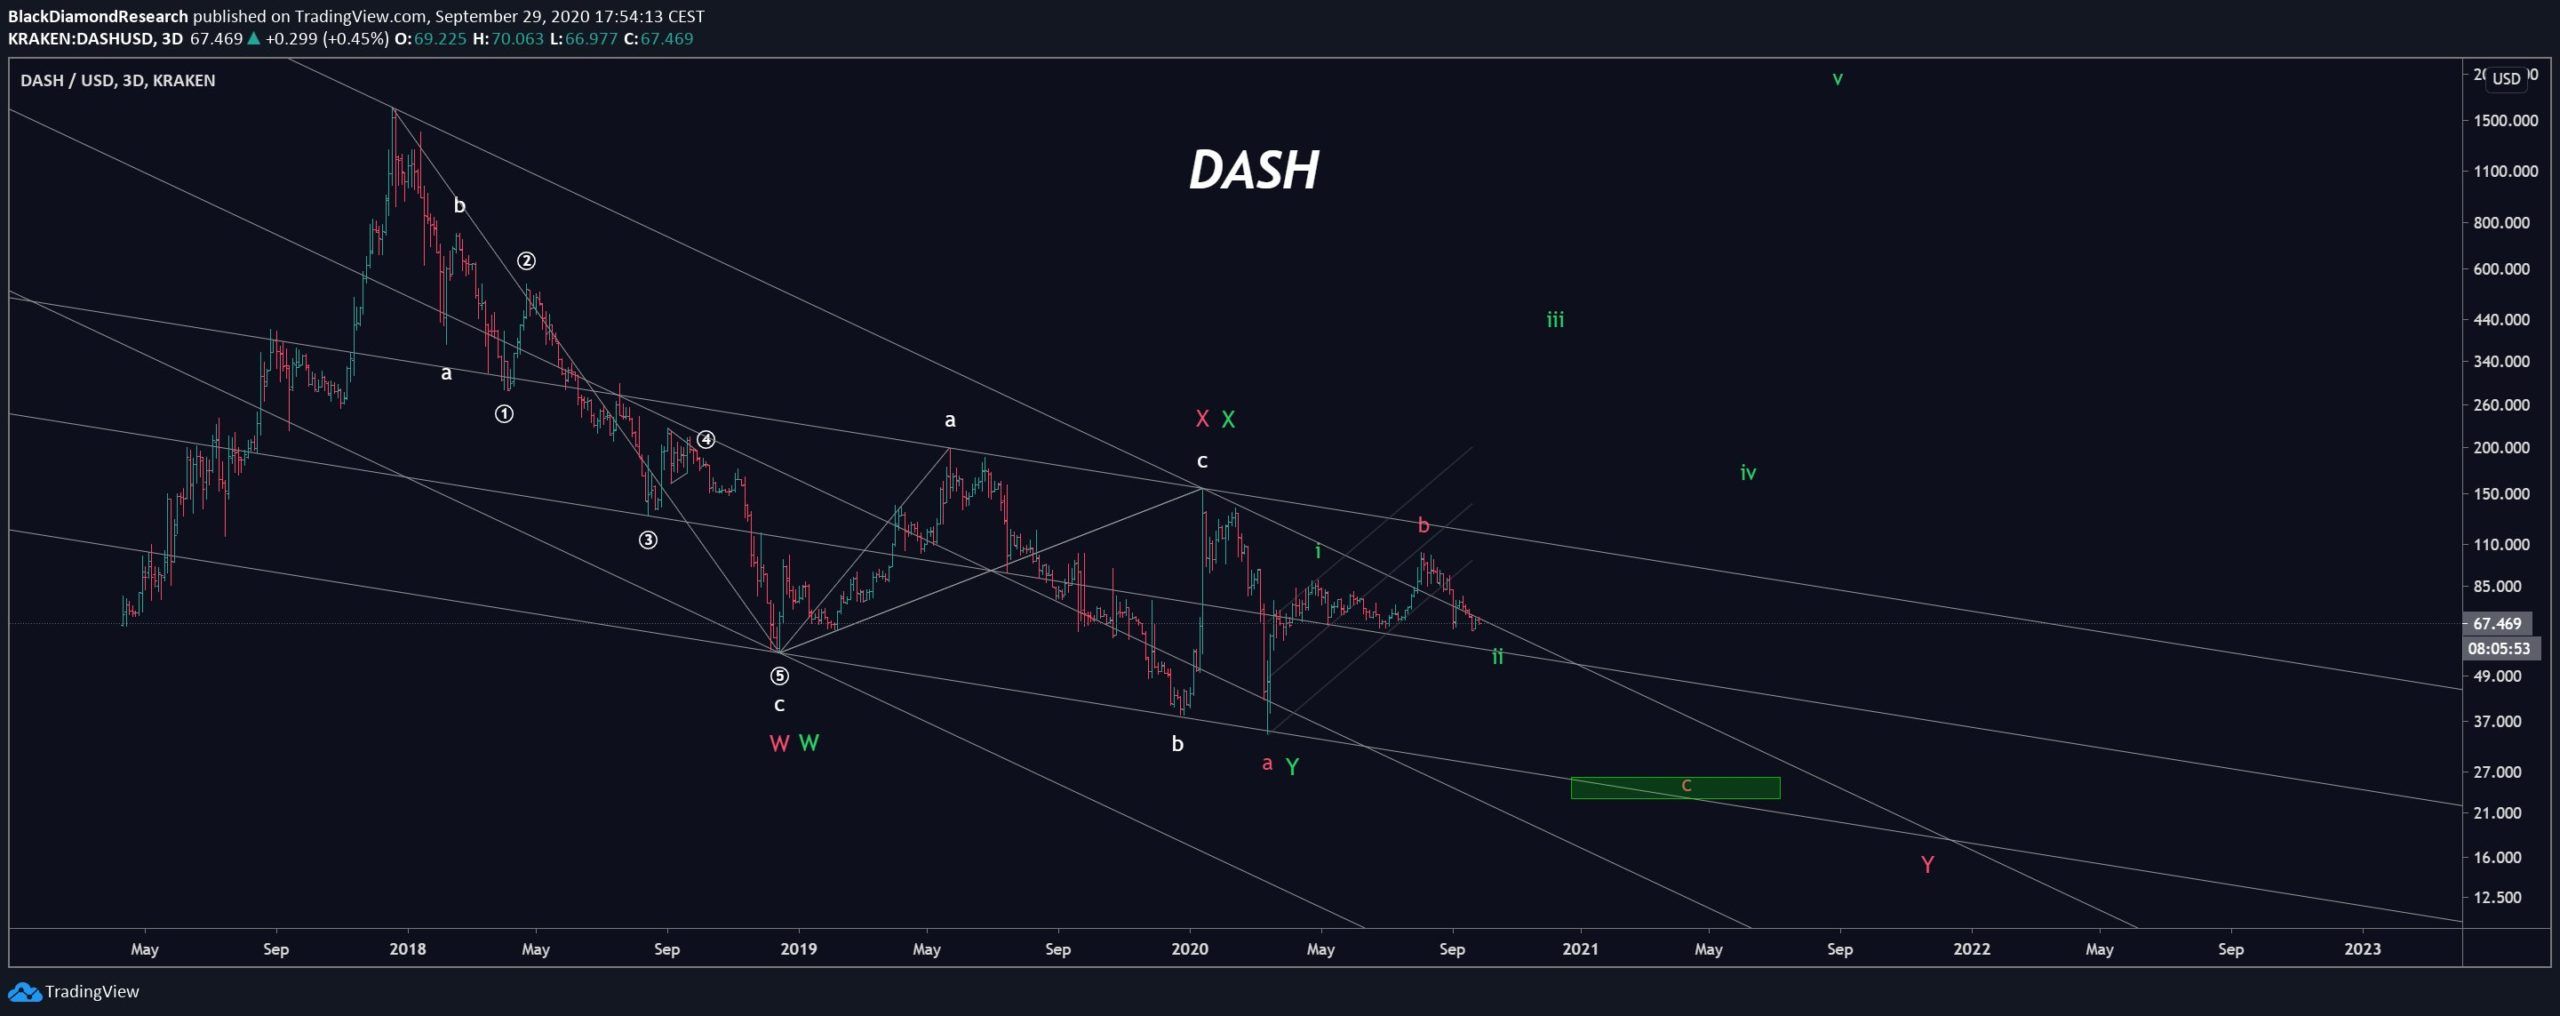
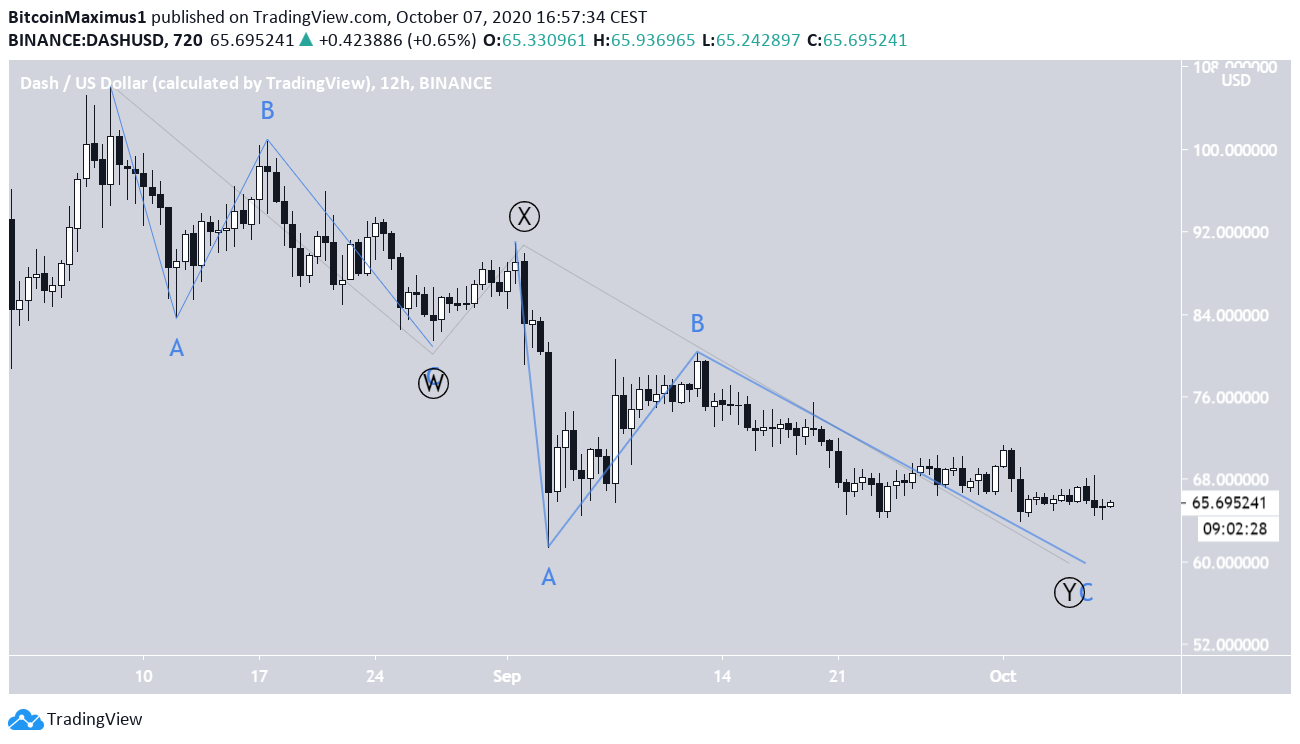
The most likely count, outlined in detail in the previous analysis suggests that DASH is completing a W-X-Y correction (shown in black below), and is currently in the final C wave (shown in blue).
So far, the price has reached a wave A low of $61.30.
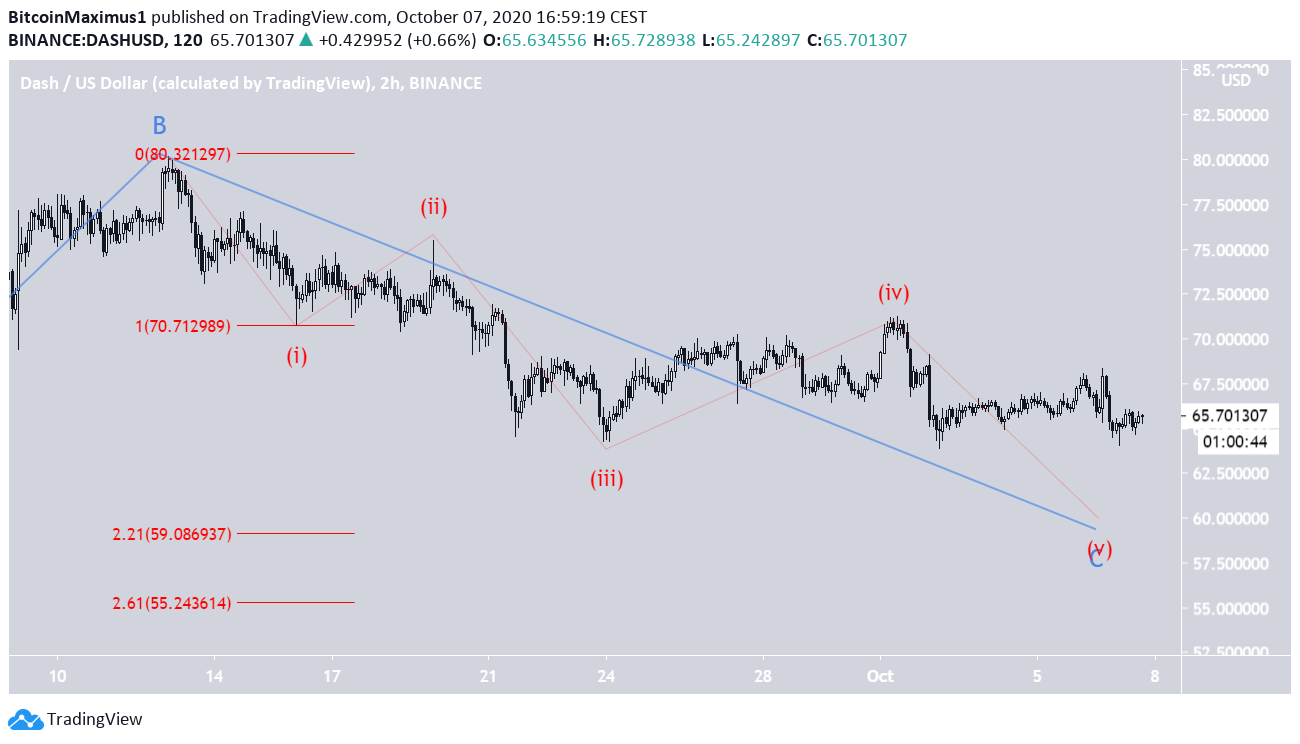
A closer look reveals that the price is likely in the fifth and final sub-wave (red) of wave C, and will eventually begin to increase after completing another lower low.
A likely target for the bottom of this movement would be found between $55.20-$59 the 2.21-2.61 Fib levels of wave 1. The latter target would also coincide with the long-term support level outlined in the first section.
To conclude, until the DASH price breaks out or down from the current pattern, the direction of the future movement cannot be accurately determined due to ambiguous signs.
For BeInCrypto’s latest Bitcoin analysis, click here!
Disclaimer: Cryptocurrency trading carries a high level of risk and may not be suitable for all investors. The views expressed in this article do not reflect those of BeInCrypto.
