


The DASH (DASH) price has been decreasing since reaching a high of $106.36 on Aug 8.
While there are some bullish reversal signs present, the upward trend is not yet confirmed.
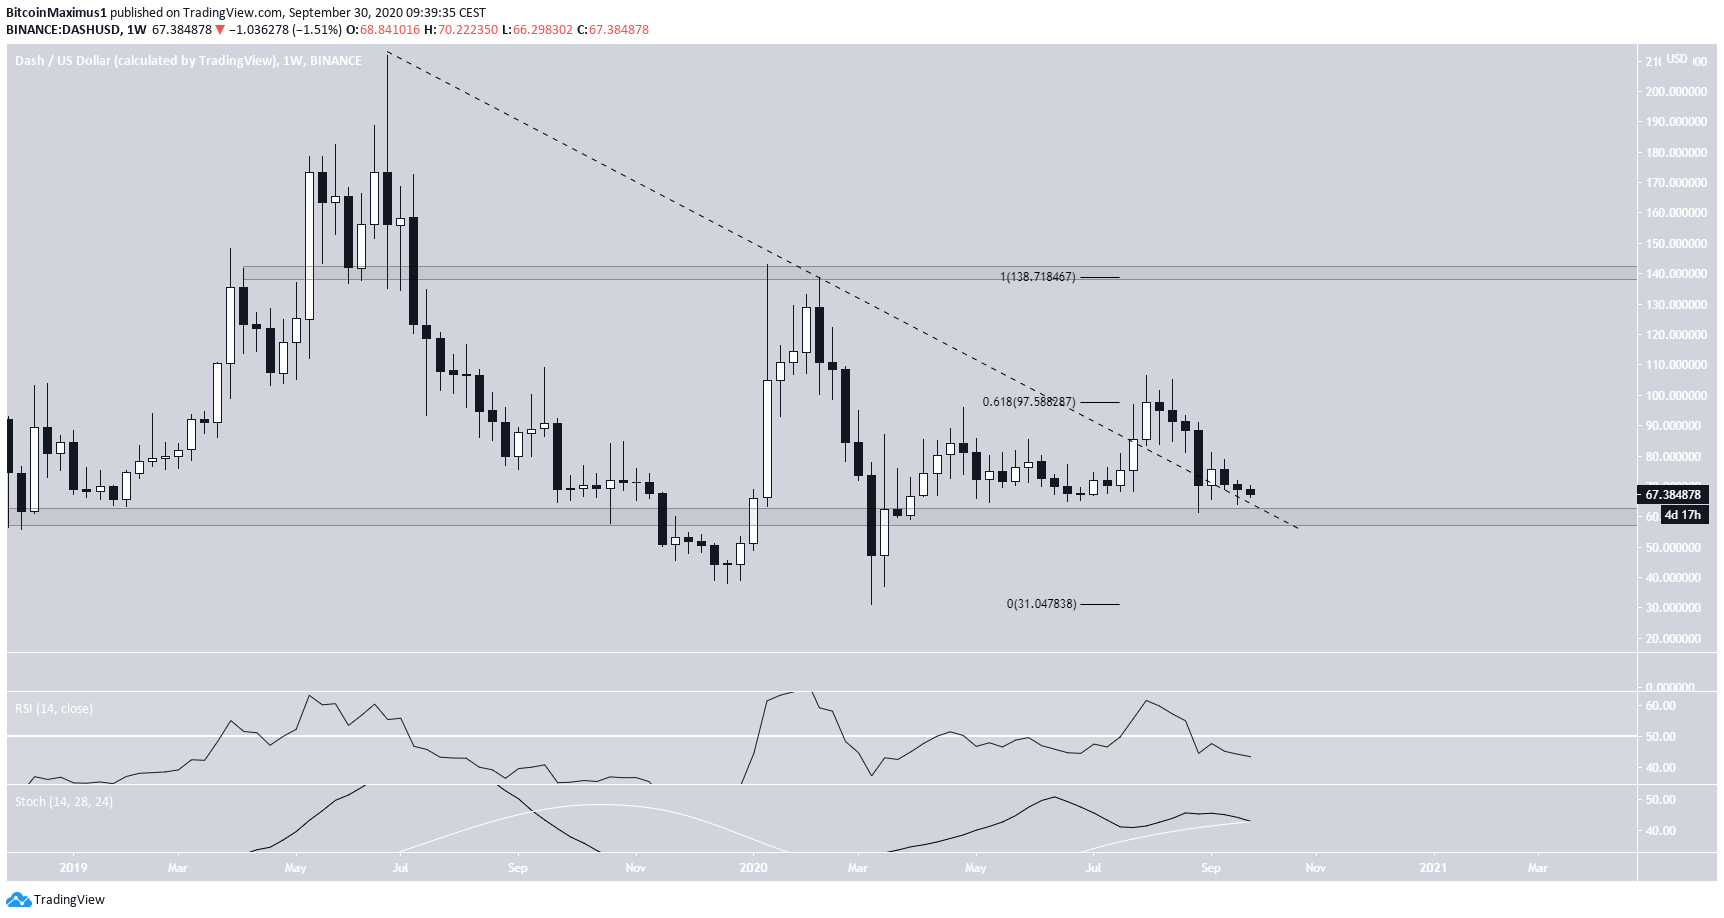
DASH Long-Term Levels
The DASH price has broken out from a long-term descending resistance line which had been in place since May 2019 and has returned to validate it as support.
The main support and resistance levels are found at $60 and $140, with a minor resistance level found at $97.50.
Technical indicators are turning bearish. The RSI has dropped below 50 and the Stochastic Oscillator is in the process of making a bearish cross. A breakdown from the support line would complete the cross, while a bounce would likely reject it.
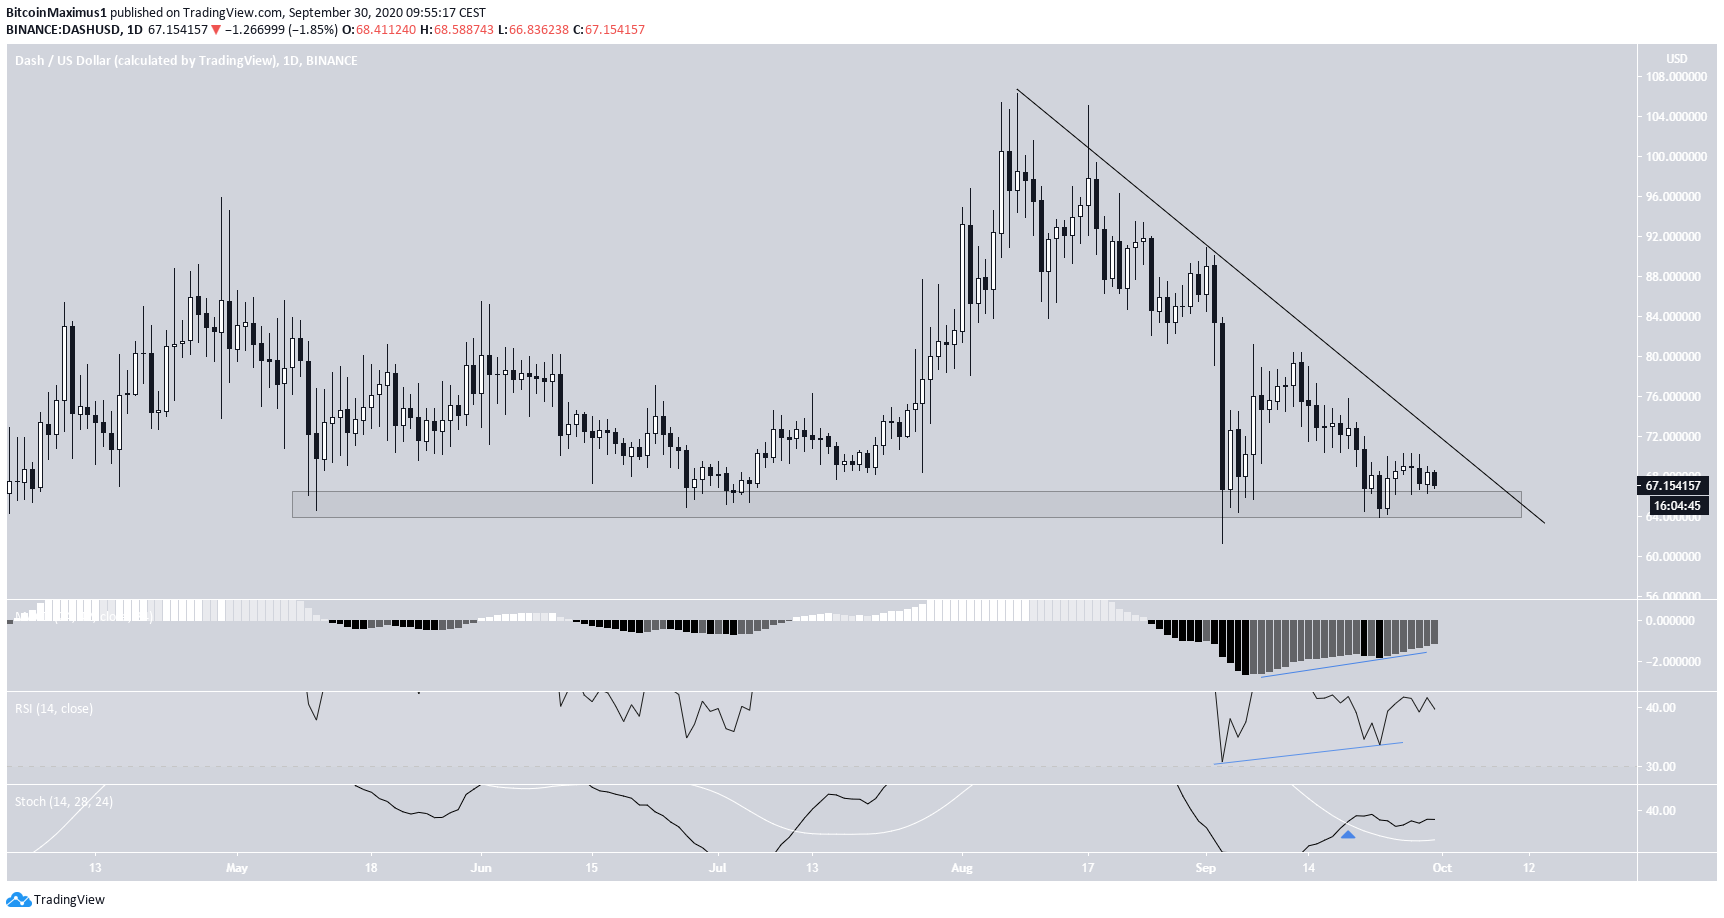
Possible Breakout on the Daily Chart
The daily chart shows another descending resistance line and a minor support level at $65, above which the price is currently trading.
Technical indicators are bullish, suggesting that a breakout is near. There is a bullish divergence in both the RSI and MACD, while the Stochastic Oscillator has made a bullish cross.
If the price breaks out, the $97.50 resistance area outlined in the previous section would be a likely target, with $80 serving as a minor resistance level.
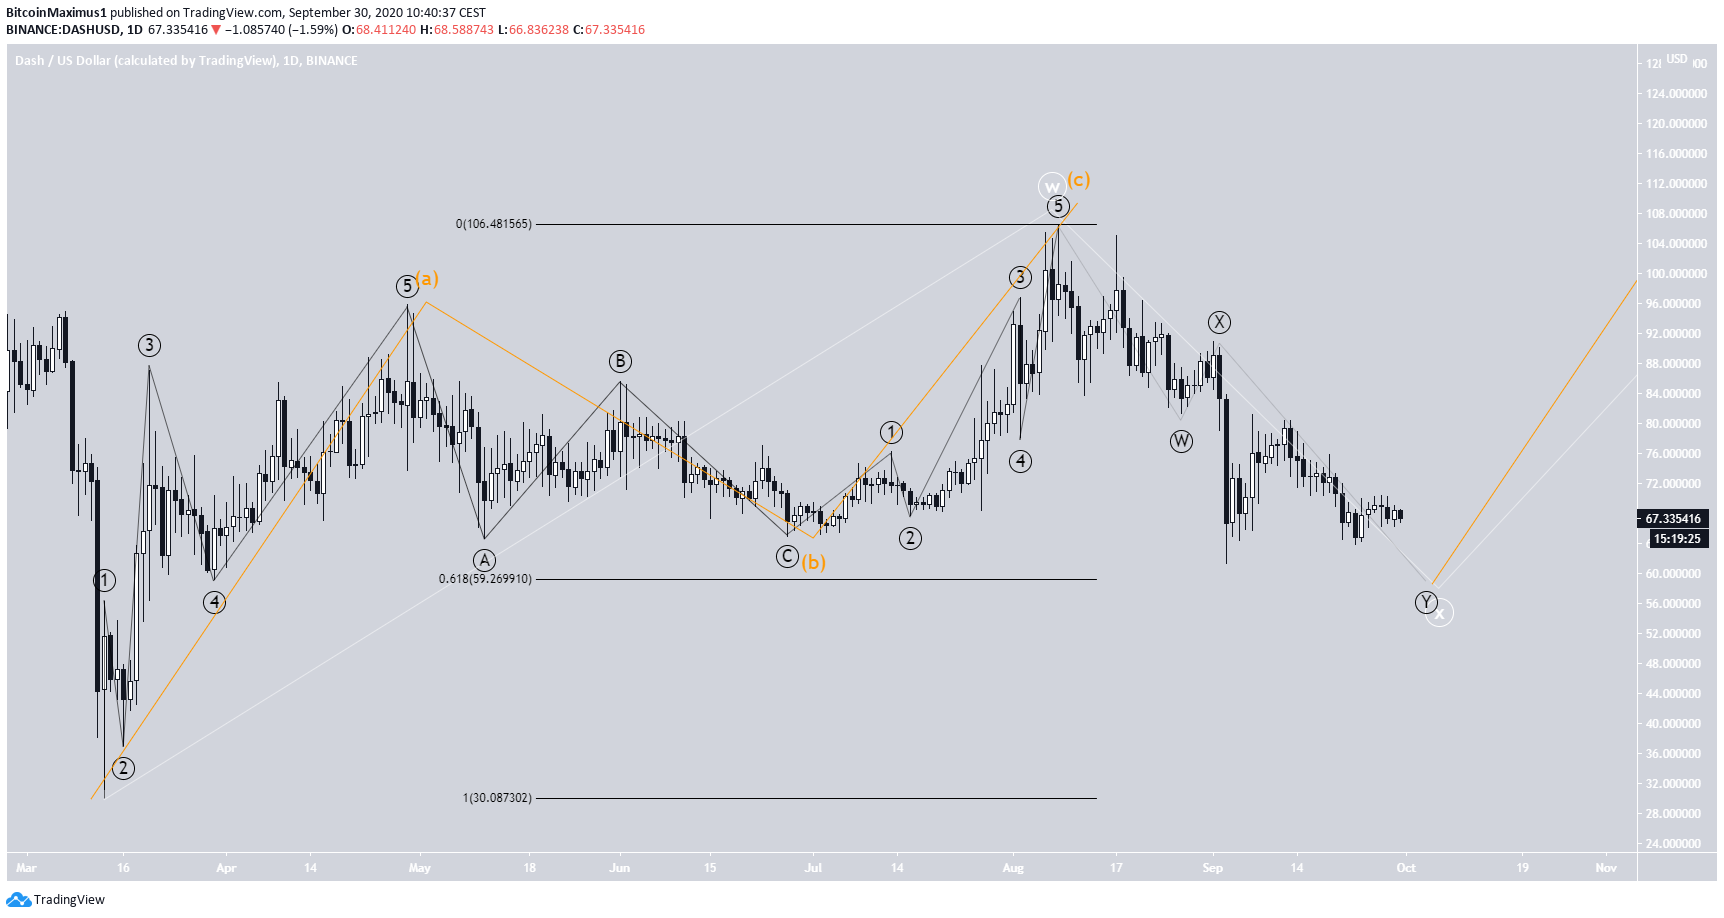
Wave Count
The DASH price is seemingly completing a W-X-Y corrective pattern that began on March 13. So far, the price has completed the W wave (white) and is in the process of completing the X wave.
A likely level for the completion would be at $59, the 0.618 Fib level of the entire upward movement.
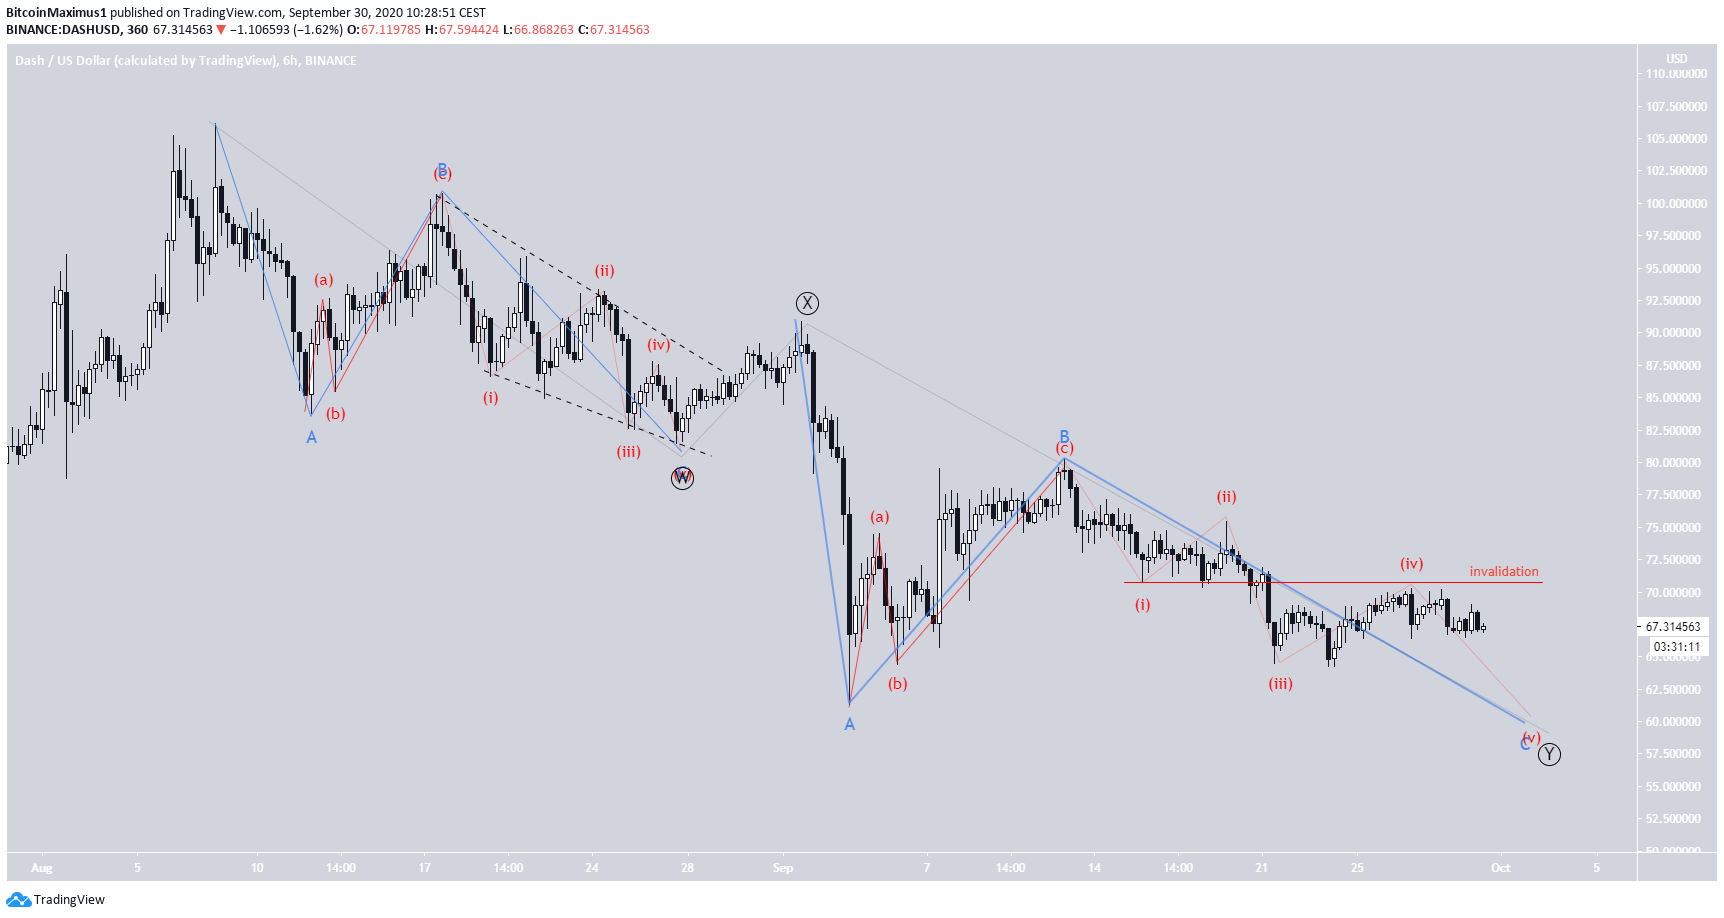
A closer look at the X wave (white in the previous image) reveals that the fifth and final sub-wave is likely to complete the pattern
A breakout above the wave 1 low (red) of $70.79 would invalidate this pattern.
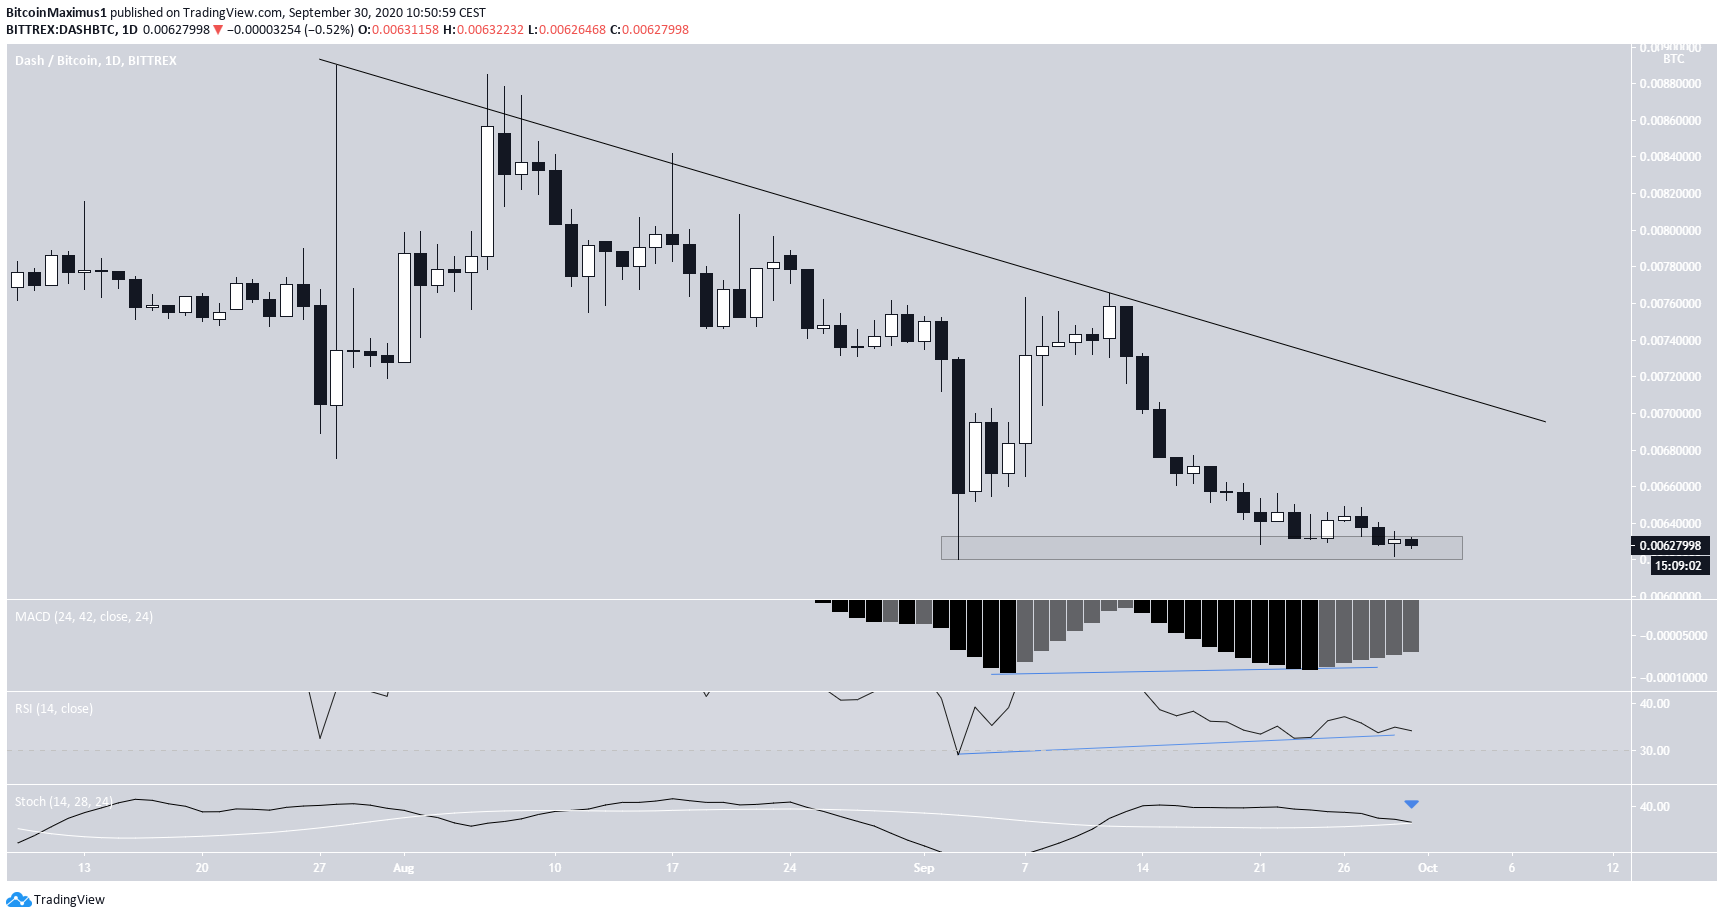
DASH/BTC
The DASH price is currently sitting at support near ₿0.00625 and has been following a descending resistance line since July 27. A breakdown from the current support could take the price all the way back to ₿0.0057.
Technical indicators give ambiguous signs. There is a bullish divergence in both the RSI and MACD, but the Stochastic Oscillator has made a bearish cross.
Therefore, we cannot determine whether DASH will break out from the resistance line or break down from the support area.
For BeInCrypto’s latest Bitcoin (BTC) analysis, click here!


