

The Dash (DASH) price has reclaimed an important support level after briefly deviating below it.
While DASH/USD is expected to increase toward the resistance areas outlined below, the DASH/BTC pair is expected to continue decreasing.
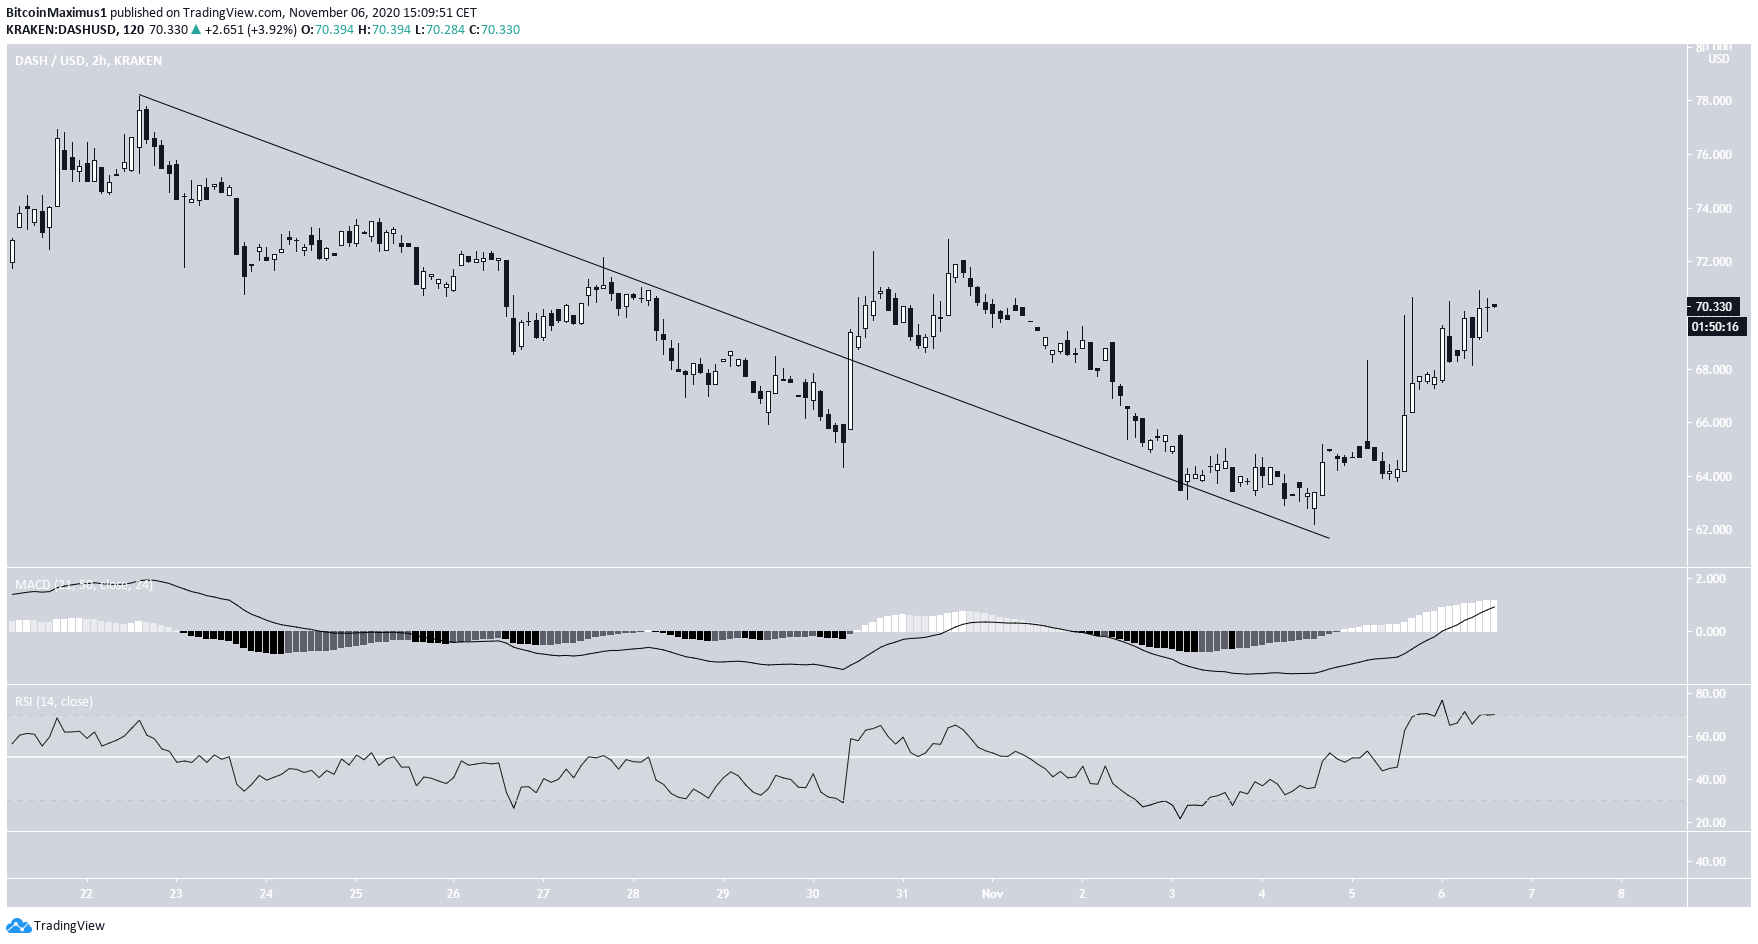
DASH Reclaims Range Low
The DASH price has been trading in a range between $65 and $77 since the beginning of September. On Nov. 4, the price purportedly broke down below the support area, reaching a low of $62.14 only to reclaim the support area shortly afterwards, an occurrence that often leads to a significant move in the other direction. Technical indicators are quite neutral, showing range trading conditions. The RSI is at 50 and the MACD is at the 0 line, while the Stochastic Oscillator is stuck between making or rejecting a bullish cross. Therefore, while it is likely that the price will increase towards the resistance area, a breakout is not certain.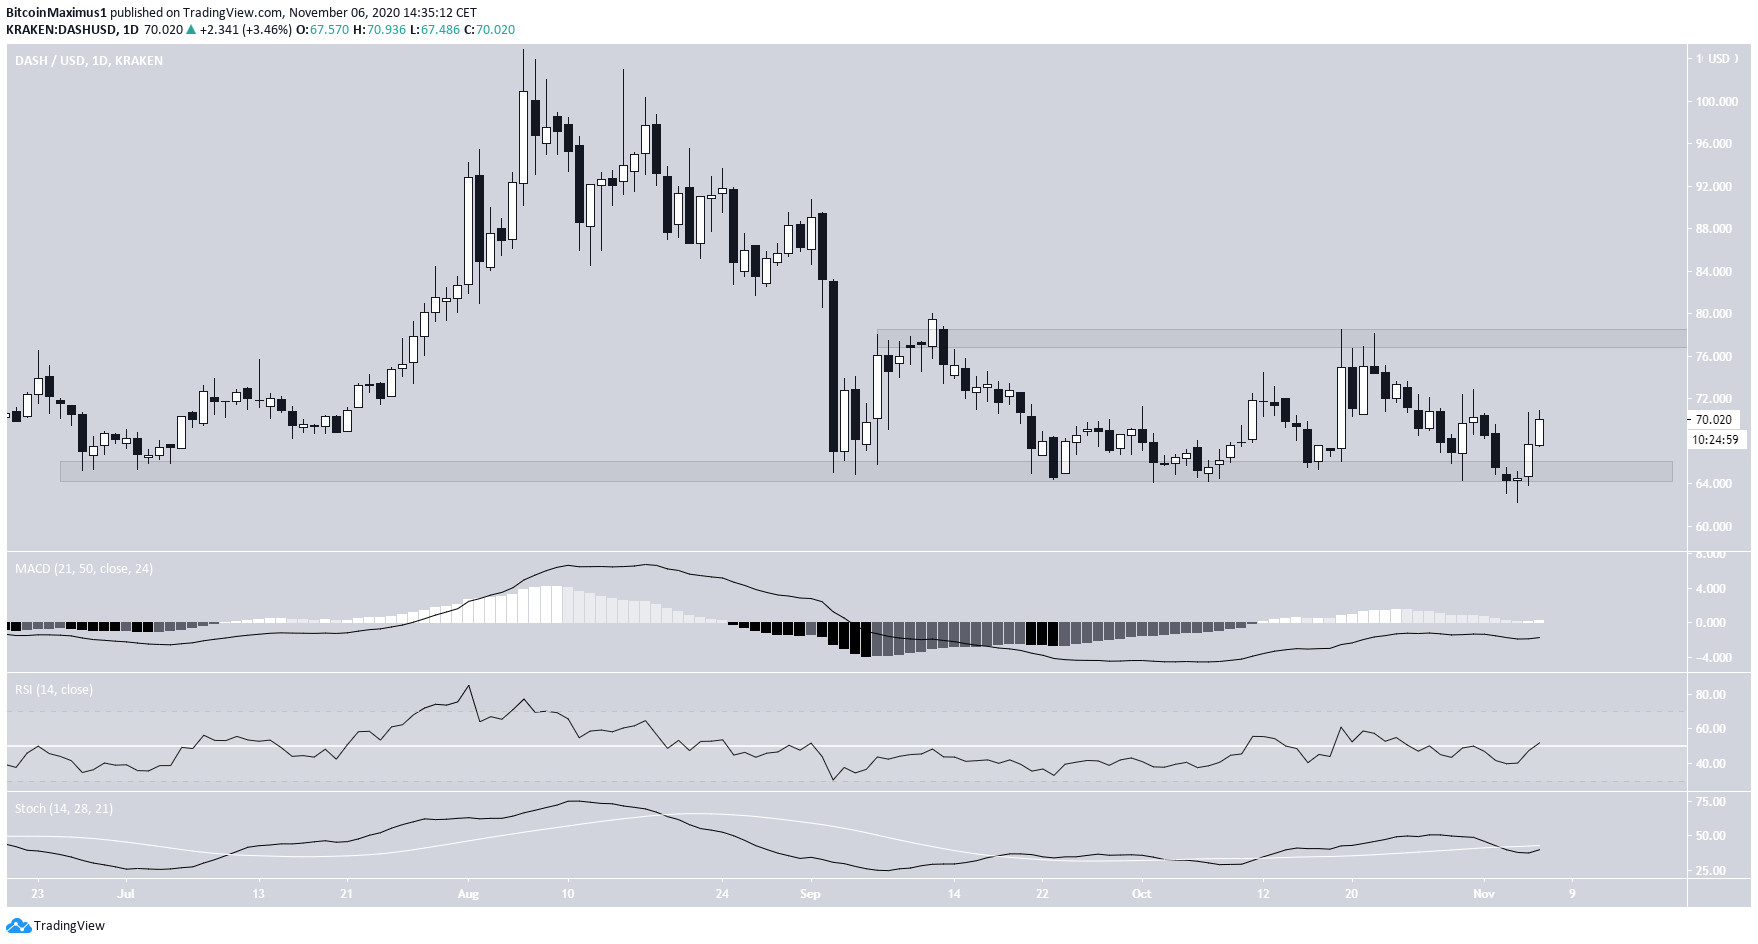
DASH/BTC
Cryptocurrency trader @CryptoDonAlt tweeted a DASH/BTC chart, stating that the price has reached the capitulation phase and shows no signs of a bullish reversal.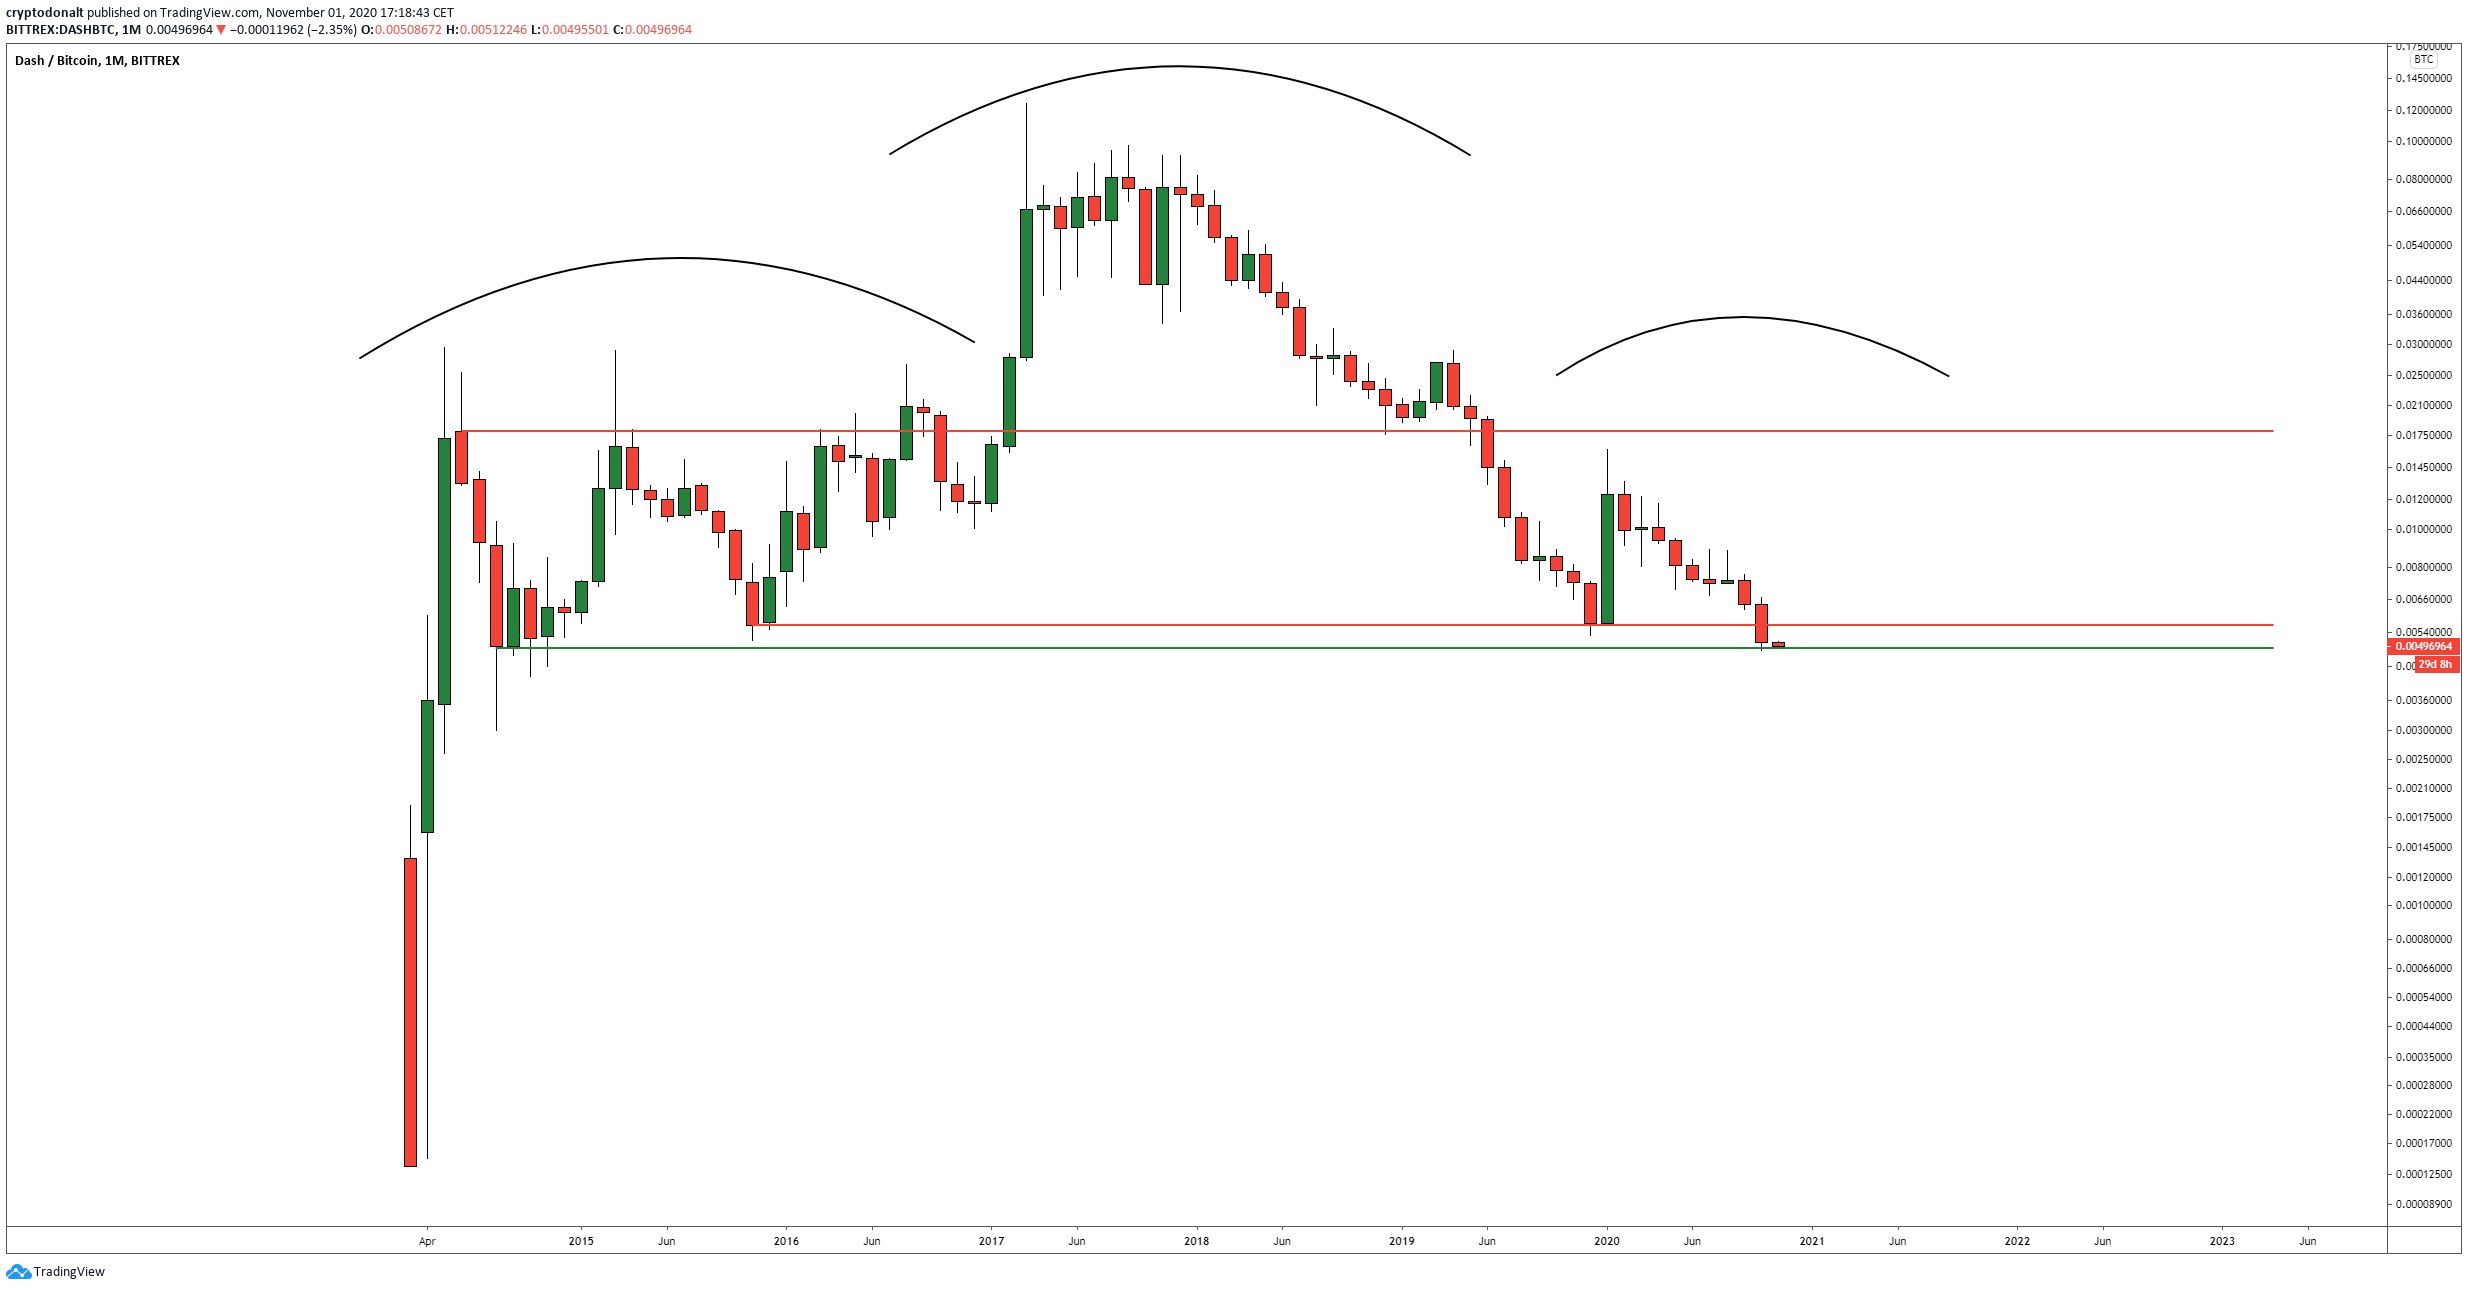
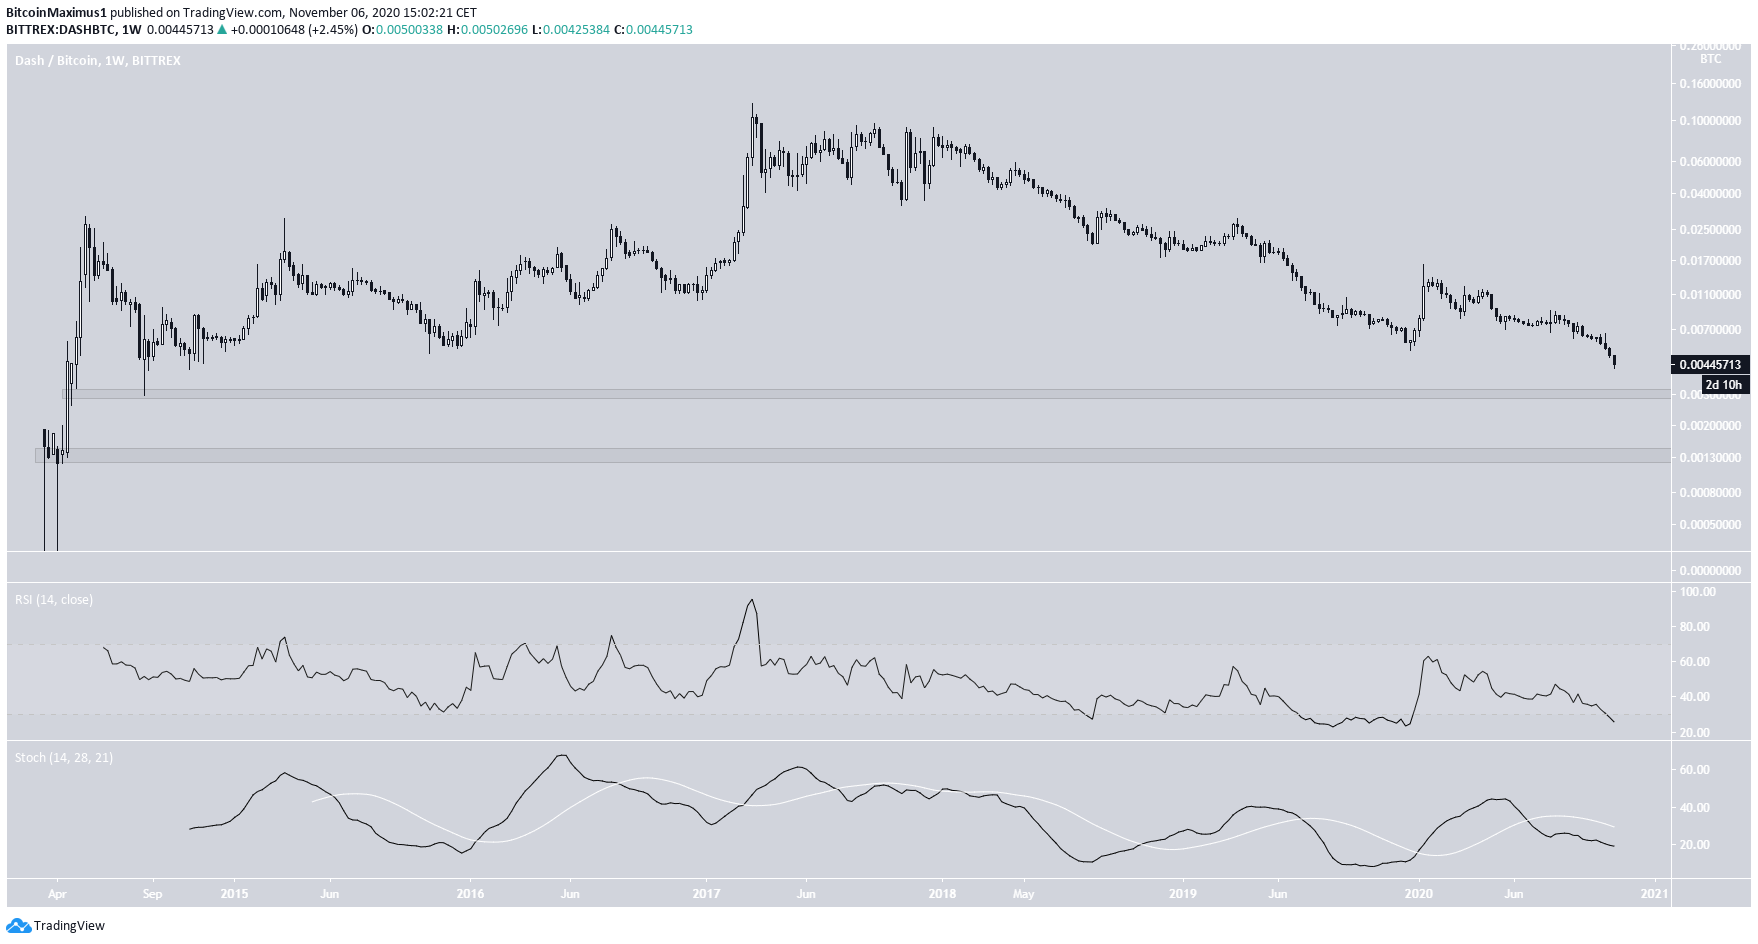
Conclusion
While the DASH/USD pair is trading in a range and heading towards the closest resistance at $77, the DASH/BTC pair has capitulated and is struggling to find support. For BeInCrypto’s previous Bitcoin analysis, click here! Disclaimer: Cryptocurrency trading carries a high level of risk and may not be suitable for all investors. The views expressed in this article do not reflect those of BeInCrypto.Disclaimer
In line with the Trust Project guidelines, this price analysis article is for informational purposes only and should not be considered financial or investment advice. BeInCrypto is committed to accurate, unbiased reporting, but market conditions are subject to change without notice. Always conduct your own research and consult with a professional before making any financial decisions. Please note that our Terms and Conditions, Privacy Policy, and Disclaimers have been updated.

Valdrin Tahiri
Valdrin discovered cryptocurrencies while he was getting his MSc in Financial Markets from the Barcelona School of Economics. Shortly after graduating, he began writing for several different cryptocurrency related websites as a freelancer before eventually taking on the role of BeInCrypto's Senior Analyst.
(I do not have a discord and will not contact you first there. Beware of scammers)
READ FULL BIO
Sponsored
Sponsored