


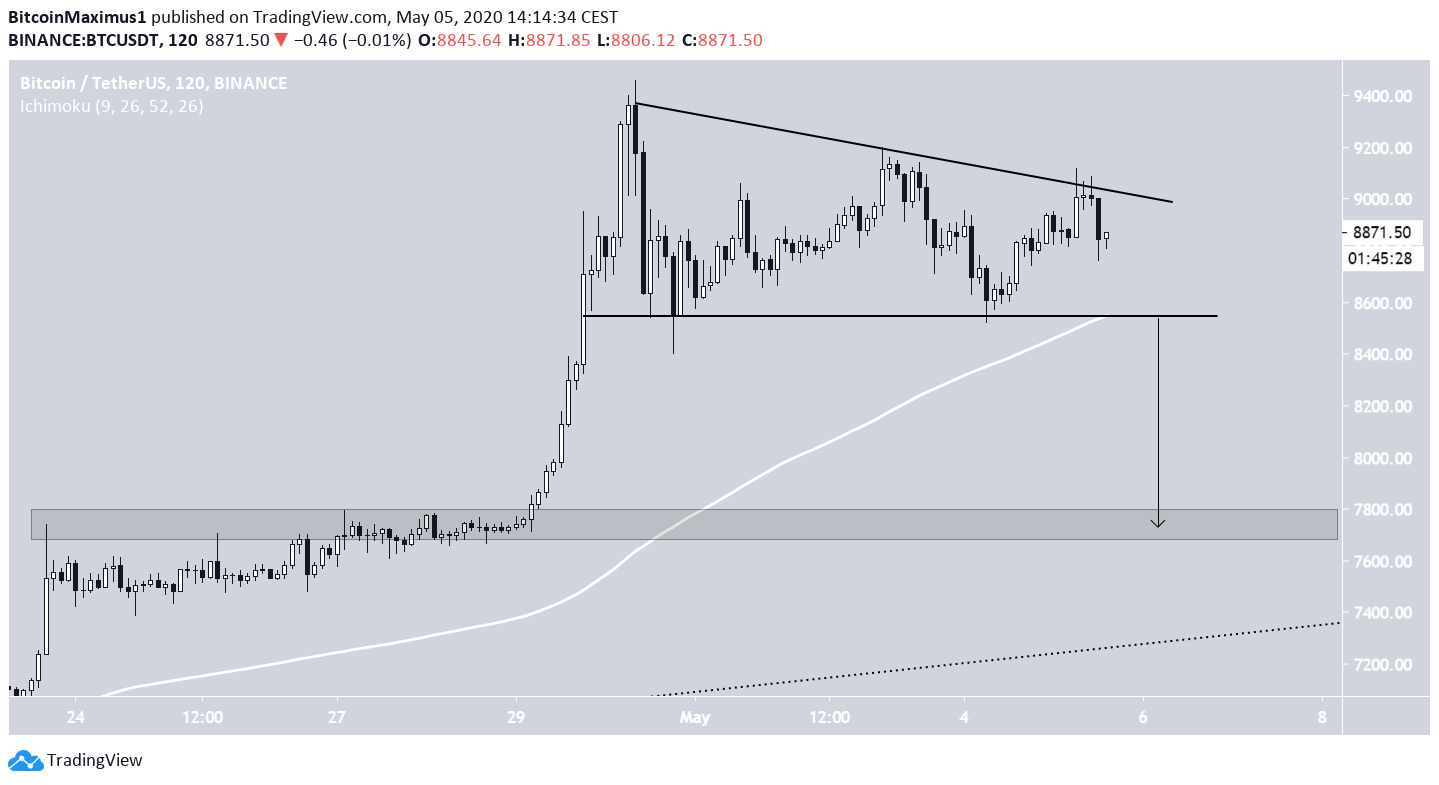
The Bitcoin price has been decreasing inside a bearish pattern since April 30. At the time of writing, the price was trading near $8,900.
With the third BTC halving projected to occur on May 12, Google search interest for the event is at an all-time high, a value more than four times the previous all-time high. In yet more positive news, the launch of Ethereum 2.0 could come sooner than expected, with a new report stating that it might be launched in July.
Bitcoin (BTC)
The Bitcoin price has been trading inside a descending triangle since it reached a high of $9,460 on April 30. Until now, the price has reached two lower highs and is in the process of moving towards the support line at $8,550.
The descending triangle is a bearish pattern, so a breakdown from the triangle would be expected. This is strengthened by the fact that the price is trading very close to a long-term resistance area. If the price loses the possible support of the 200-hour MA (white), the rate of decrease is likely to accelerate.
A target for the breakdown would be the closest support area at $7,750.
Ethereum (ETH)
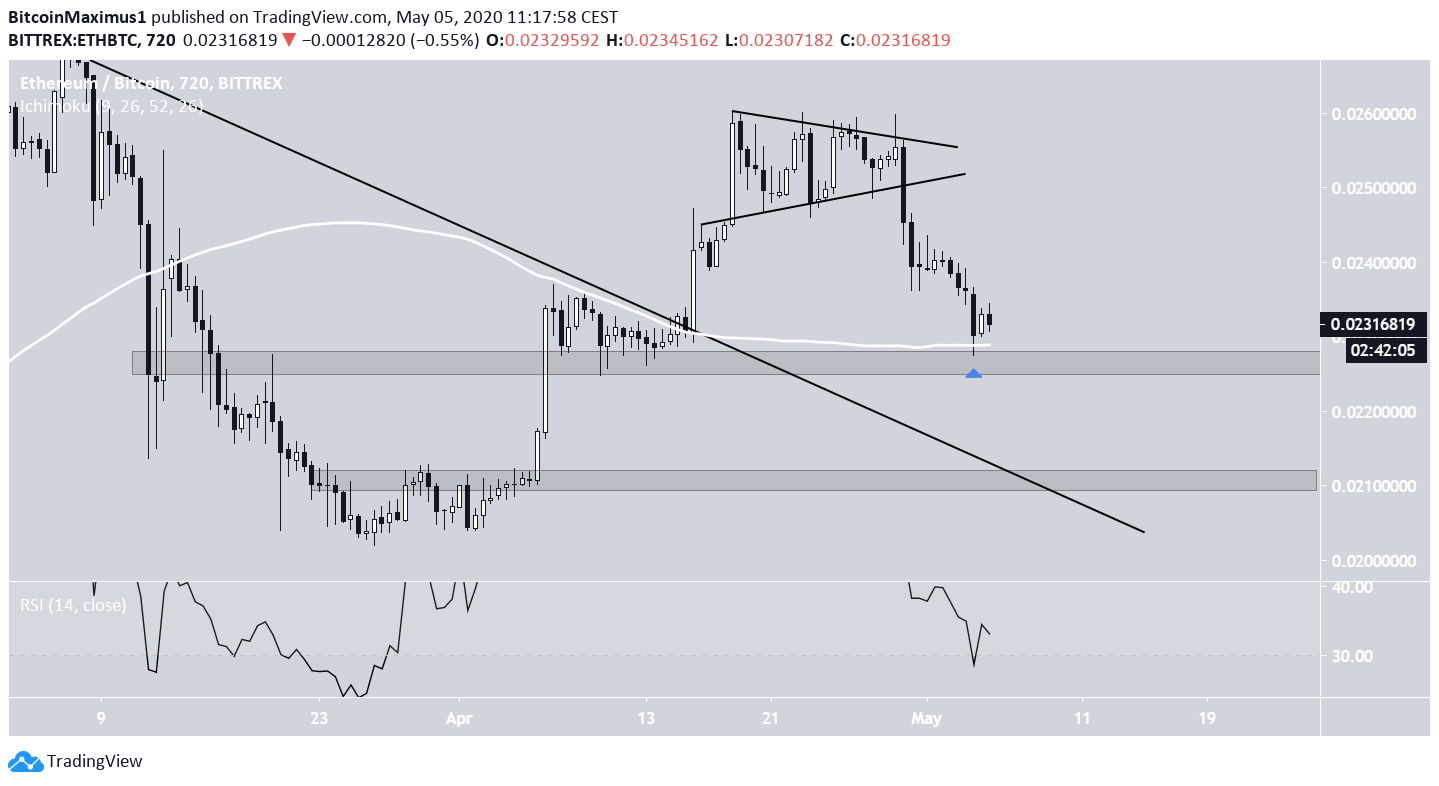
On April 30, the Ethereum price broke down from a symmetrical triangle and has been decreasing since. At the time of writing, it was trading slightly above the ₿0.023 support area. This area is also strengthened by the presence of the 50-day MA, which has previously acted as resistance and has now turned to support.
While the price could initiate a bounce at the current level, there is no bullish divergence in the RSI to confirm this movement — even if the RSI has fallen deep into oversold territory. Therefore, while a short-term upward move is likely to occur, it is not certain that the price will begin a reversal at the current level.
If the price continues to decrease, it is likely to find support at ₿0.021, possibly validating the previous long-term descending resistance line from which it has broken out.
XRP (XRP)
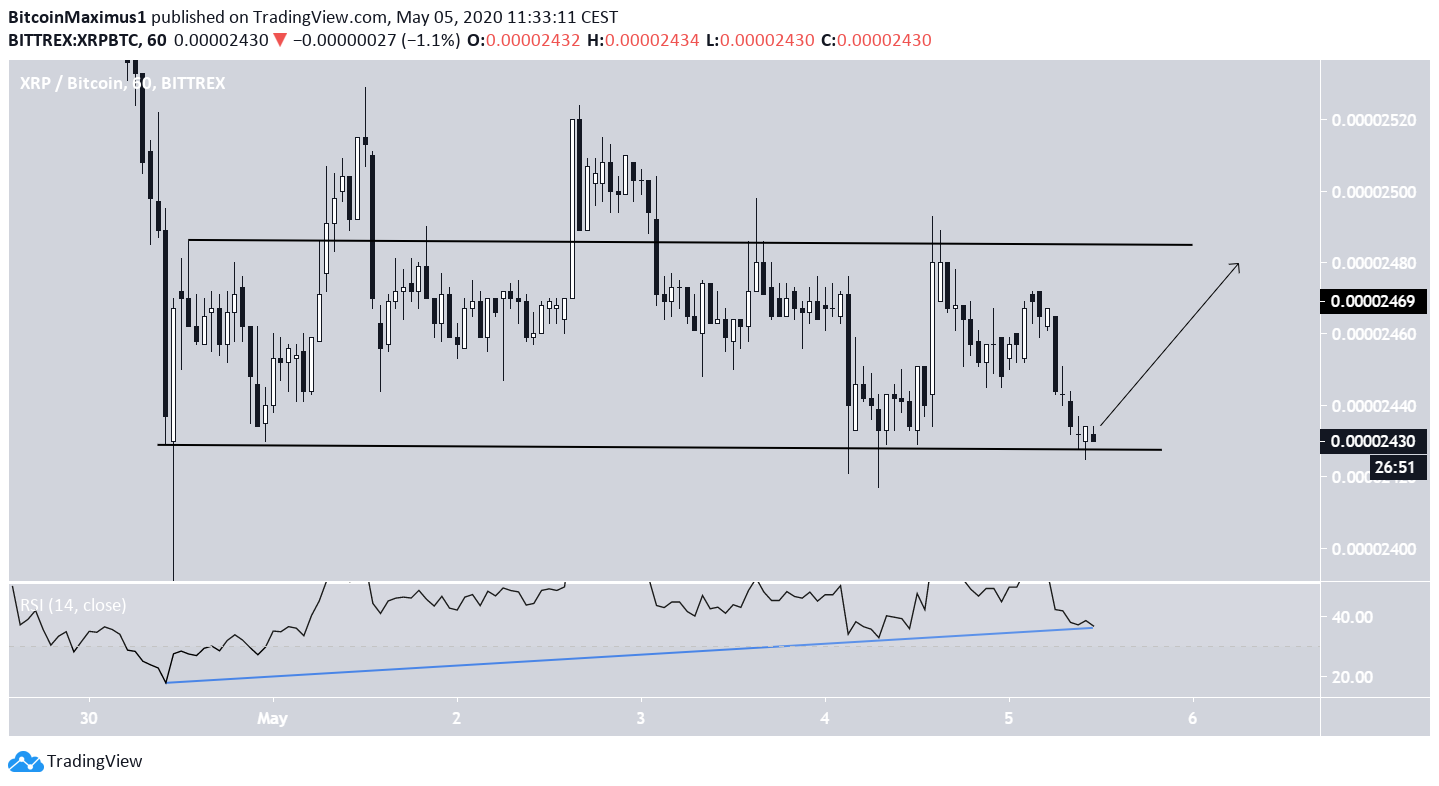
The XRP price is trading inside a very short-term range of 2,430-2,490 satoshis. While the price has made two failed attempts at breaking out, the support line has been intact throughout this range.
The hourly RSI has been generating significant bullish divergence, which suggests that the price is likely to move upwards towards the top of the range at 2,490 satoshis. This possibility is also strengthened by the fact that XRP is resting above long-term support.
Bitcoin Cash (BCH)
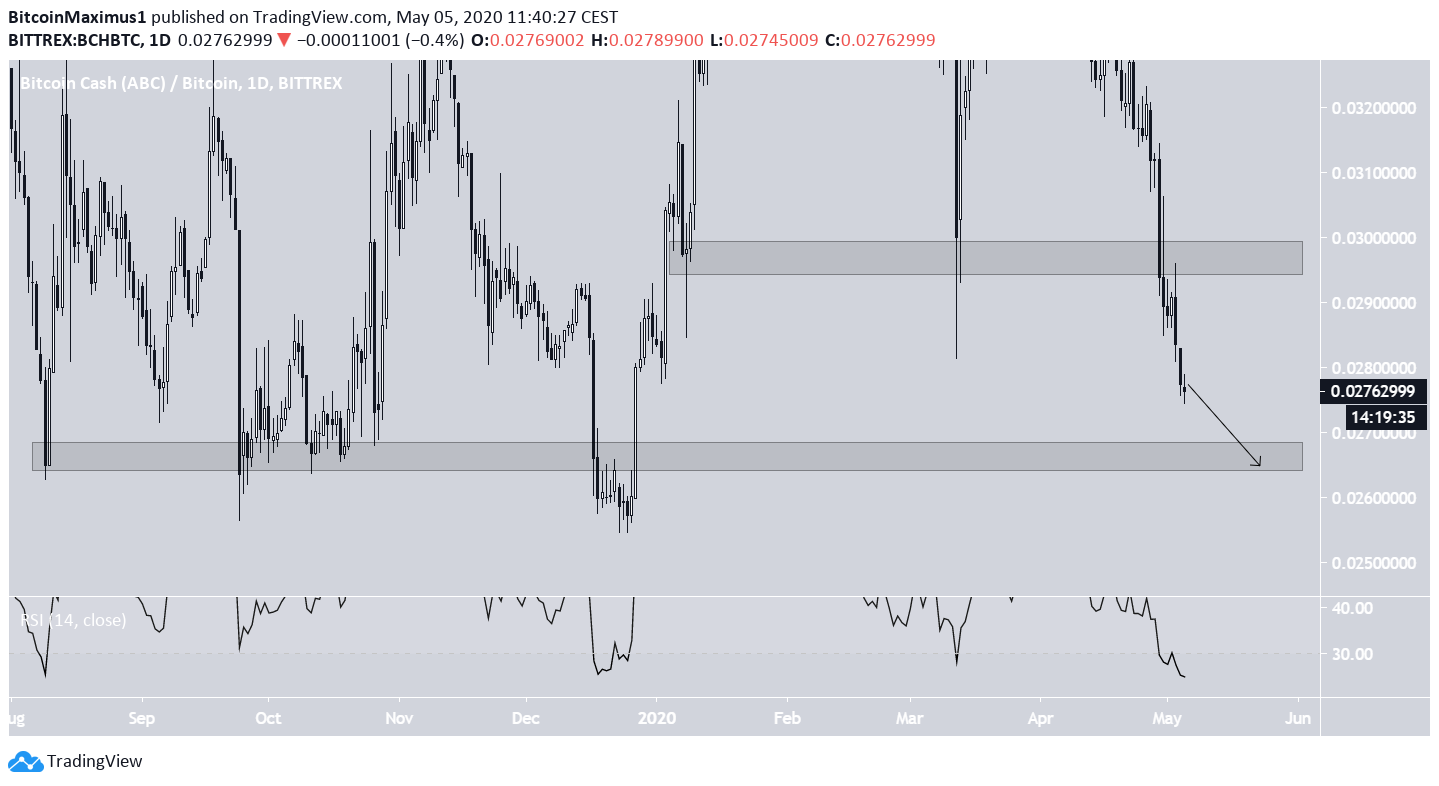
On April 30, the BCH price broke down from a significant support area found at ₿0.0295. The price validated it as resistance the next day and has been decreasing since. The loss of this support area is a considerably bearish development, since the price had not firmly traded below it since January.
The closest support area is found at ₿0.0265, a long-term area that has held since August 2019, with the exception of a two week period in December 2019. While the RSI is deep into oversold territory, it has yet to generate any trace of bullish divergence. Therefore, the price is expected to continue decreasing until it reaches this support area.
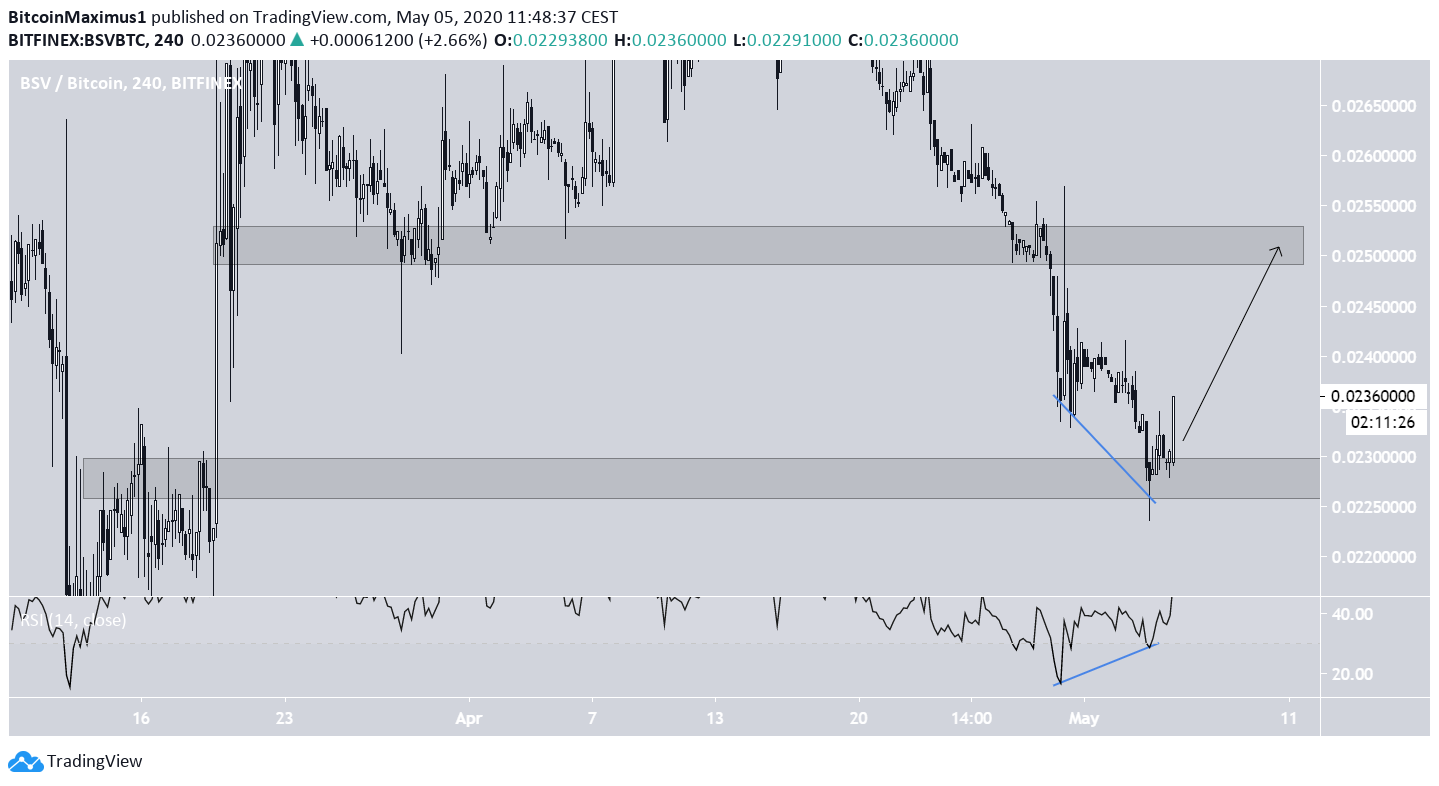
Bitcoin SV (BSV)
On April 30, the Bitcoin price broke down from the ₿0.025 support area and greatly accelerated its rate of decrease. It reached the next support area at ₿0.0227 after three days and has been trading close to that level since.
The price is expected to bounce at this support level and head towards the previous support area at ₿0.025. This movement is likely to be a validation of that area as resistance, one which is followed by a downward move.
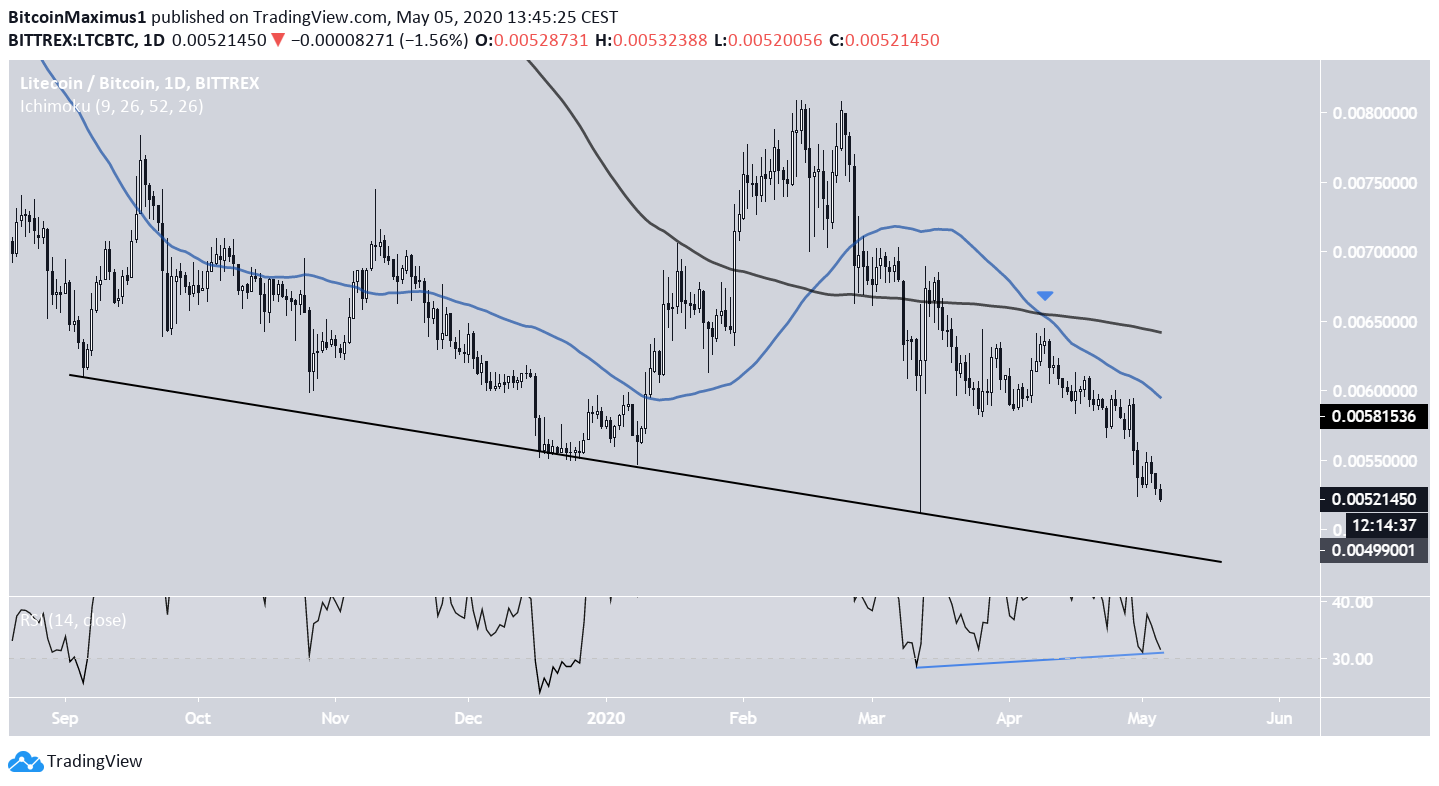
Litecoin (LTC)
The Litecoin price reached a high of 0.0081 on Feb. 14 and has been decreasing since. The rate of decrease accelerated in the beginning of March. In addition, LTC has been following a descending support line since September 2019, having touched it four times until now.
The price is expected to decrease until it reaches this support line once more. This is supported by the bearish cross between the 50- and 200-day MAs, the former of which is providing close resistance to the price.
However, the daily RSI has generated significant bullish divergence, a sign that the price might bounce once it reaches this support line.
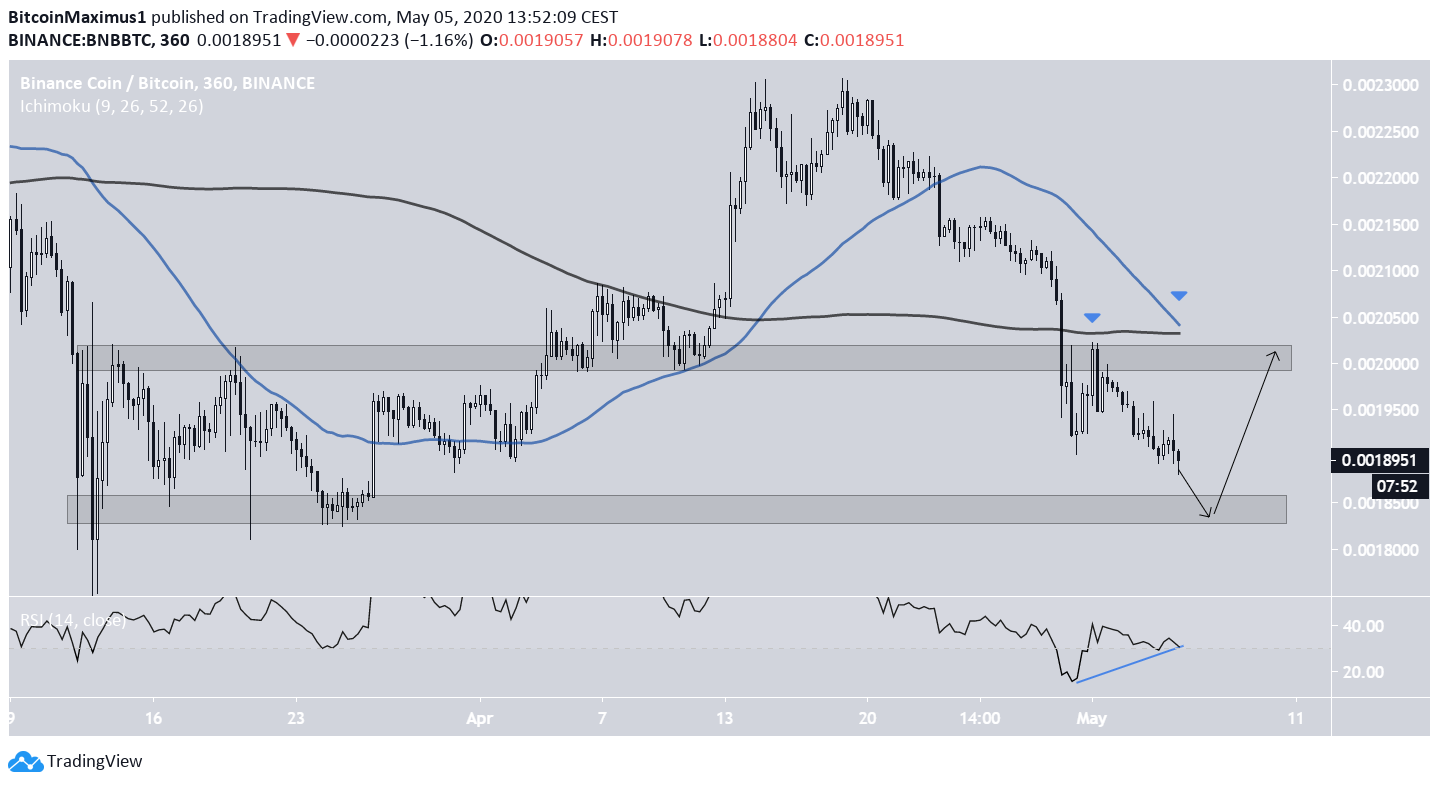
Binance Coin (BNB)
Binance Coin has been decreasing since April 19, when it reached a high of ₿0.00230. On April 29, the rate of decrease accelerated and the price fell below the ₿0.0020 support area. It validated it as resistance three days afterwards.
The next closest support area is found at ₿0.00185. The price is expected to reach it and initiate an upward move towards the support area it previously broke down from. This is supported by the growing bullish divergence in the RSI.
However, the 50- and 200-period MAs are very close to making a bearish cross and could provide strong resistance to the price in the future. Therefore, the chances for an upward move above ₿0.0020 seem quite low.
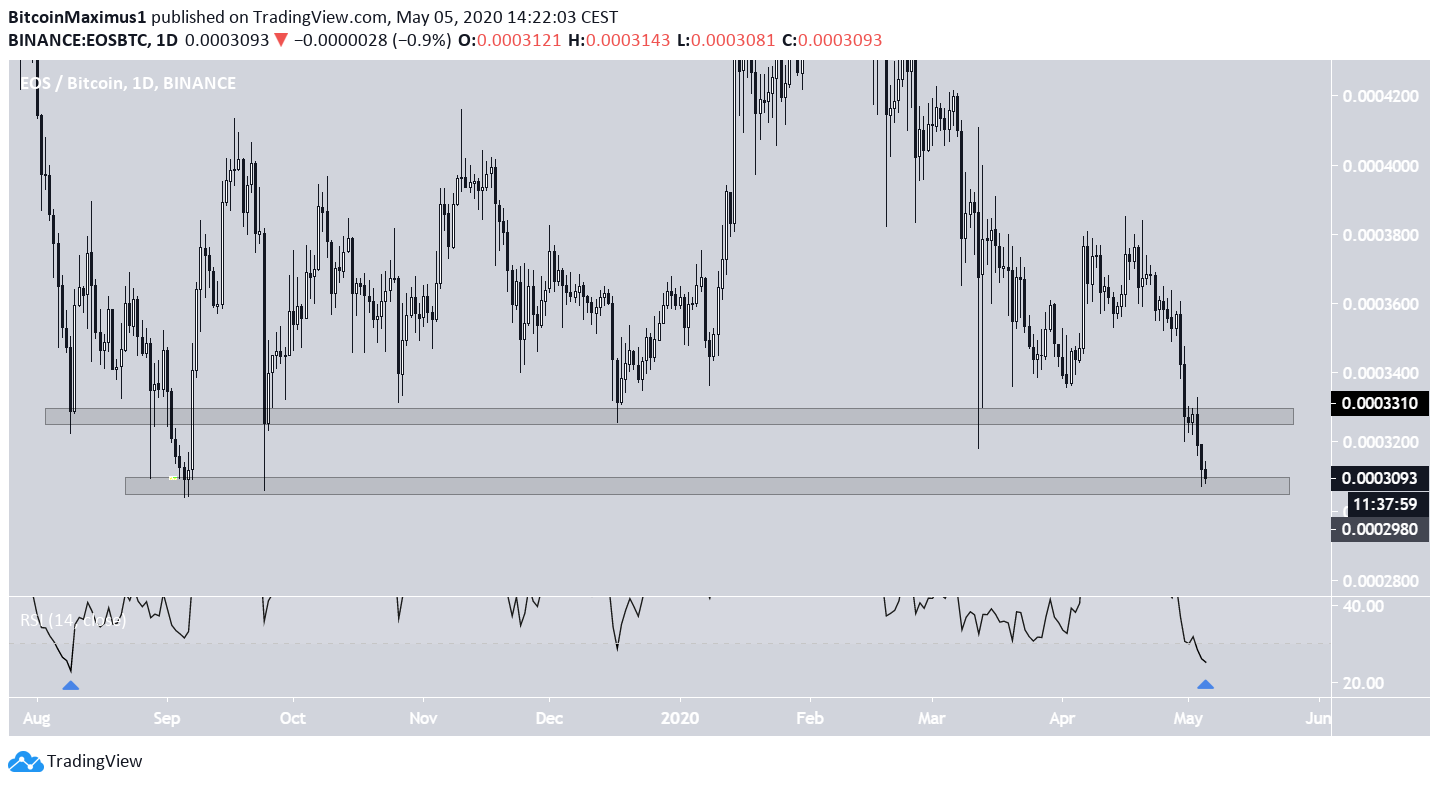
EOS (EOS)
On April 30, the EOS price broke down below its 33,000 satoshi support area, which had been providing support since September 2019. It validated the area as resistance and has been decreasing since.
The EOS price is currently trading inside the 30,000 satoshi support area, one below which it has not traded since 2017.
The daily RSI is extremely oversold but has not generated any type of bullish divergence yet. However, the last time it was this oversold, it initiated a rapid upward move. Therefore, an upward move is expected that takes the price at least to the 33,000 satoshi area.
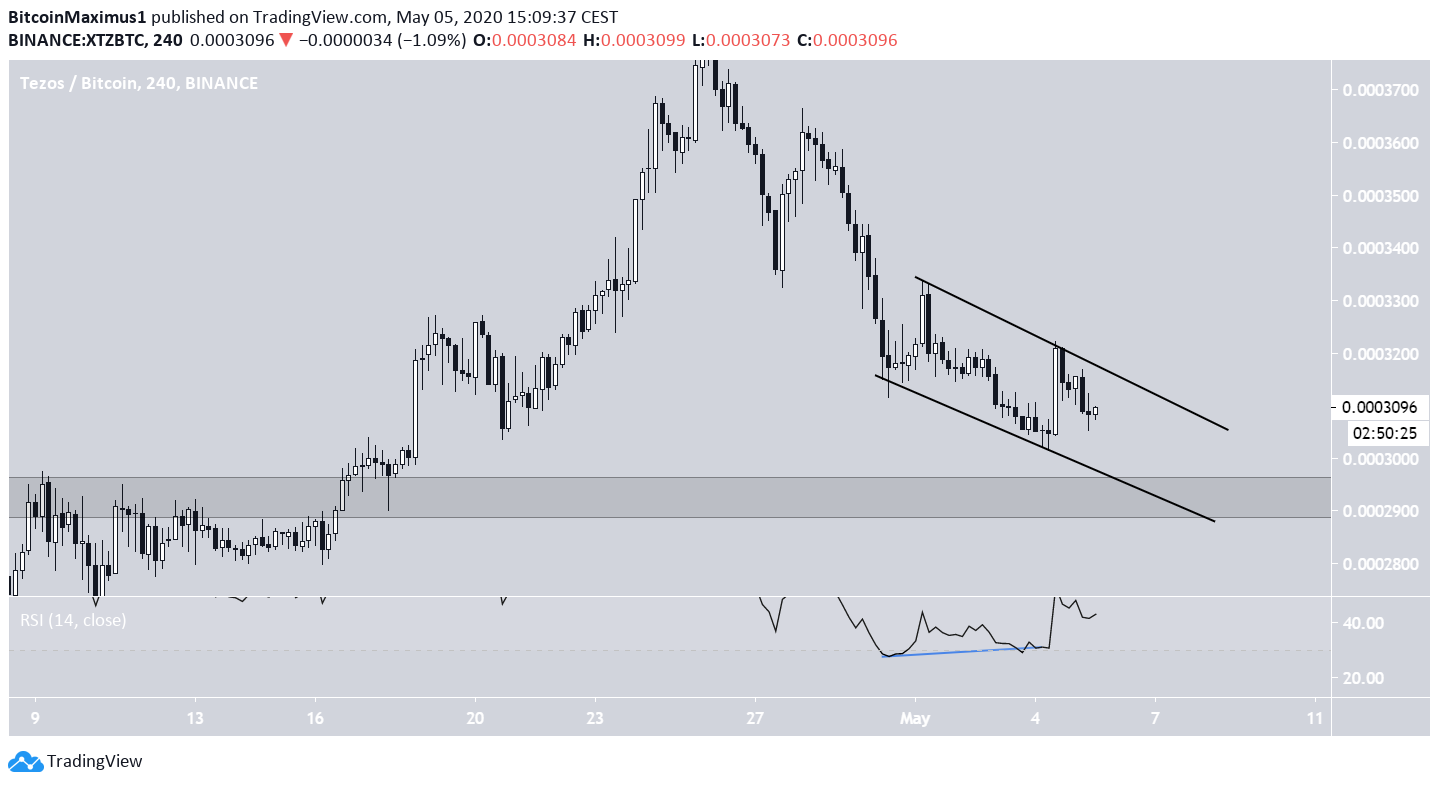
Tezos (XTZ)
The XTZ price has been decreasing since May 1, when it reached a high of 33,380 satoshis. The decrease has taken the shape of a descending channel. At the time of writing, the price was rejected from the resistance line and moving towards the support line of this channel.
Since the support line is descending, it will soon coincide with the major support area found at 27,500 satoshis. When combining this with the ongoing bullish divergence, it is likely that the price will break out from this channel, possibly after reaching the confluence of the support line and the support area.
If it breaks out, the closest resistance area would be found at 33,000 satoshis, the level from which the descending channel began.
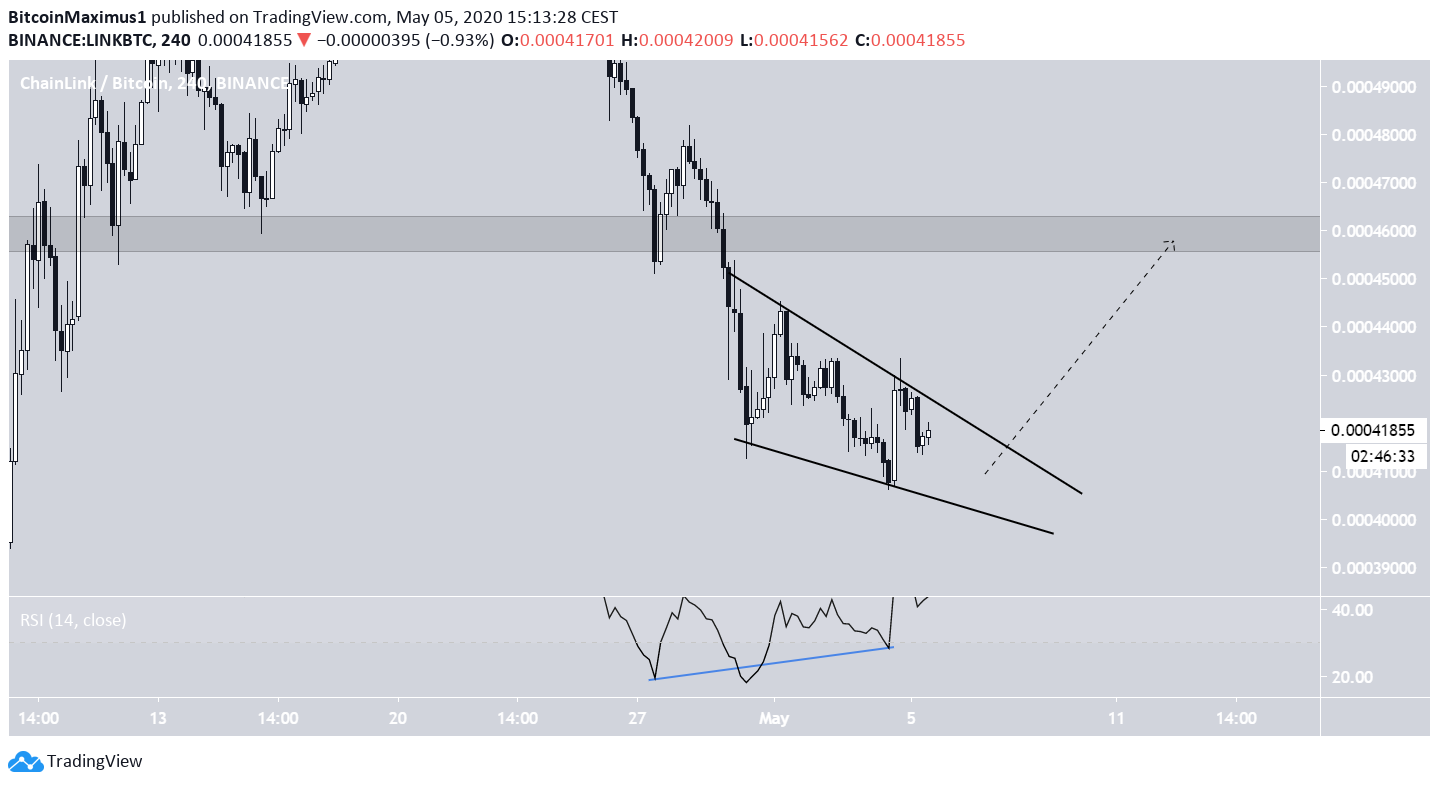
Chainlink (LINK)
On April 27, the LINK price bounced at the 46,000 satoshi support area. However, the bounce was weak, and the price fell below this support level two days later. Since then, the price has been trading inside a descending wedge, which is known as a bullish reversal pattern.
In addition, the RSI has generated significant bullish divergence, a sign that the price is likely to break out. If that occurs, the price is expected to reach the 46,000 satoshi area once more.
The next closest support level is found at 37,000 satoshis.
Afterwards, it is likely to decrease until 37,000 satoshis, a major support area strengthened by the presence of the 200-day MA.


