

During the week of April 20-27, the Bitcoin (BTC) price created its sixth successive bullish weekly candlestick.
The price increased from a low of $6,751 to a high of $7,738 before reaching a close at $7,693, very close to the weekly high. Altcoins mostly followed the price of BTC, with ETH increasing at a faster rate and reaching $200, albeit for a very short period of time.
In this article, we will take a look at the price movement for 10 cryptocurrencies and analyze their future outlook.
Bitcoin (BTC)
The Bitcoin price is trading inside an ascending channel and has been doing so since April 23. Both the resistance and support lines have been validated numerous times. At the time of writing, the price was trading right in the middle of this channel. In addition, the price is trading above the 50-hour moving average (MA), which has previously made a bullish cross with the 200-hour MA, otherwise known as a golden cross. This cross makes it more likely that the price will break out eventually. This is also supported by the hourly RSI, which has reached the 50-line from above, a very likely level for a bounce. If the price breaks out, it could go as high as $8,000.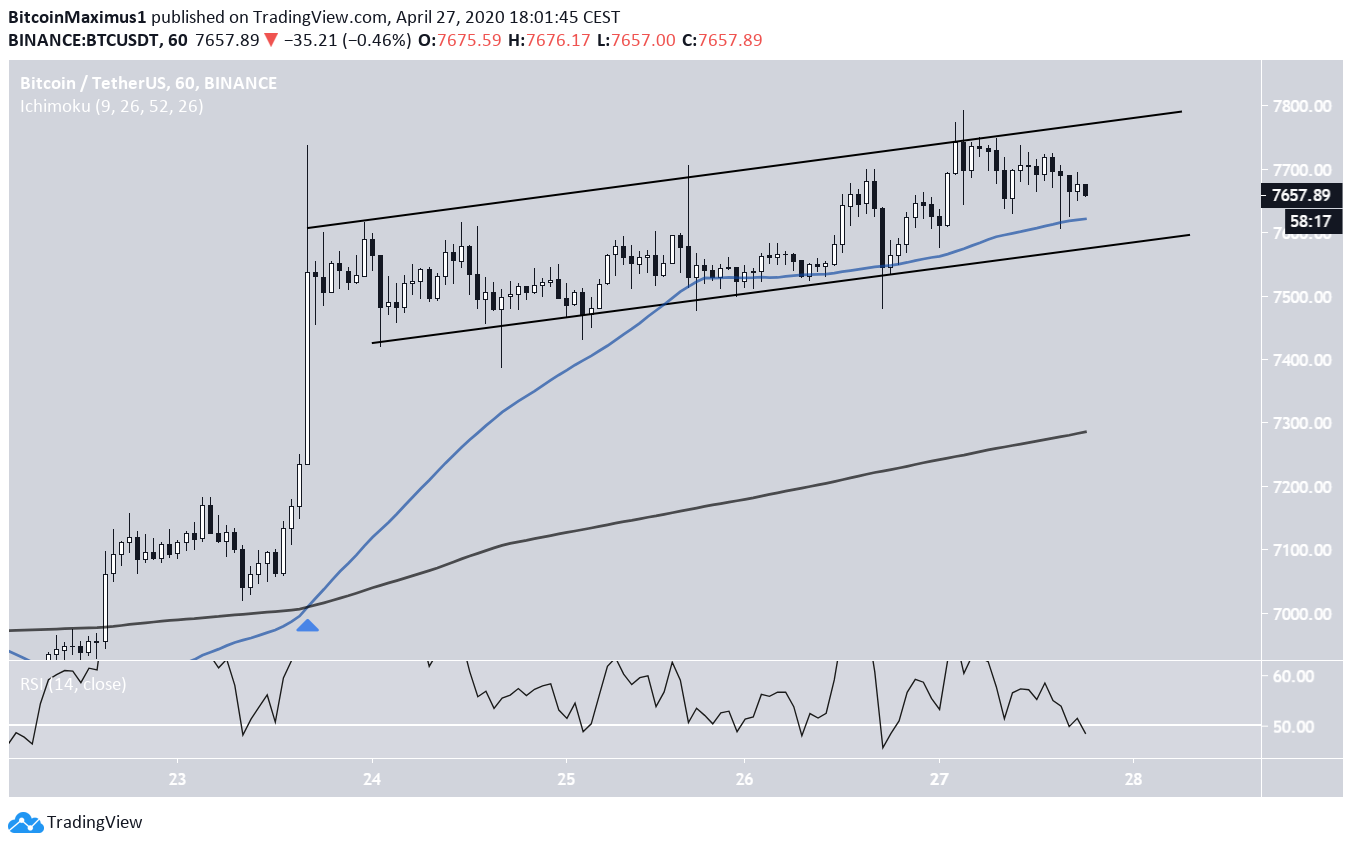
Ethereum (ETH)
The Ethereum price has been trading inside an ascending wedge since it reached a bottom on March 13 and has validated both the resistance and support lines numerous times. The wedge is considered a bearish pattern, making a breakdown more likely. At the time of writing, the price was trading right at this resistance line. In addition, it is quickly approaching the closest resistance area, which is found at $205. The confluence of these resistances would offer a likely level for a reversal. Technical indicators are mixed. On one hand, there is bearish divergence in the RSI, which suggests that a breakdown is likely. On the other hand, the 50- and 200-period MAs have made a bullish cross, a sign that the price will move upwards. Therefore, the expected movement would be a continued increase at the rate predicted by the channel, followed by an eventual breakdown.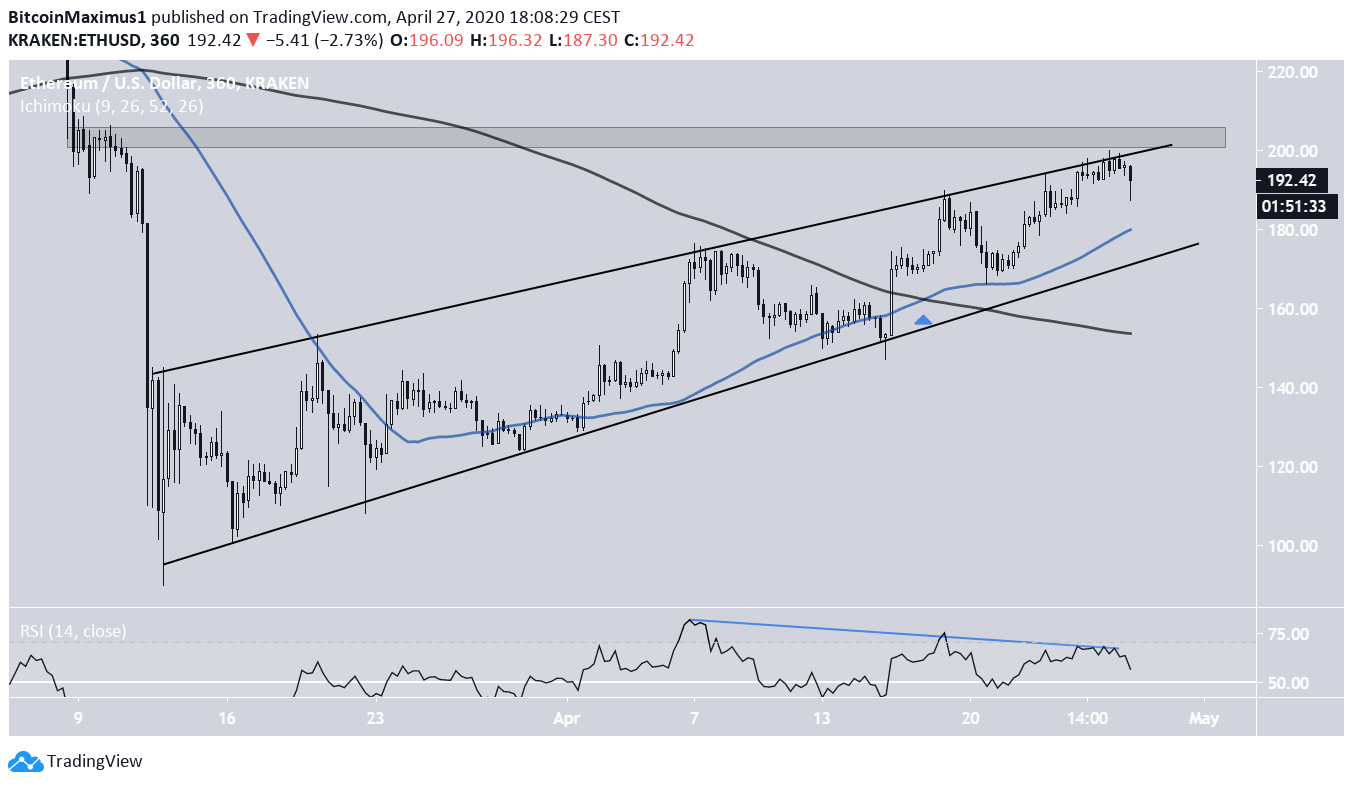
XRP (XRP)
The XRP price has followed an ascending resistance line since April 13. At the time of writing, it was trading right at this resistance line, having validated it for the fifth time. In addition, the RSI has generated significant bearish divergence, increasing the possibility that the price will head downwards towards the support line. However, the slope of the support line is not clear, due to the presence of long lower wicks and the fact that it has only been validated twice. Therefore, the price is either trading inside an ascending wedge or channel. In both cases, the price is expected to decrease towards this line, which is either at $0.186 or $0.181.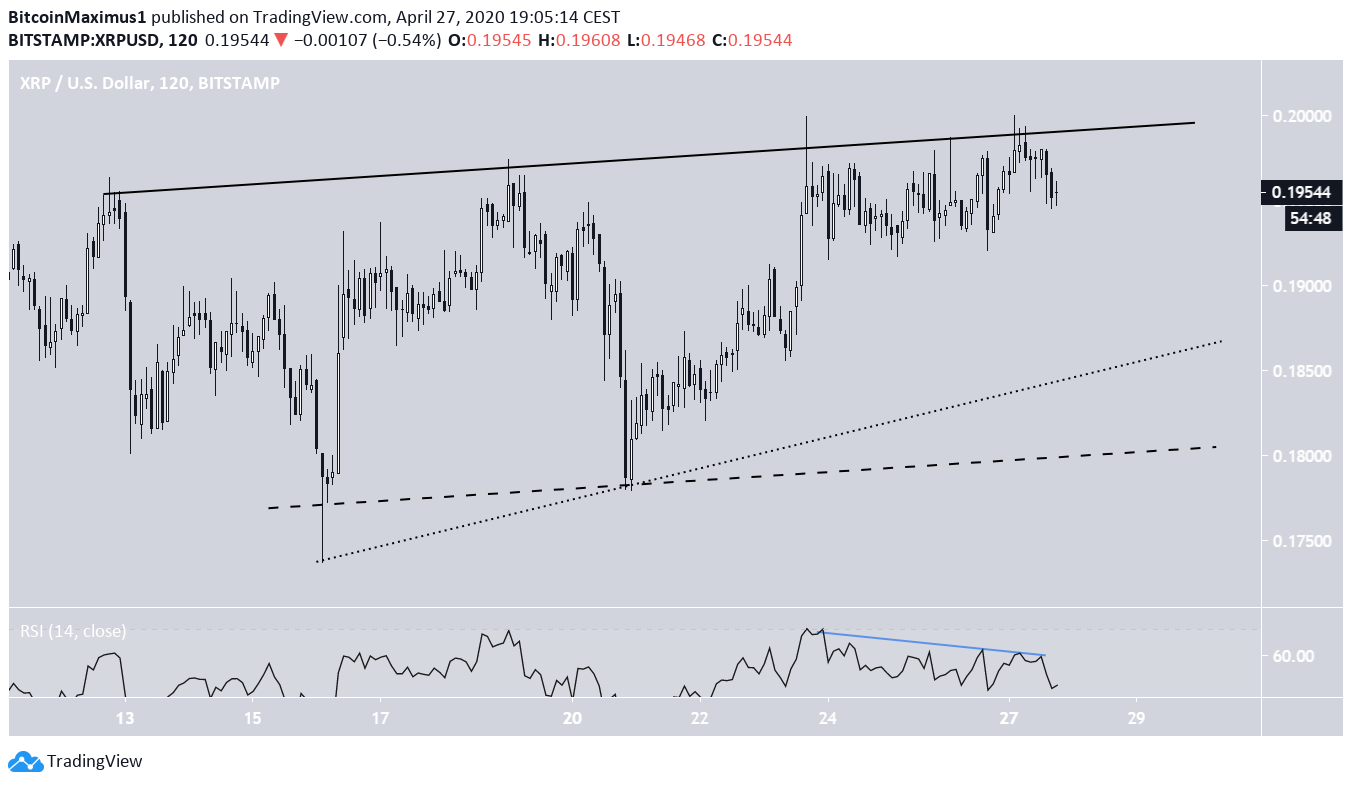
Bitcoin Cash (BCH)
The BCH price is trading very close to the main resistance area at $246. In addition, it is following an ascending support line and has been doing so since March 22. It seems unlikely that the price will break out above this resistance area on the current try for several reasons. The RSI has generated very strong bearish divergence. In addition, the price was clearly rejected several hours ago and is now in the process of moving downwards towards the support line. As long as the price stays above this ascending support line, it is expected to eventually make another attempt at breaking out.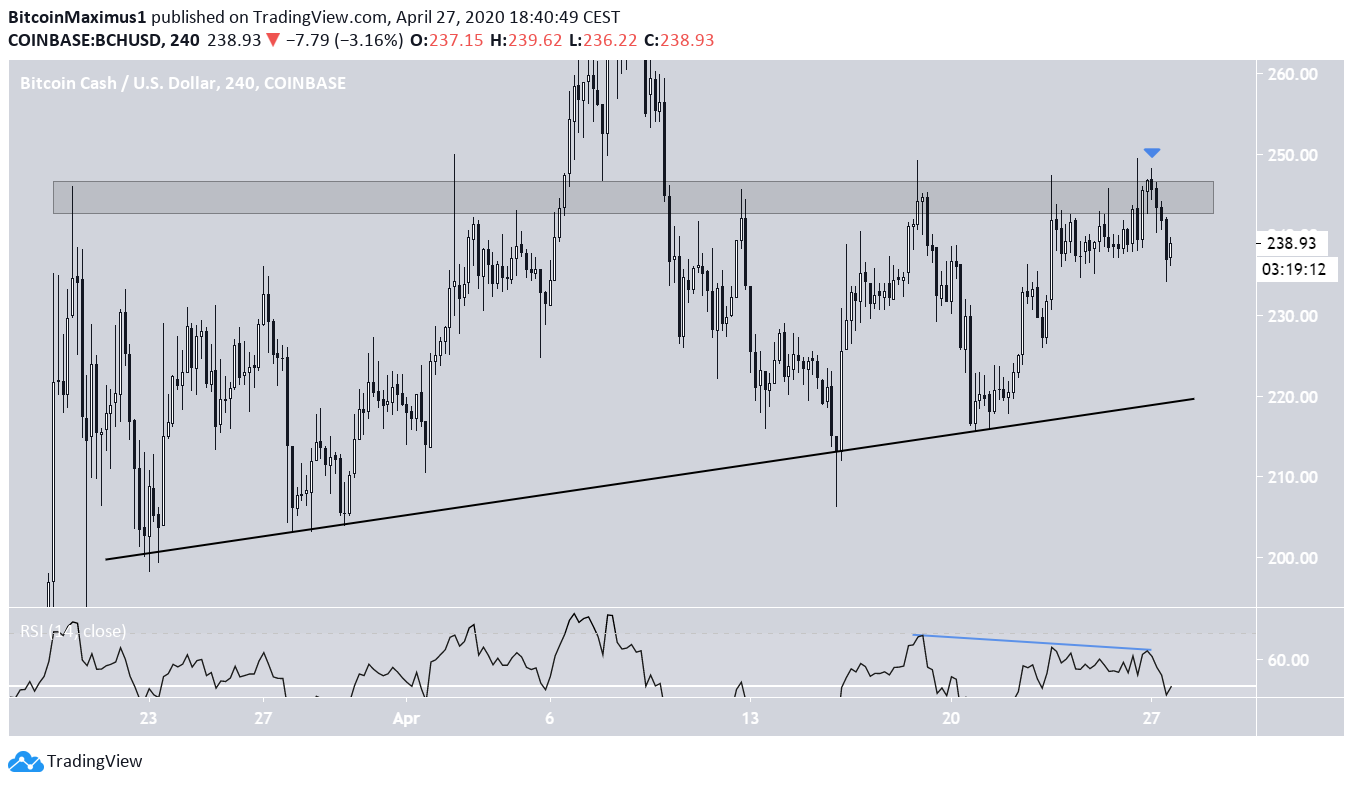
Bitcoin SV (BSV)
The BSV price has been trading inside a descending triangle, which is considered a bearish reversal pattern since April 9, currently being right at its resistance line. The price has been rejected thrice by this resistance line, most recently on April 26. The most significant level is found at $205. This is a resistance area that has been in place since March 11, with the exception of the period on April 7-9, when the price made a failed breakout attempt and fell back inside this range. Since the triangle is considered a bearish pattern and the price has made a failed breakout attempt, BSV is expected to eventually break down below the horizontal support line of $182. If/once it does, the closest support area would be found at $148. A very similar target is given by projecting the height of the triangle to the breakdown level, further increasing the significance of this target.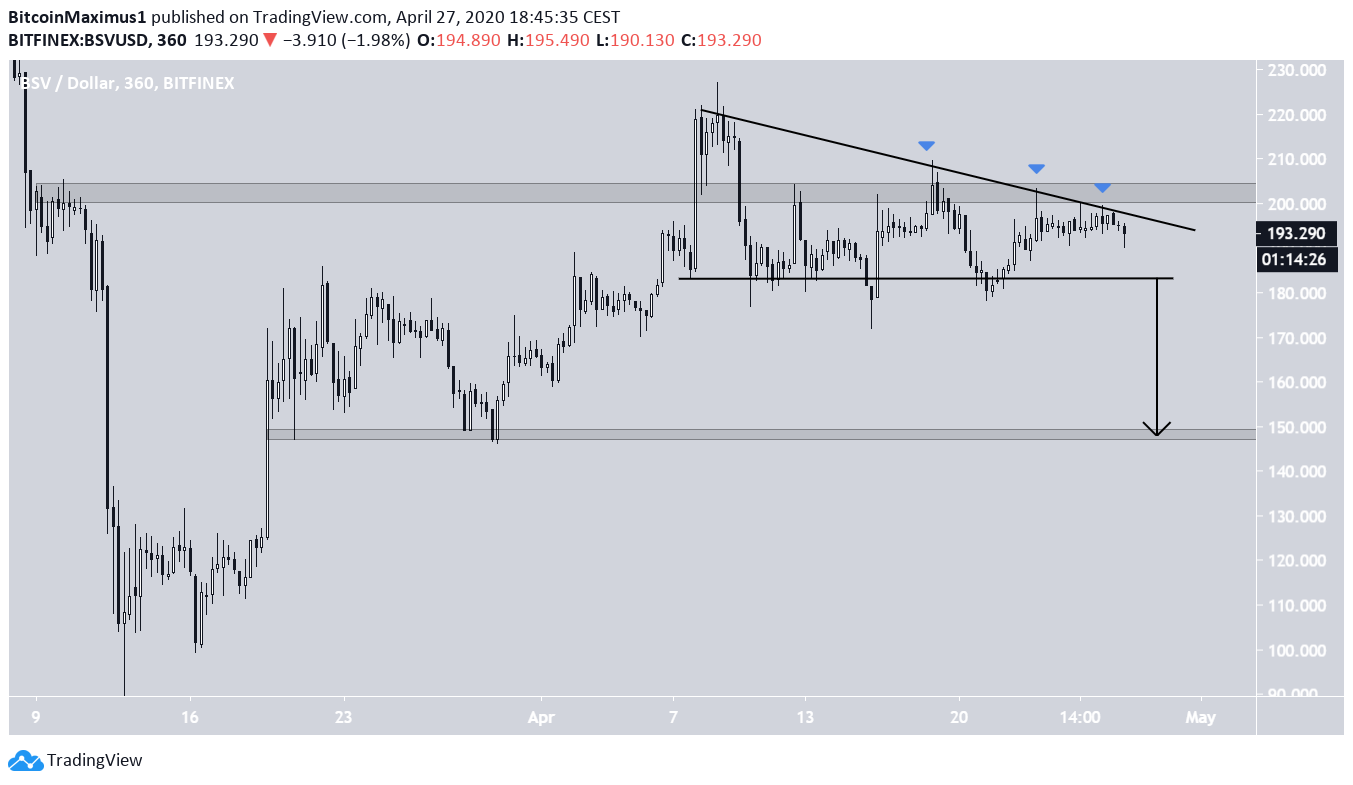
Litecoin (LTC)
The Litecoin price is trading inside an ascending channel and has been doing so since April 13. On April 25, the price reached the resistance line of this channel and has been decreasing since. At the current time, LTC was right at the middle of the channel. This is a very suitable level for a bounce, which is also supported by the fact that the RSI has reached the 50 line from above. Furthermore, a bullish cross has just occurred between the 50- and 200-period MAs, suggesting that the price will head upwards. Therefore, the price is expected to make an upward move towards the resistance line of the channel.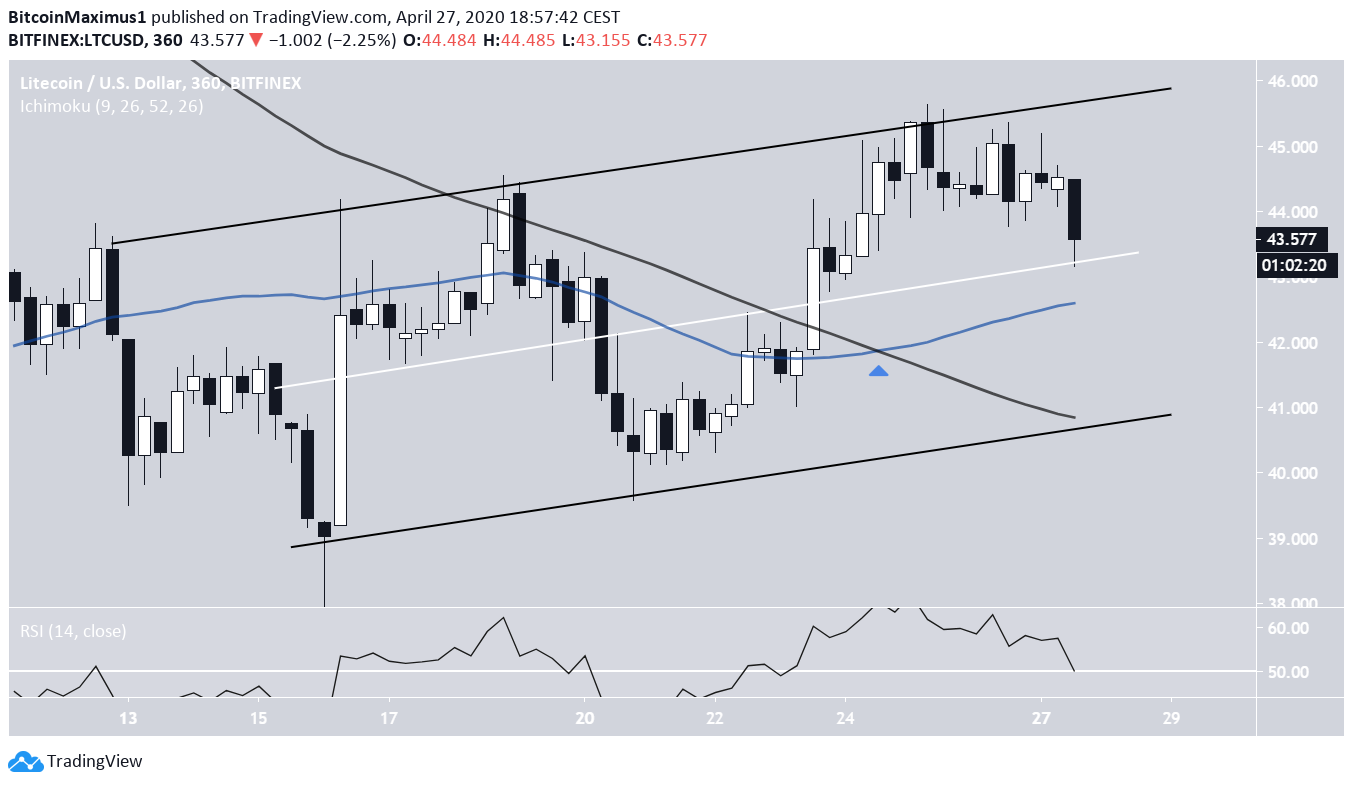
Binance Coin (BNB)
The BNB price has been trading inside an ascending channel since April 7, having validated both the support and resistance lines numerous times. The price reached the support line on April 21 and began an upward move. However, the move was not strong enough as to reach the resistance line of the channel, rather halted at the $16.7 resistance area. The price has been decreasing since. However, a bullish cross has transpired between the 50- and 200-period MAs, a sign that the price wants to move upwards. The former coincides with the ascending support line, making it a very likely place for the price to initiate a bounce.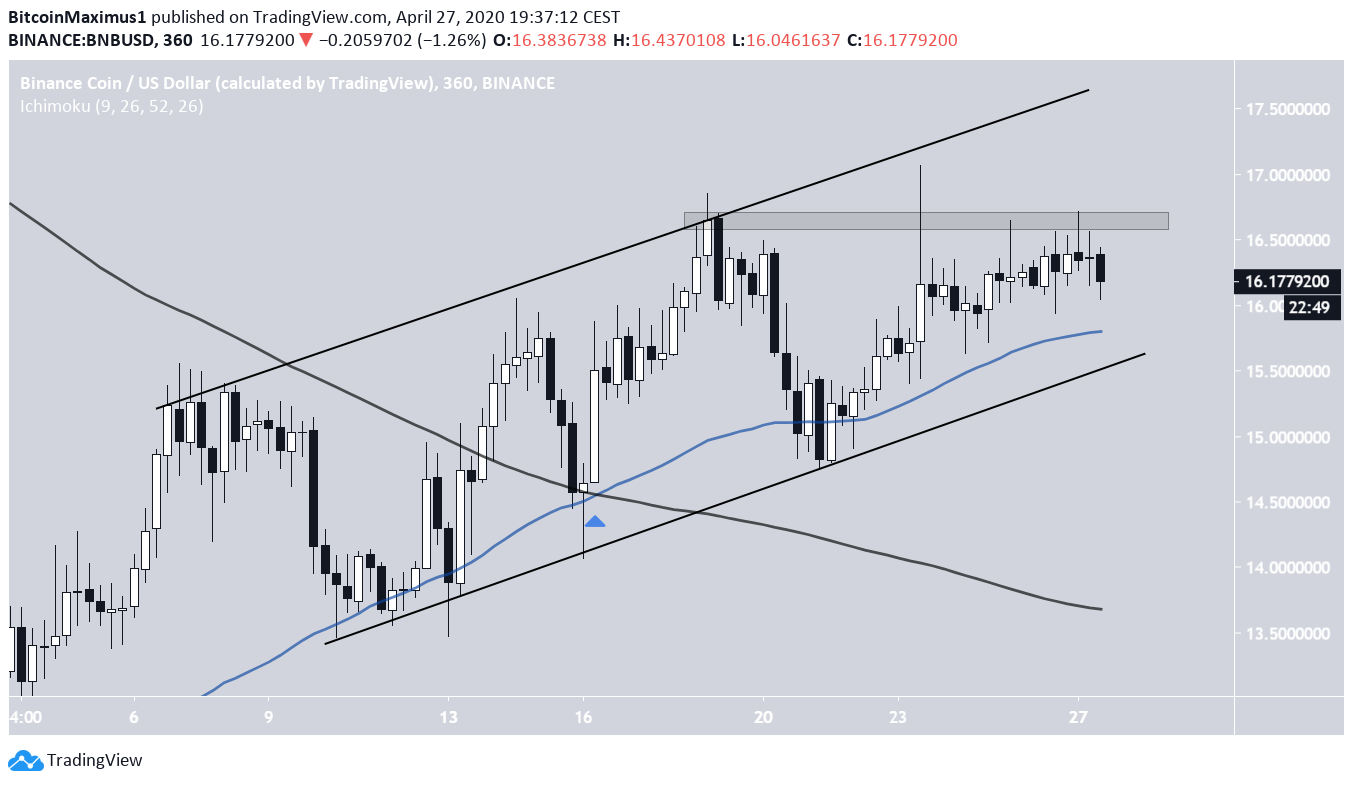
EOS (EOS)
The EOS price is following an ascending support line and has been doing so since March 13. The price touched this line on April 20 and has been increasing at an accelerated rate since. The most important resistance level is found at $2.75. The price reached it yesterday and has been gradually decreasing since. In addition, the RSI has generated bearish divergence. This makes it likely that the price will drop towards the support line. Since the ascending support line along with the $2.75 area create an ascending triangle, the price is expected to eventually break out above this area and move towards the next resistance area at $3.1.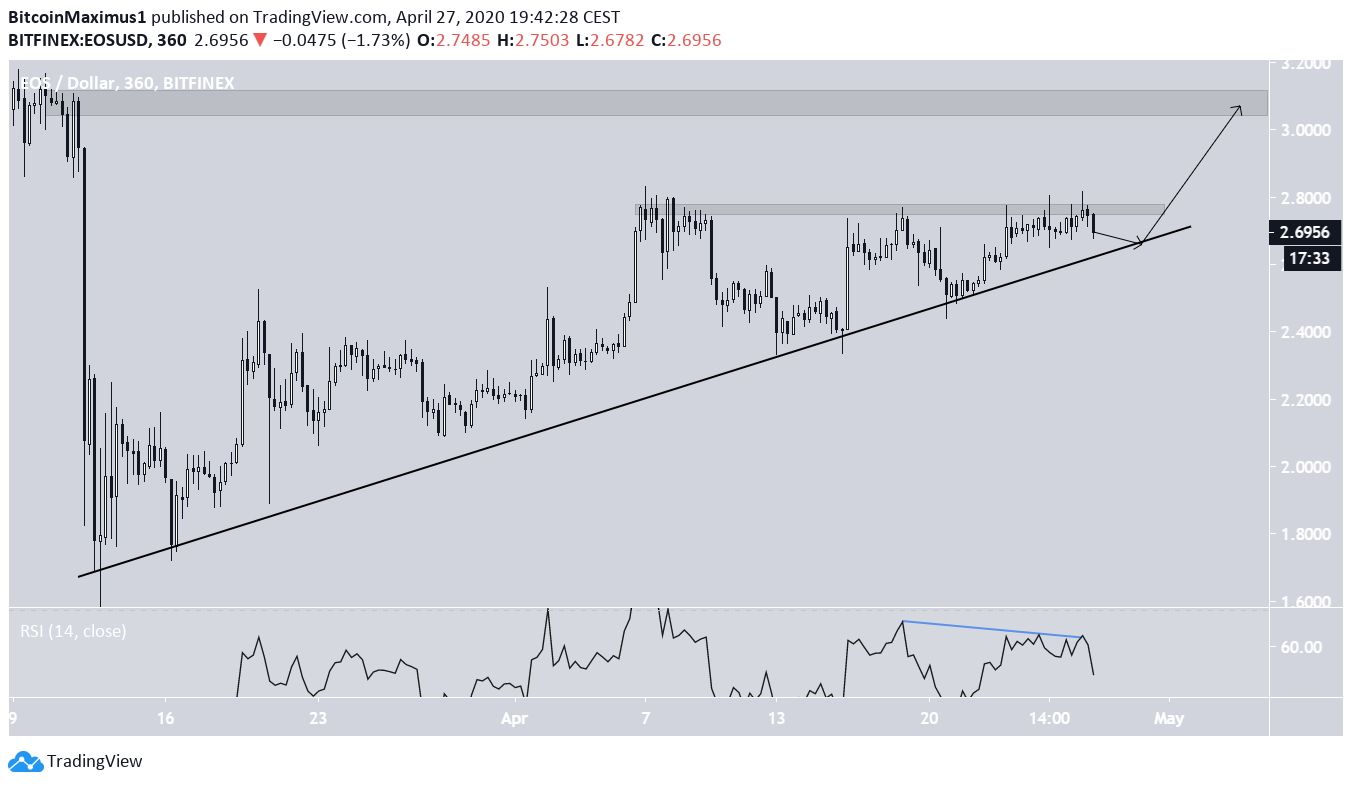
Tezos (XTZ)
The XTZ price reached a bottom on March 13 and has been following an ascending support line since. On April 17, the price bounced on this support line and accelerated its rate of increase, beginning an upward move that is still ongoing. On April 23, the price broke out from a descending resistance line that had been in place since the Feb. 19 high of $3.96. Since the breakout, the price has not validated the resistance line as support, nor has it returned to the previously mentioned ascending support line. On April 26, the price reached the $2.8 resistance area and has decreased slightly since. The price is expected to validate one of the aforementioned lines, before continuing its upward movement towards $2.8 and possibly $3.5.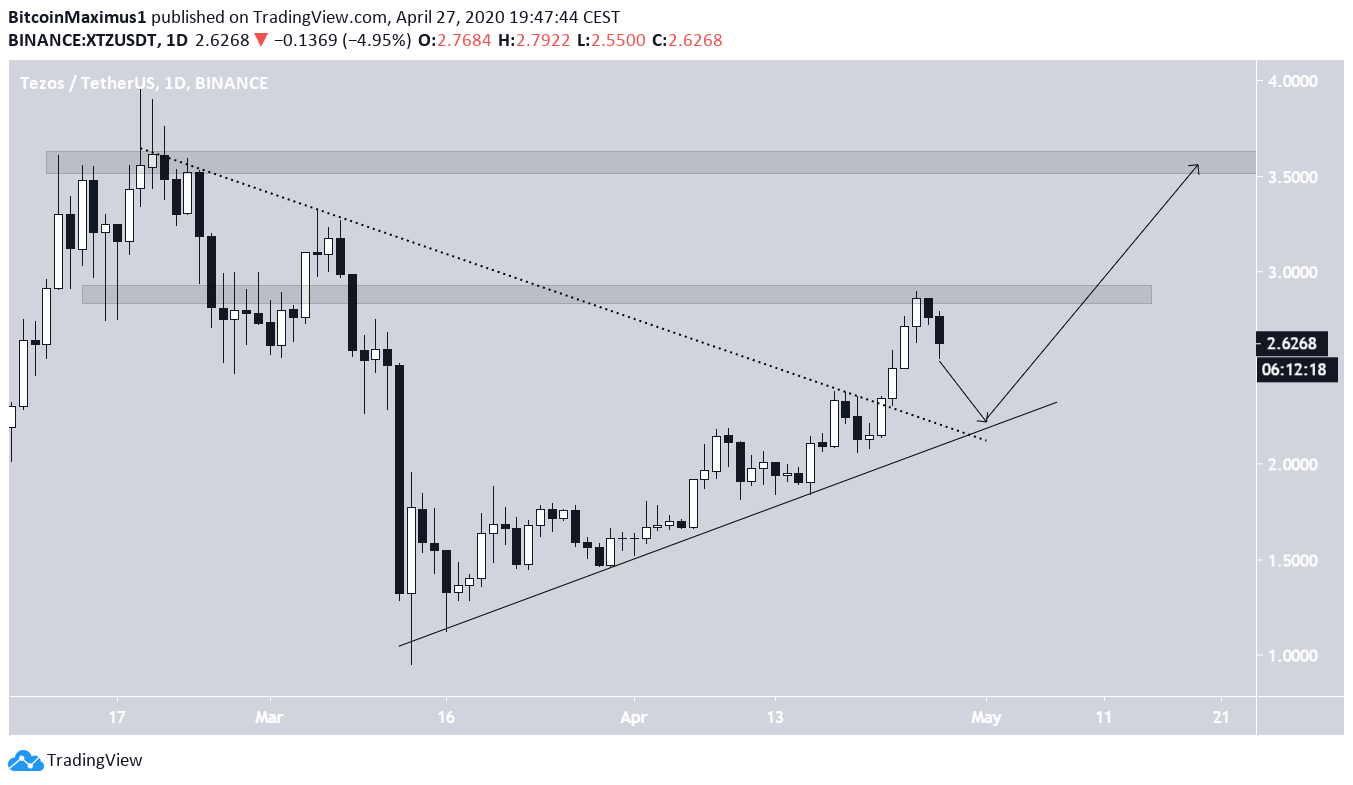
Chainlink (LINK)
The LINK price has been following an ascending support line since reaching a bottom on March 13. After bouncing on the support line, it accelerated its rate of increase and created an ascending wedge shortly after. The price increased at the rate predicted by the wedge until April 23, when it reached a high of $3.91. The price has been decreasing since, and broke down from the wedge on April 25. LINK is expected to continue decreasing until it reaches the closest support area, which is found at $3.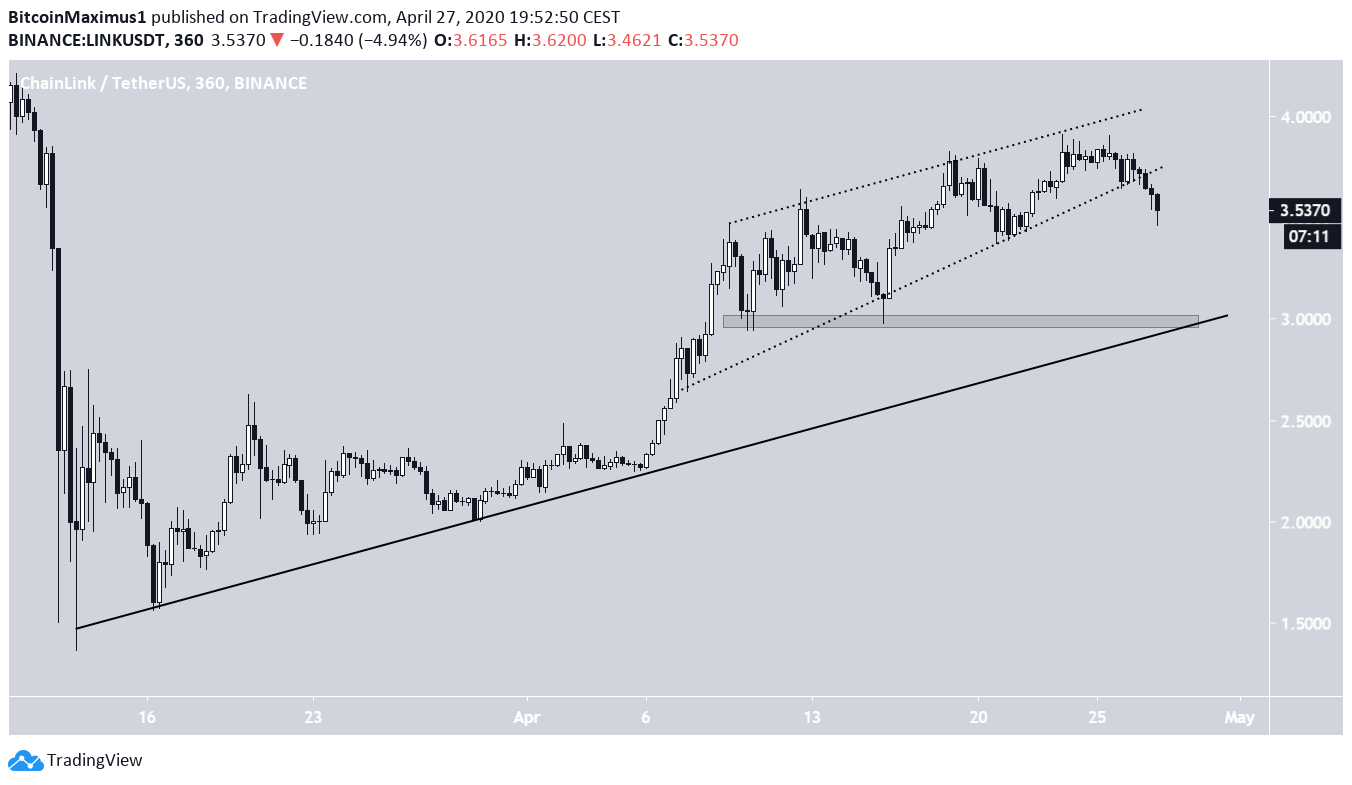
Disclaimer
In line with the Trust Project guidelines, this price analysis article is for informational purposes only and should not be considered financial or investment advice. BeInCrypto is committed to accurate, unbiased reporting, but market conditions are subject to change without notice. Always conduct your own research and consult with a professional before making any financial decisions. Please note that our Terms and Conditions, Privacy Policy, and Disclaimers have been updated.

Valdrin Tahiri
Valdrin discovered cryptocurrencies while he was getting his MSc in Financial Markets from the Barcelona School of Economics. Shortly after graduating, he began writing for several different cryptocurrency related websites as a freelancer before eventually taking on the role of BeInCrypto's Senior Analyst.
(I do not have a discord and will not contact you first there. Beware of scammers)
READ FULL BIO
Sponsored
Sponsored