

During the week of April 20-27, the Bitcoin (BTC) price increased considerably — going from a low of $6751 to a high of $7738. This was the sixth bullish weekly candlestick in a row.
This is the largest number of successive bullish weekly candlesticks since April and May 2019, when the Bitcoin price created seven successive bullish candlesticks before following them up with a bearish engulfing one.
Weekly Bitcoin Outlook
The Bitcoin price is trading inside a strong resistance zone in the weekly chart, found at $7800. This area initially acted as support in October 2019 before turning to resistance the following month. Afterward, the price broke down below it in March 2020. Now, it is in the process of reaching the area from below — in which case the area is expected to act as resistance. Furthermore, the weekly Relative Strength Index has reached the 50-line from underneath. The line could potentially act as resistance and reject the RSI — causing it to drop sharply along with the price.
Wave Count
The Bitcoin price has been decreasing since February 13 but the rate of decrease accelerated on March 7 — causing the price to reach a bottom. The rapid decrease was likely the third wave of a five-wave Elliott formation. If so, it seems that the price is currently in the fourth wave, after which the fifth and final downward wave would ensue. The current wave (4) is transpiring inside of an A-B-C formation. The likeliest level for it to end would be near $8000, which is the 0.786 Fib level of the second wave. On the other hand, an increase above $8500, which was the bottom of the first wave, would invalidate the wave count.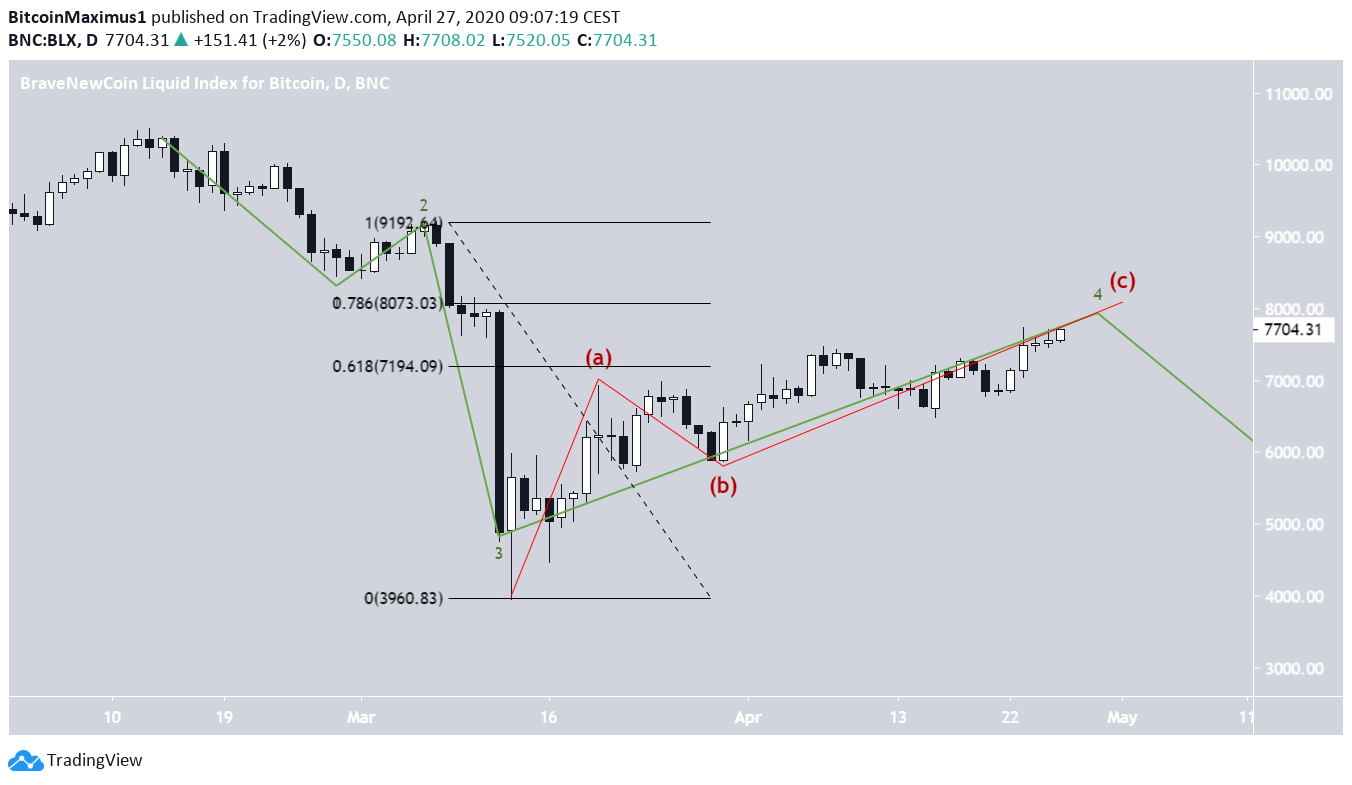
Short-Term Movement
In the short-term, the Bitcoin price had been trading in a range between $7450-$7600 but broke out above it on April 26. The price has been gradually increasing since. It is possible that it is trading inside of a short-term ascending and broadening wedge.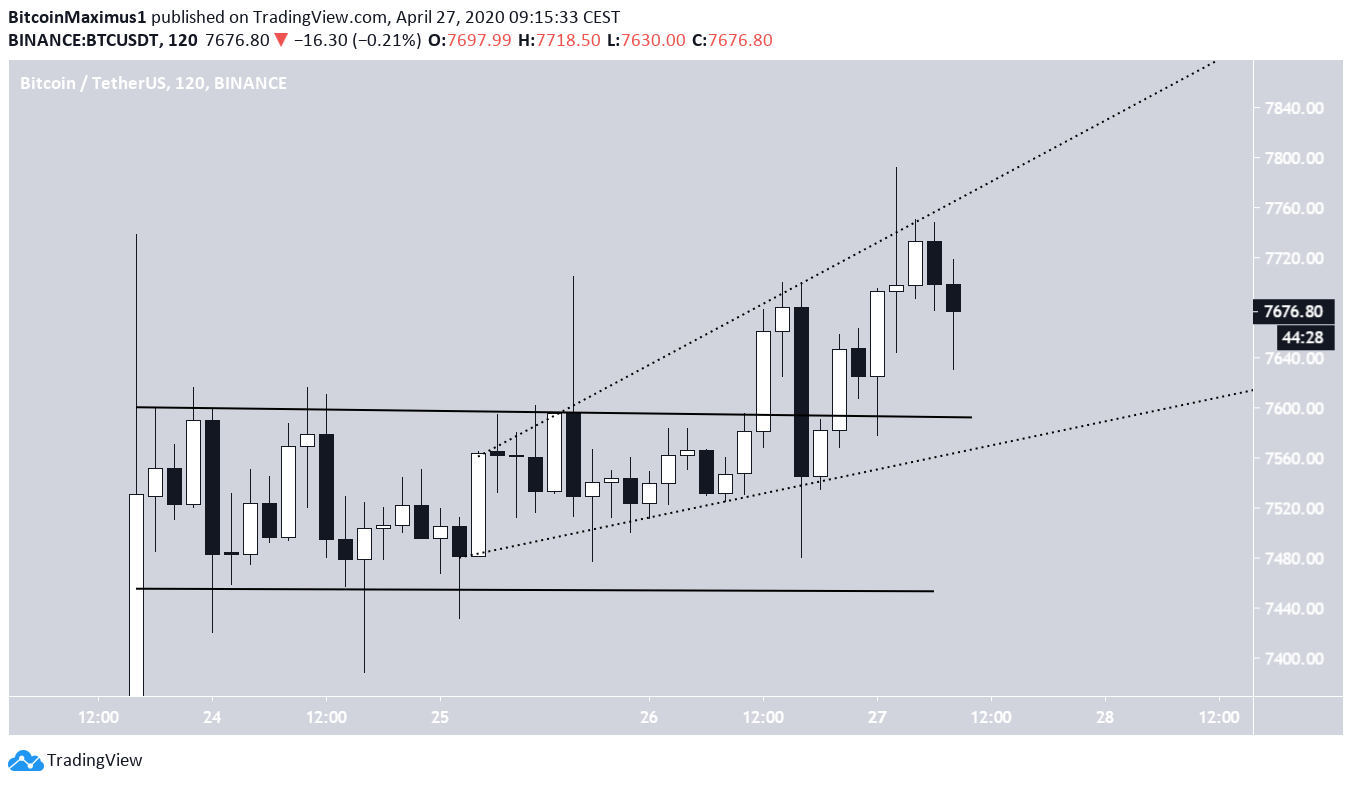
Disclaimer
In line with the Trust Project guidelines, this price analysis article is for informational purposes only and should not be considered financial or investment advice. BeInCrypto is committed to accurate, unbiased reporting, but market conditions are subject to change without notice. Always conduct your own research and consult with a professional before making any financial decisions. Please note that our Terms and Conditions, Privacy Policy, and Disclaimers have been updated.

Valdrin Tahiri
Valdrin discovered cryptocurrencies while he was getting his MSc in Financial Markets from the Barcelona School of Economics. Shortly after graduating, he began writing for several different cryptocurrency related websites as a freelancer before eventually taking on the role of BeInCrypto's Senior Analyst.
(I do not have a discord and will not contact you first there. Beware of scammers)
READ FULL BIO
Sponsored
Sponsored