


BeInCrypto takes a look at five projects that increased the most from the entire crypto market last week, more specifically, from Nov. 18 to Nov. 25
These digital assets have taken the crypto news and crypto market spotlight:
- Curve DAO Token (CRV) price is up 21.70%
- Dash (DASH) price is up 21.39%
- Litecoin (LTC) price is up 20.84%
- Huobi Token (HT) price is up 20.77%
- Bitcoin Cash (BCH) price is up 10.77%
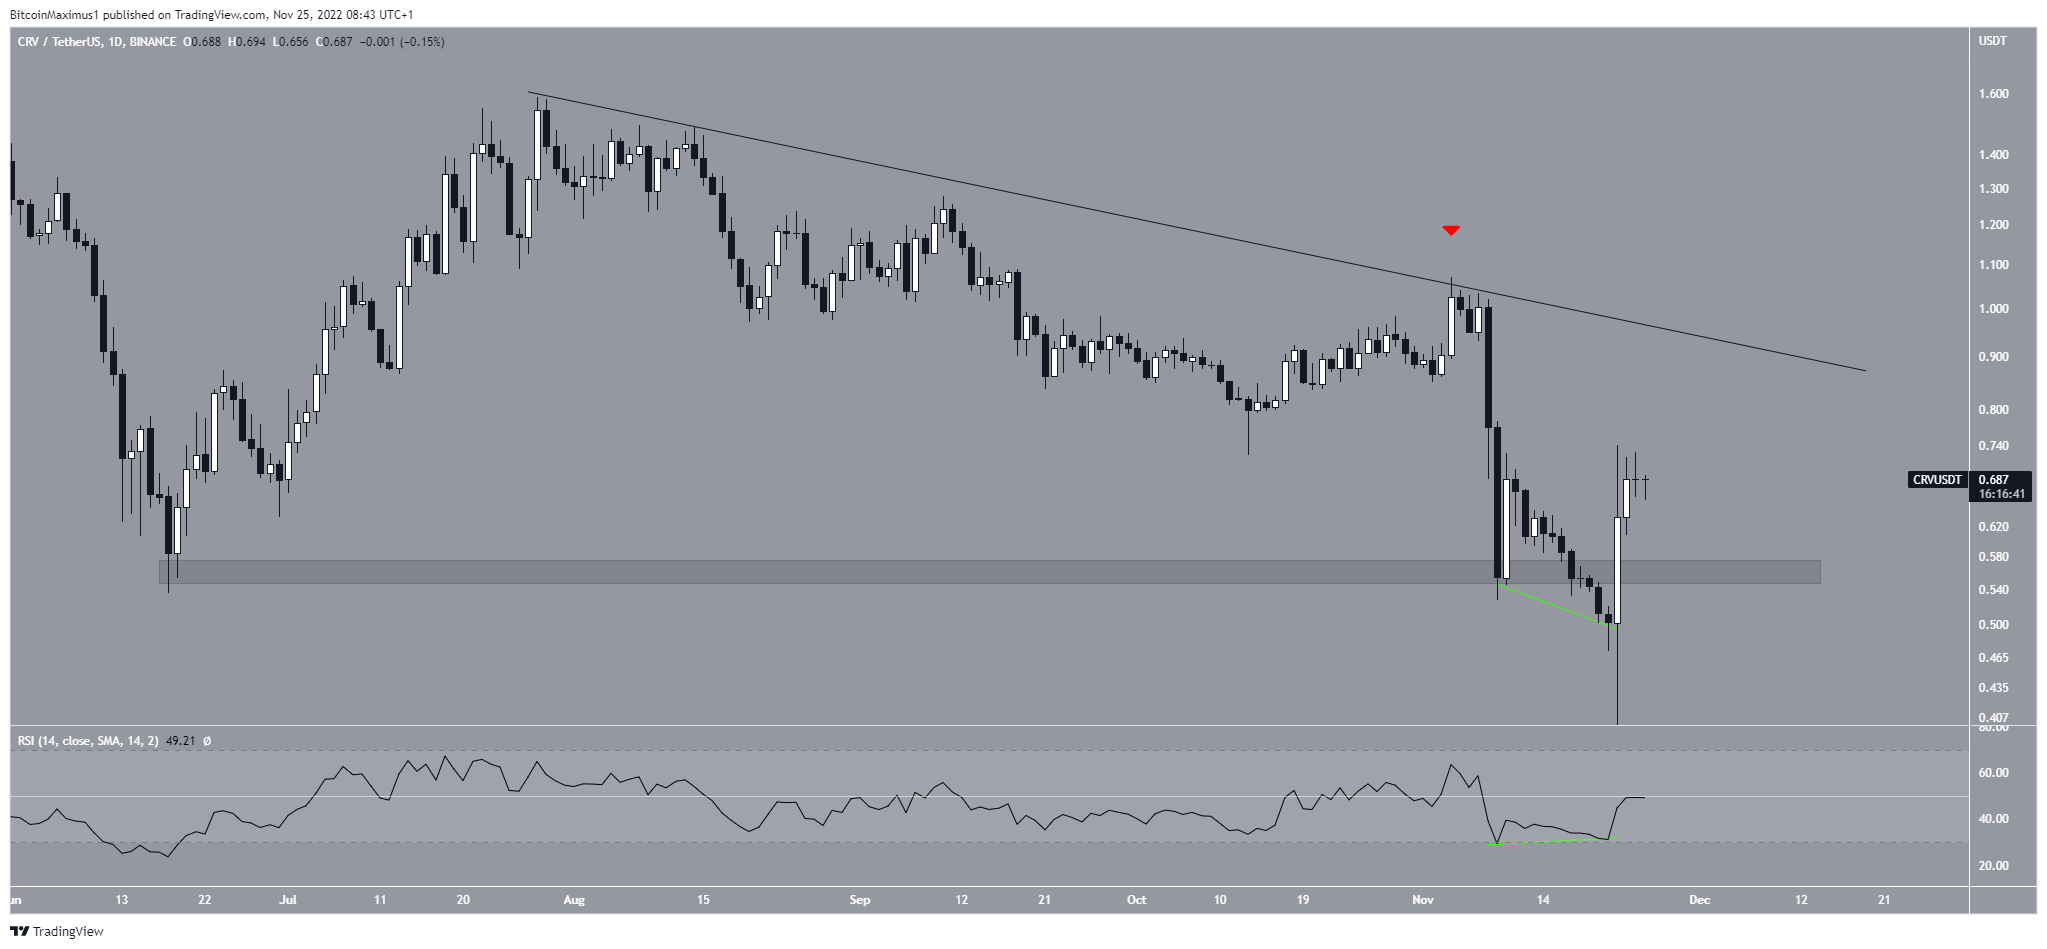
CRV Price Leads Crypto Market Increase
The CRV price had been falling since being rejected by a resistance line on Nov. 4. The decrease led to a low of $0.40 on Nov. 22. Seemingly, this caused a breakdown from the $0.56 horizontal support area.
However, the CRV price reversed the trend shortly afterward, creating a sizeable bullish candlestick in the process. The bounce was preceded by bullish divergence in the RSI (green line) and caused a reclaim of the $0.56 horizontal area, which is now expected to provide support.
On Nov. 22, there was a growing number of short bets on CRV, so it is possible that the entire bounce occurred as a result of a short squeeze.
As a result, the trend can be considered bullish as long as CRV is trading above the $0.56 horizontal support area. A breakout from the descending resistance line would likely accelerate the rate of increase.
Conversely, a close below the horizontal area would indicate that lower prices are expected.
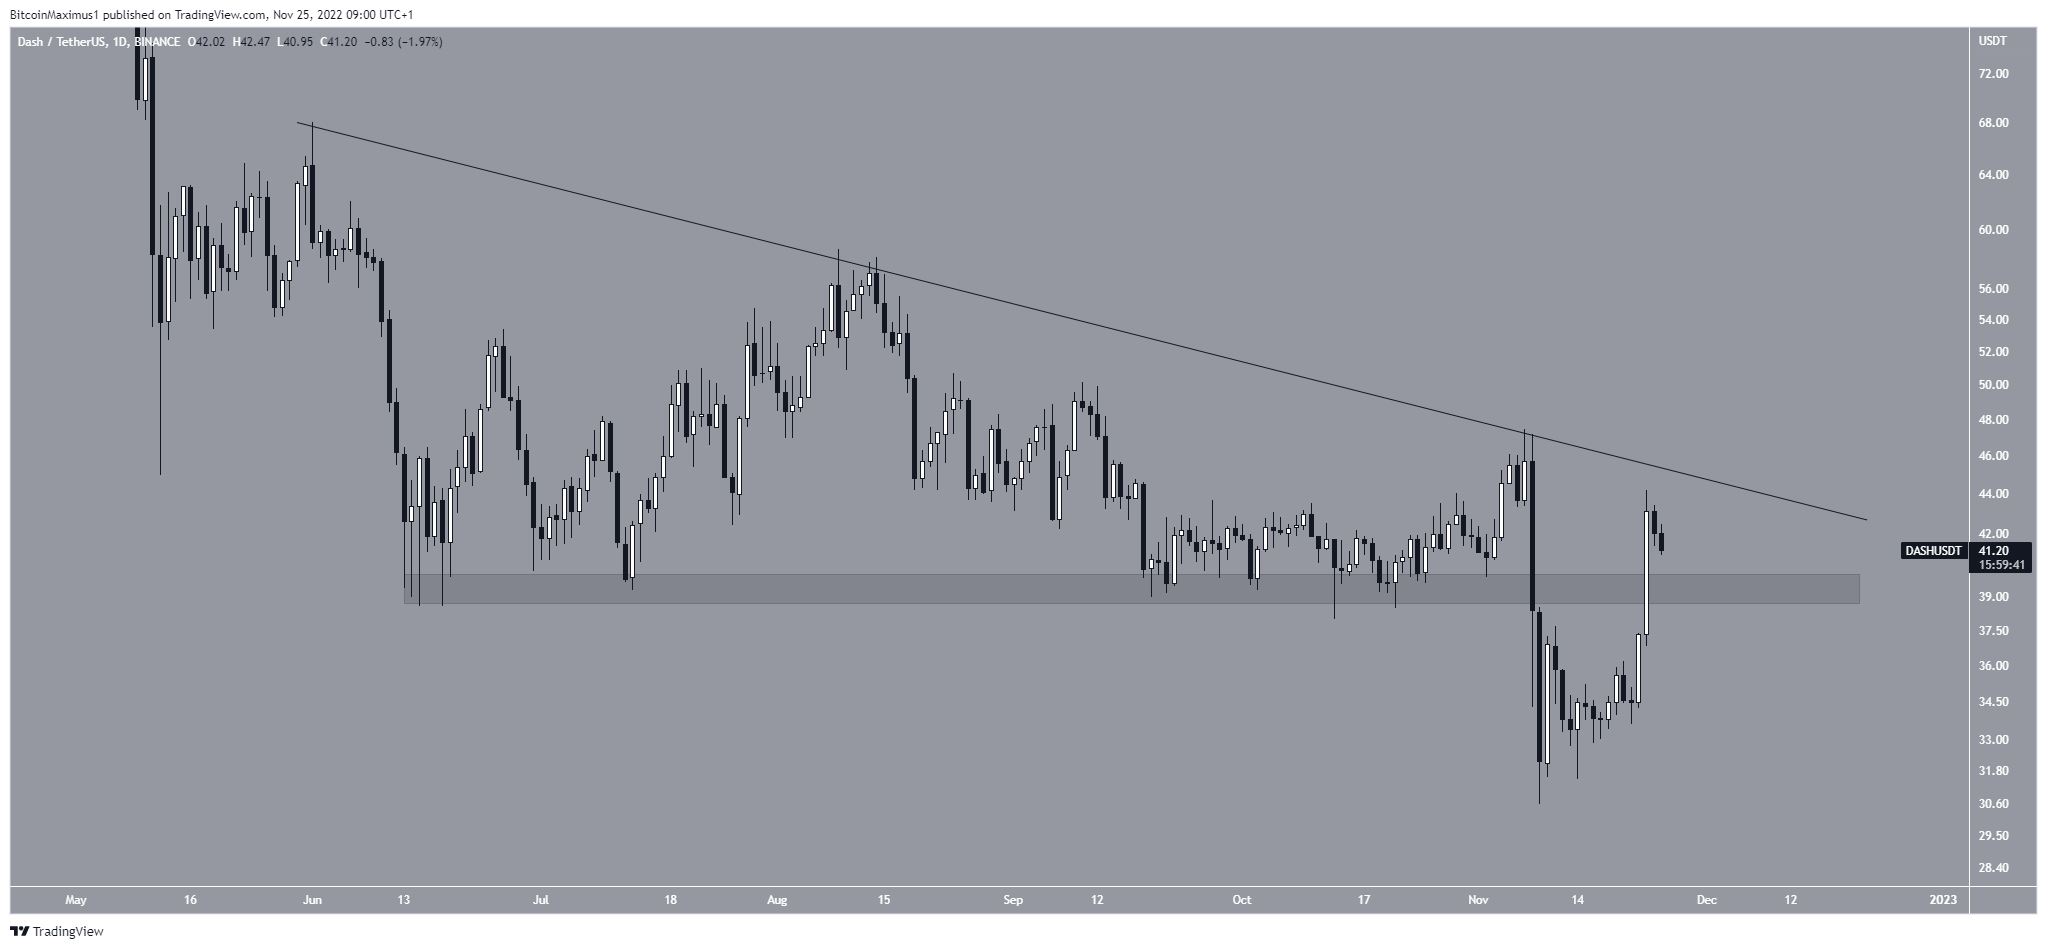
Dash Reclaims Crucial Area
Dash is one of the oldest altcoins in the crypto market. After breaking down from the $39.50 support area, it gradually regained its footing and initiated an upward movement on Nov. 22. It reclaimed the $39.50 area the next day. Now, the area is expected to provide support.
The deviation below it and subsequent reclaim is a strong sign of a bullish trend. If DASH breaks out from its descending resistance line, the rate of increase could greatly accelerate.
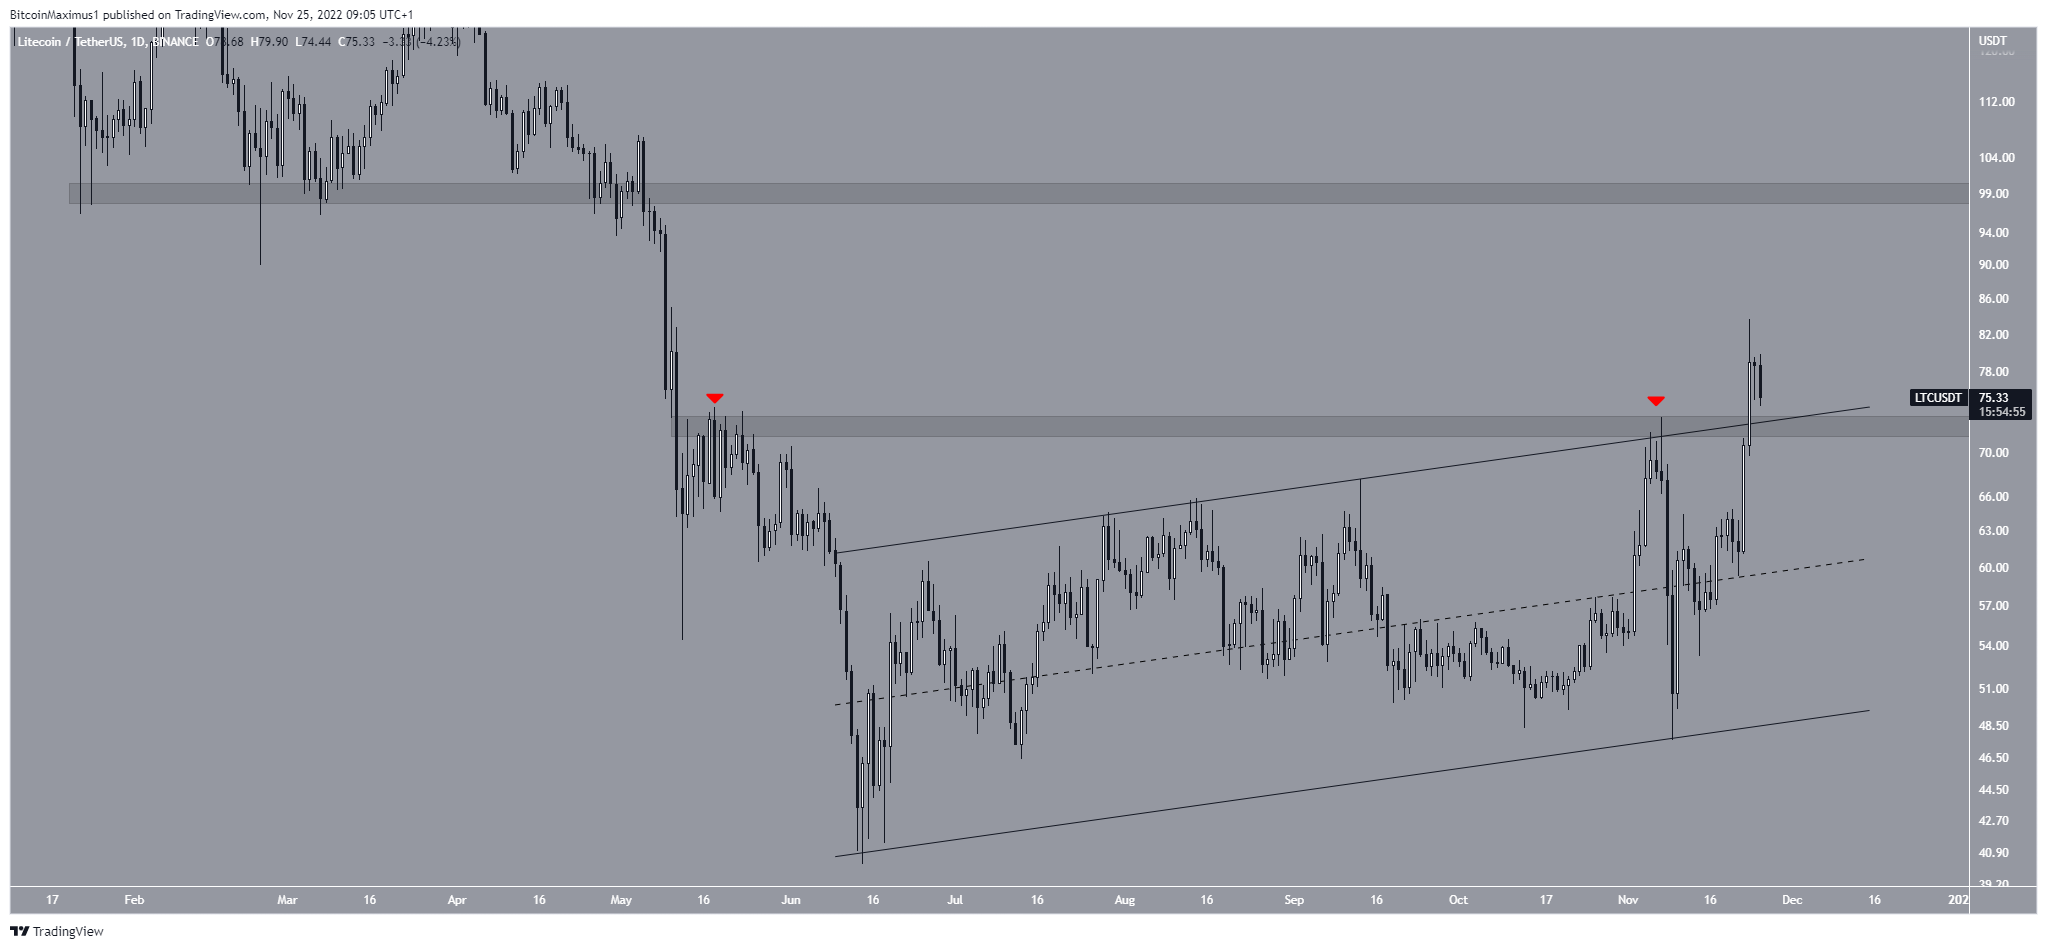
Litecoin Price Breaks Out From Long-Term Pattern
The Litecoin price had been trading inside an ascending parallel channel since June 13. Such channels usually contain corrective movements, meaning that an eventual breakdown from it would be expected.
However, LTC bounced sharply on Nov. 9 and began an upward movement instead. On Nov. 23, it broke out from both the $73 resistance area and the resistance line of the channel. This is a sign that the trend is bullish.
If the upward movement continues, the next resistance would be at $100.
Conversely, a daily close below the $73 area would invalidate this bullish Litecoin price prediction.
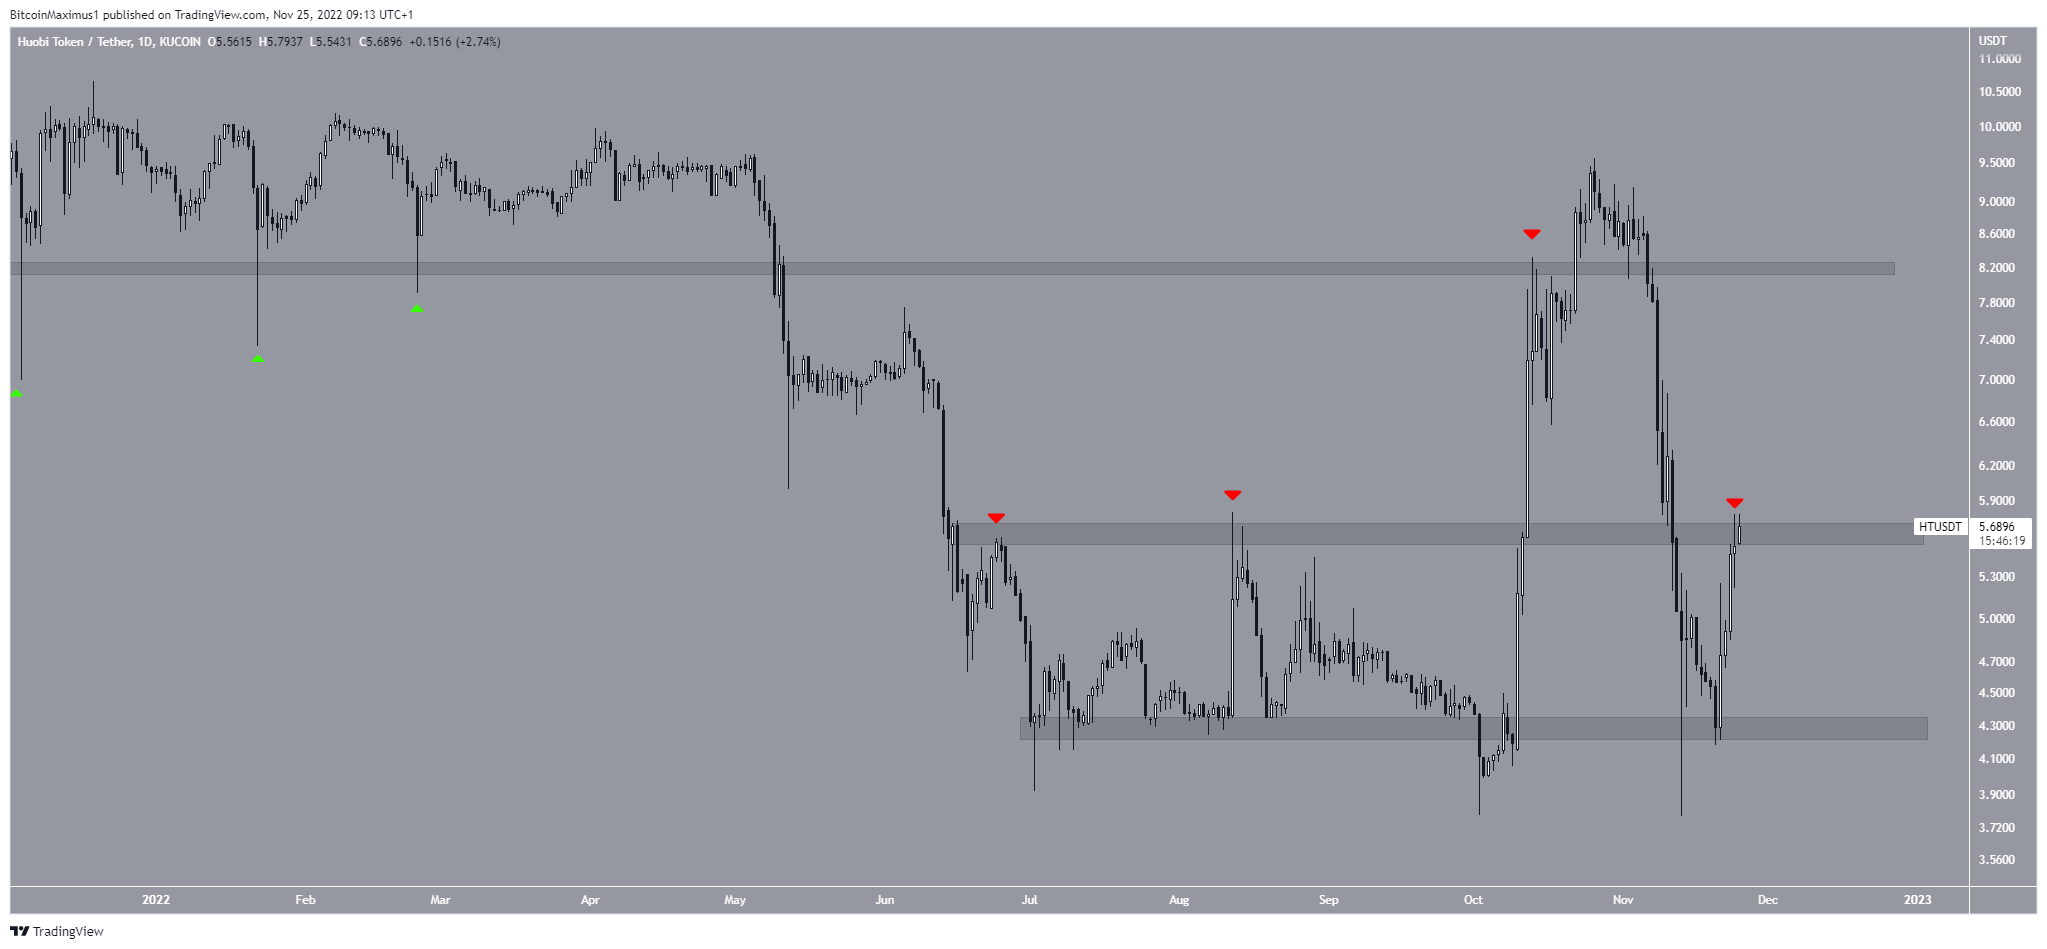
HT Attempts Breakout Despite Crypto Market Bearishness
The HT price has been trading in a range between $4.30 and $5.65 since the end of June. Initially, the HT price broke out from the latter and reached a high of $9.56 on Oct. 26.
However, the upward movement could not be sustained, and the HT price fell inside the trading range in the following few weeks.
The HT price is currently trading at a crucial level. Reclaiming the $5.65 area would likely increase to $8.20. On the other hand, failure to do so could lead to a re-test of the $4.30 support area.
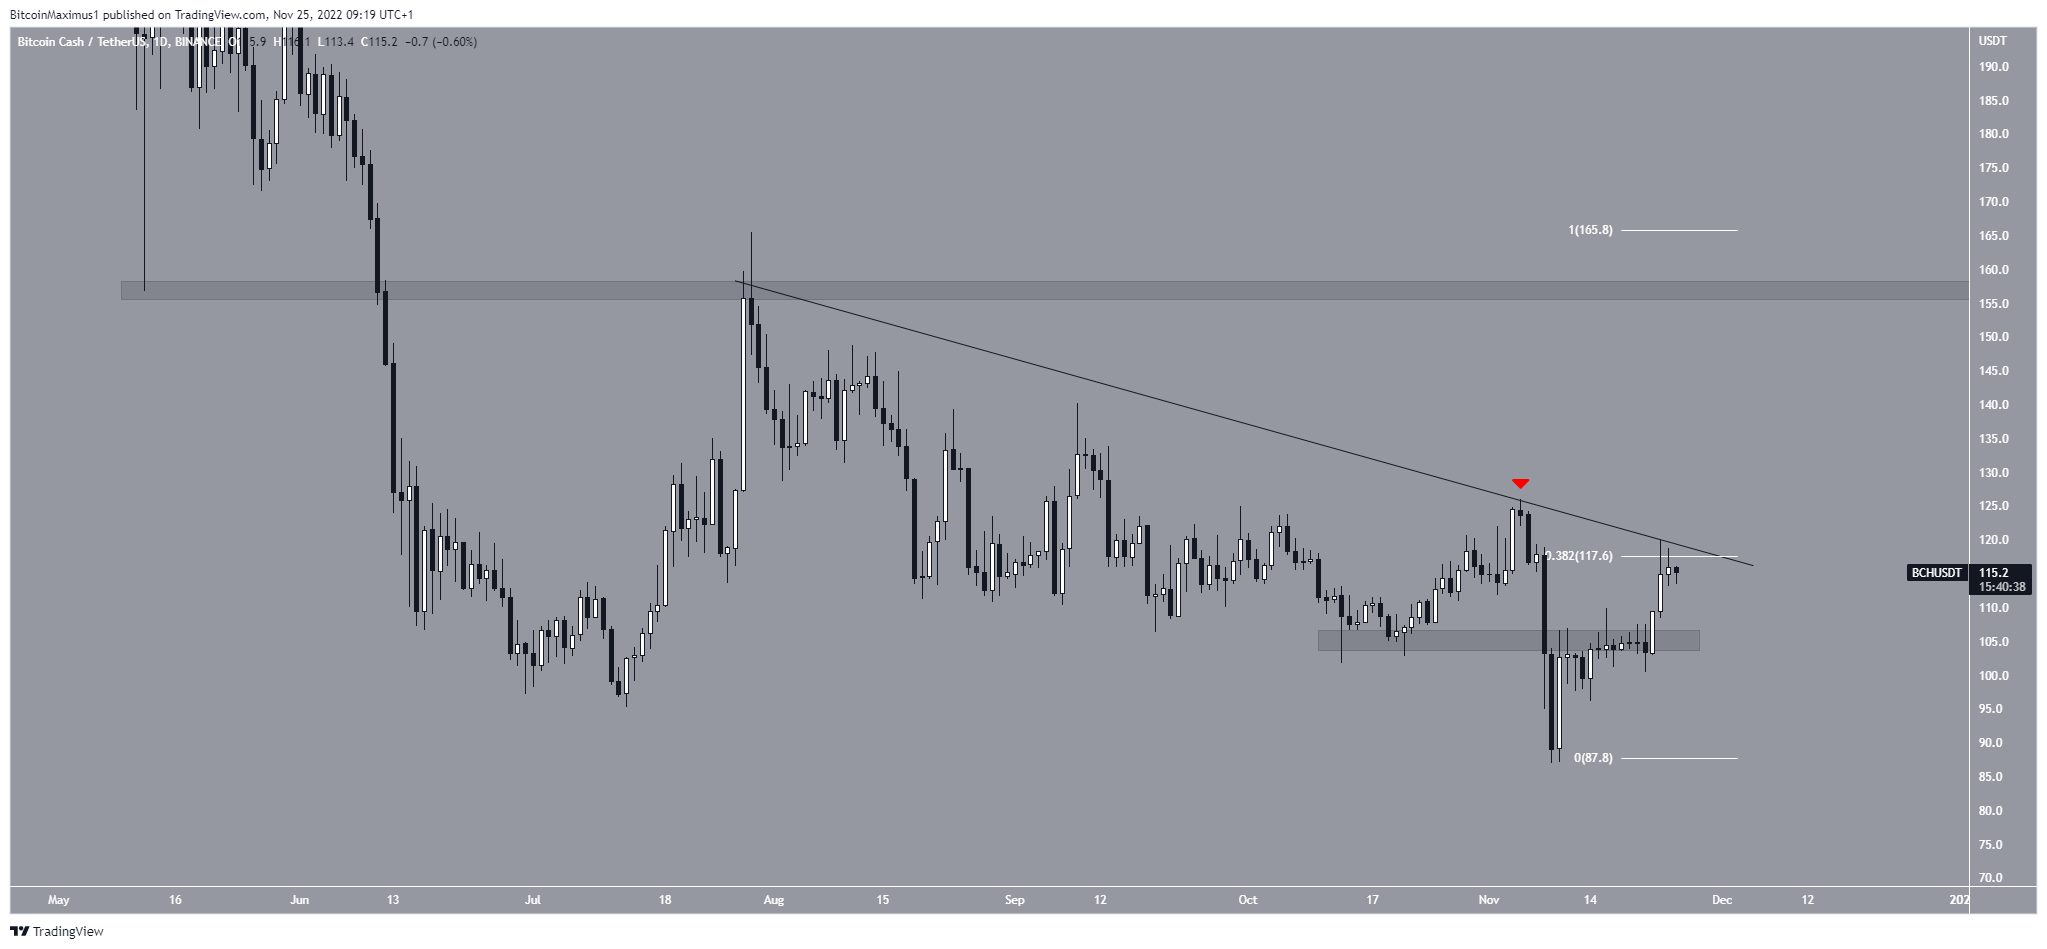
BCH Bounces After New Yearly Low
The BCH price was rejected by a descending resistance line on Nov. 5 (red icon). It fell to a new yearly low of $87 four days later.
However, the BCH price has been moving upwards since and is making another attempt at breaking out from the line. Since the line also coincides with the 0.382 Fib retracement resistance level, a breakout above it would likely accelerate the rate of increase.
If that occurs, the BCH price could increase to $157.
On the other hand, a rejection from the line and a fall from the $106 support area would be bearish.
For BeInCrypto’s latest crypto market analysis, click here.
Disclaimer: BeInCrypto strives to provide accurate and up-to-date news and information but it will not be responsible for any missing facts or inaccurate information. You comply and understand that you should use any of this information at your own risk. Cryptocurrencies are highly volatile financial assets, so research and make your own financial decisions.


