

Cream Finance (CREAM) has reclaimed the $125 support area and is moving upwards.
Enjin Coin (ENJ) bounced on April 7 and is attempting to reach a new all-time high price.
Polkadot (DOT) has broken out from a descending resistance line and is attempting to reclaim the $41.50 resistance area.
Cream Finance (CREAM)
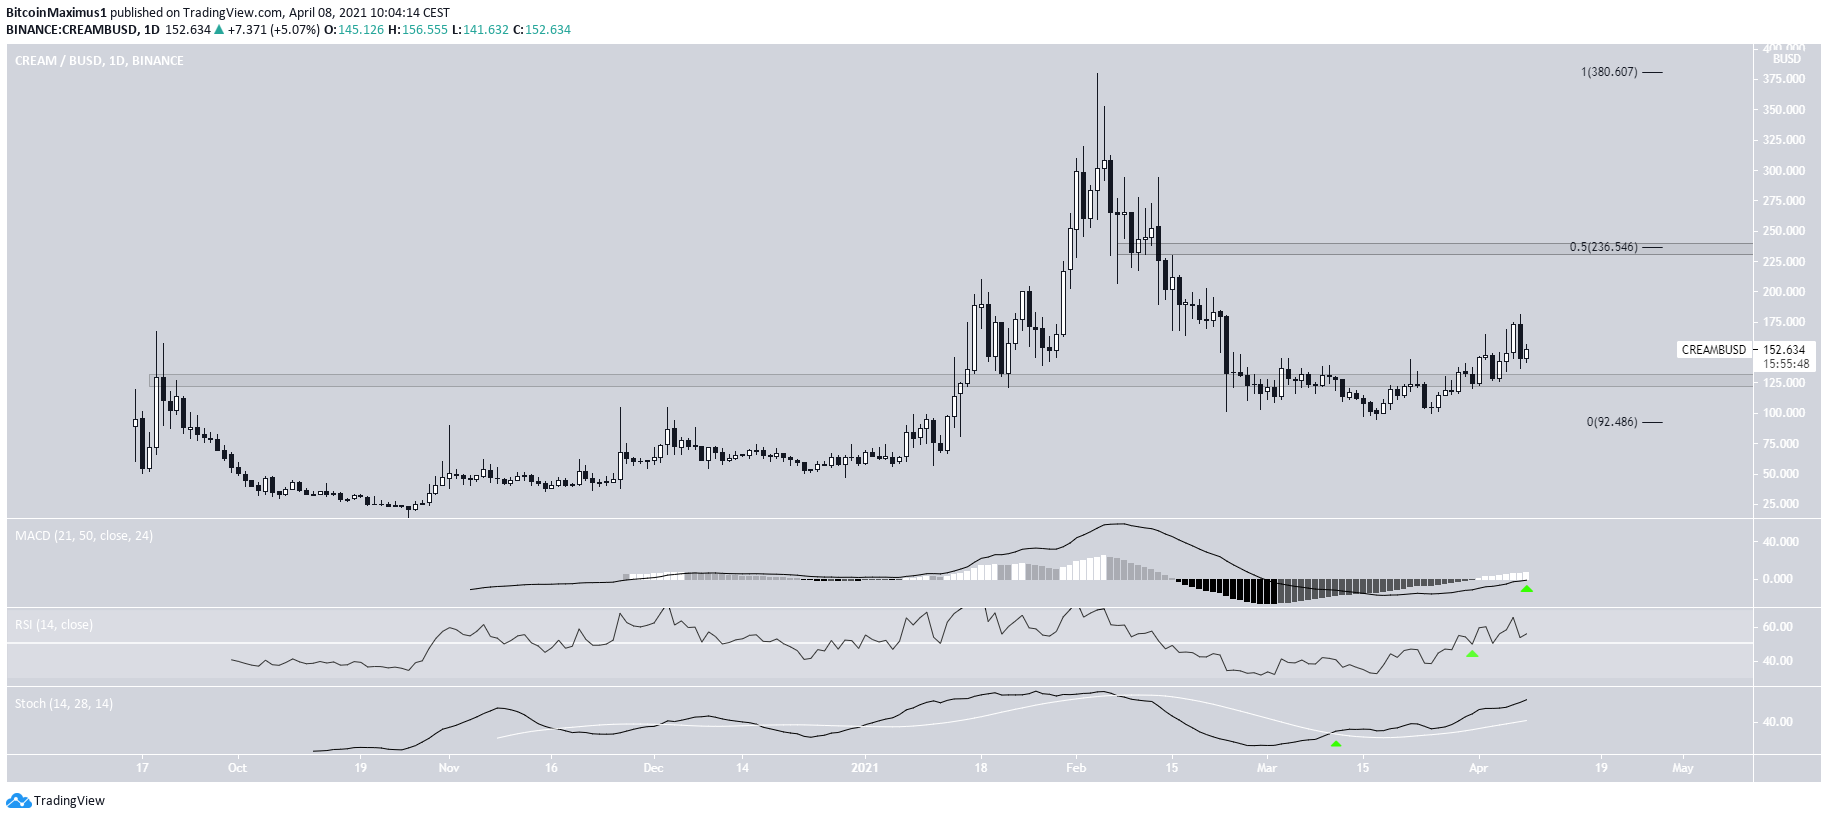
CREAM has been moving downwards since Feb. 14, when it reached an all-time high price of $380.
The drop was swift, culminating with a low of $94.70 on March 17.
CREAM has been moving upwards since.
On April 1, it managed to reclaim the $125 area, which had previously acted as resistance. This is a bullish development that suggests higher prices are on the horizon.
Furthermore, technical indicators are bullish. The MACD is increasing, as are the RSI and Stochastic oscillator. The RSI has just crossed above the 50 line and validated it as support.
Therefore, CREAM is expected to increase at least to the next resistance at $236.
Highlights
- CREAM has reclaimed the $125 support area.
- Technical indicators in the daily time frame are bullish.
Enjin Coin (ENJ)
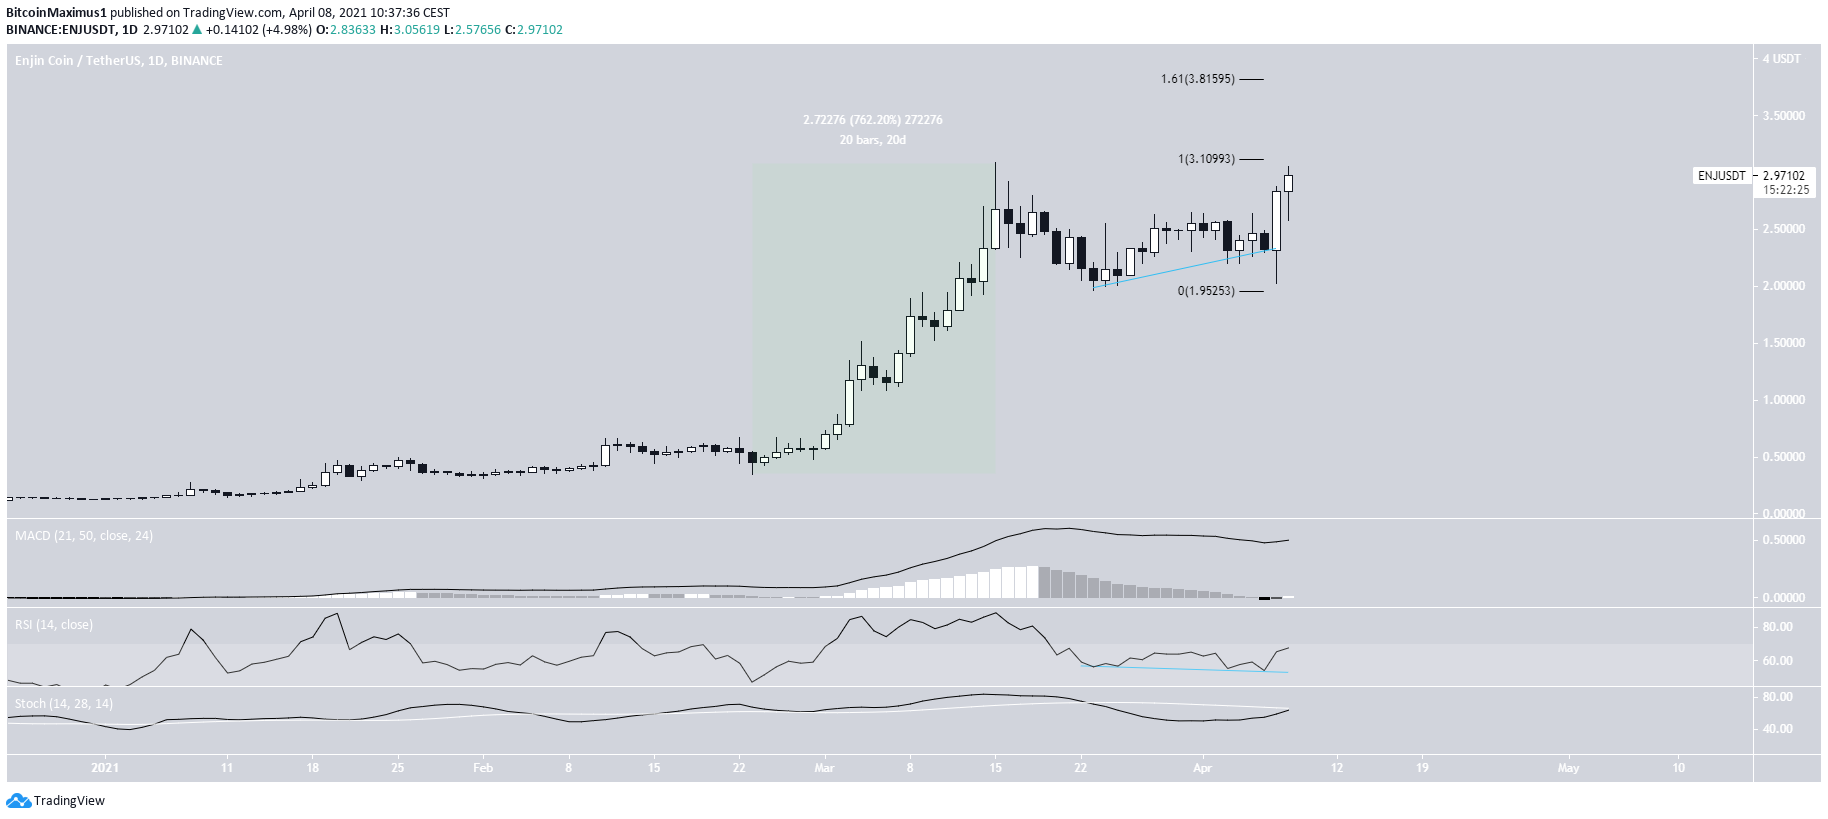
ENJ has been increasing parabolically since Feb. 23. On March 15, it managed to reach an all-time high price of $3.08. This amounted to an increase of 762% in only 20 days.
The decrease that followed was gradual and ENJ initiated another upward move on April 7.
The RSI has generated a hidden bullish divergence. Furthermore, the MACD has just crossed into positive territory.
If ENJ reaches a new all-time high price, which seems likely, the next resistance would be found at $3.81.
Highlights
- ENJ has nearly reached a new all-time high price.
- The RSI has generated a hidden bullish divergence.
Polkadot (DOT)
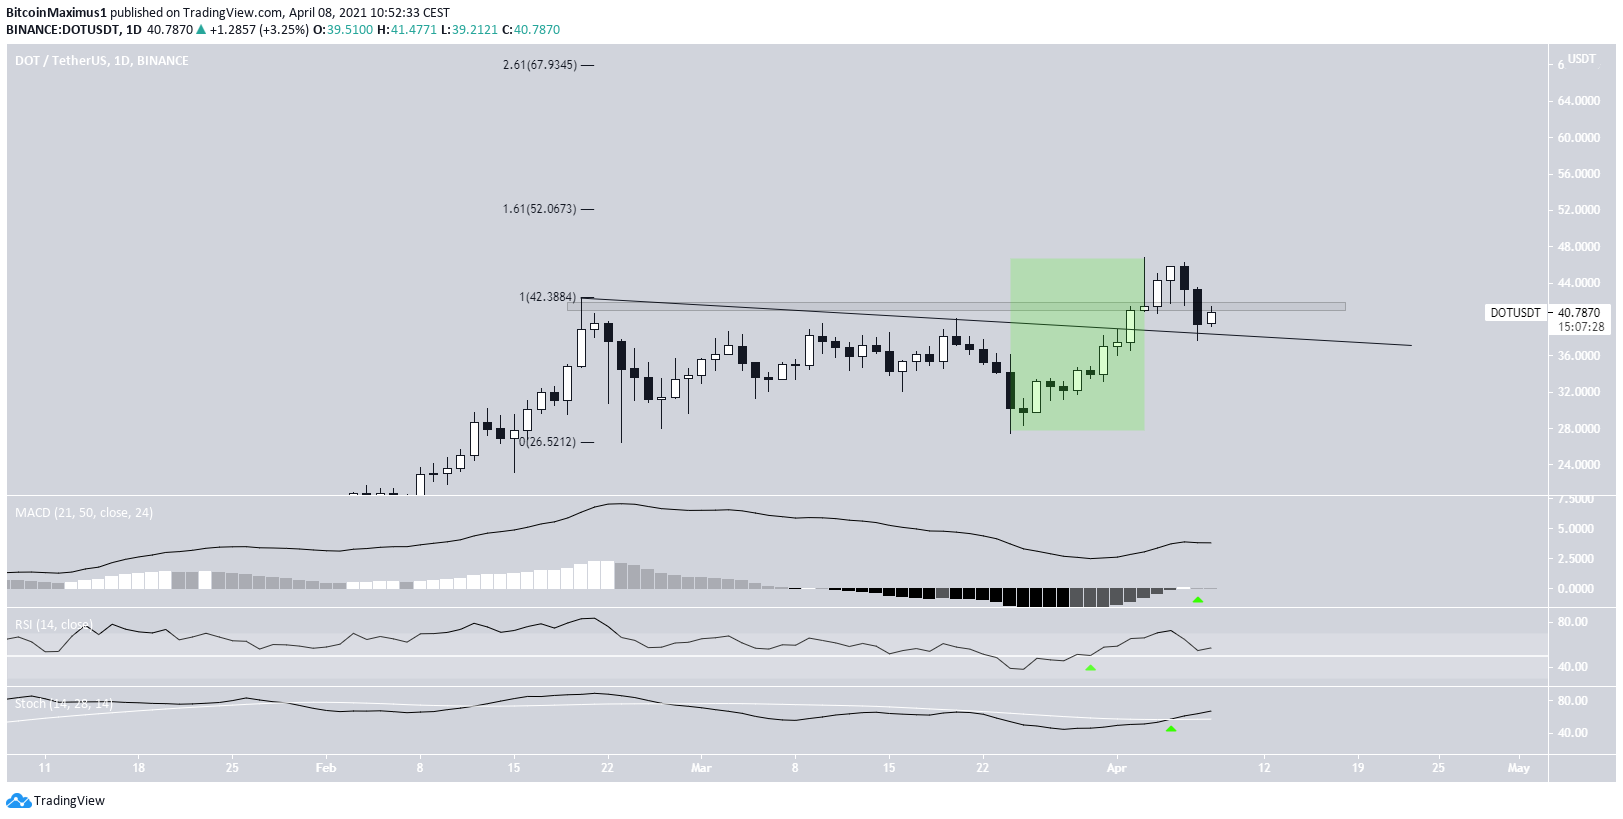
DOT has been increasing since March 24, when it traded at a local low of $27.45.
The upward movement that followed caused a breakout from a descending resistance line that had been in place since the previous all-time high.
In turn, this caused a new all-time high price of $46.80 to be reached on April 3.
Afterward, DOT returned to validate the prior descending resistance line. Currently, it’s attempting to reclaim the $39.50 level.
The movement that caused the breakout (highlighted in green) does look like the beginning of a new impulse. Therefore, DOT is expected to be successful in reclaiming the $41.50 area and gradually move towards the $52 and $68 levels.
This is also supported by a bullish cross in the Stochastic oscillator.
Highlights
- DOT has broken out from a descending resistance line.
- It’s attempting to reclaim the $41.50 resistance area.
For BeInCrypto’s latest bitcoin (BTC) analysis, click here.
Trusted
Disclaimer
In line with the Trust Project guidelines, this price analysis article is for informational purposes only and should not be considered financial or investment advice. BeInCrypto is committed to accurate, unbiased reporting, but market conditions are subject to change without notice. Always conduct your own research and consult with a professional before making any financial decisions. Please note that our Terms and Conditions, Privacy Policy, and Disclaimers have been updated.
