


Compound (COMP) has broken out from a short-term descending resistance line. It is now consolidating inside a corrective pattern.
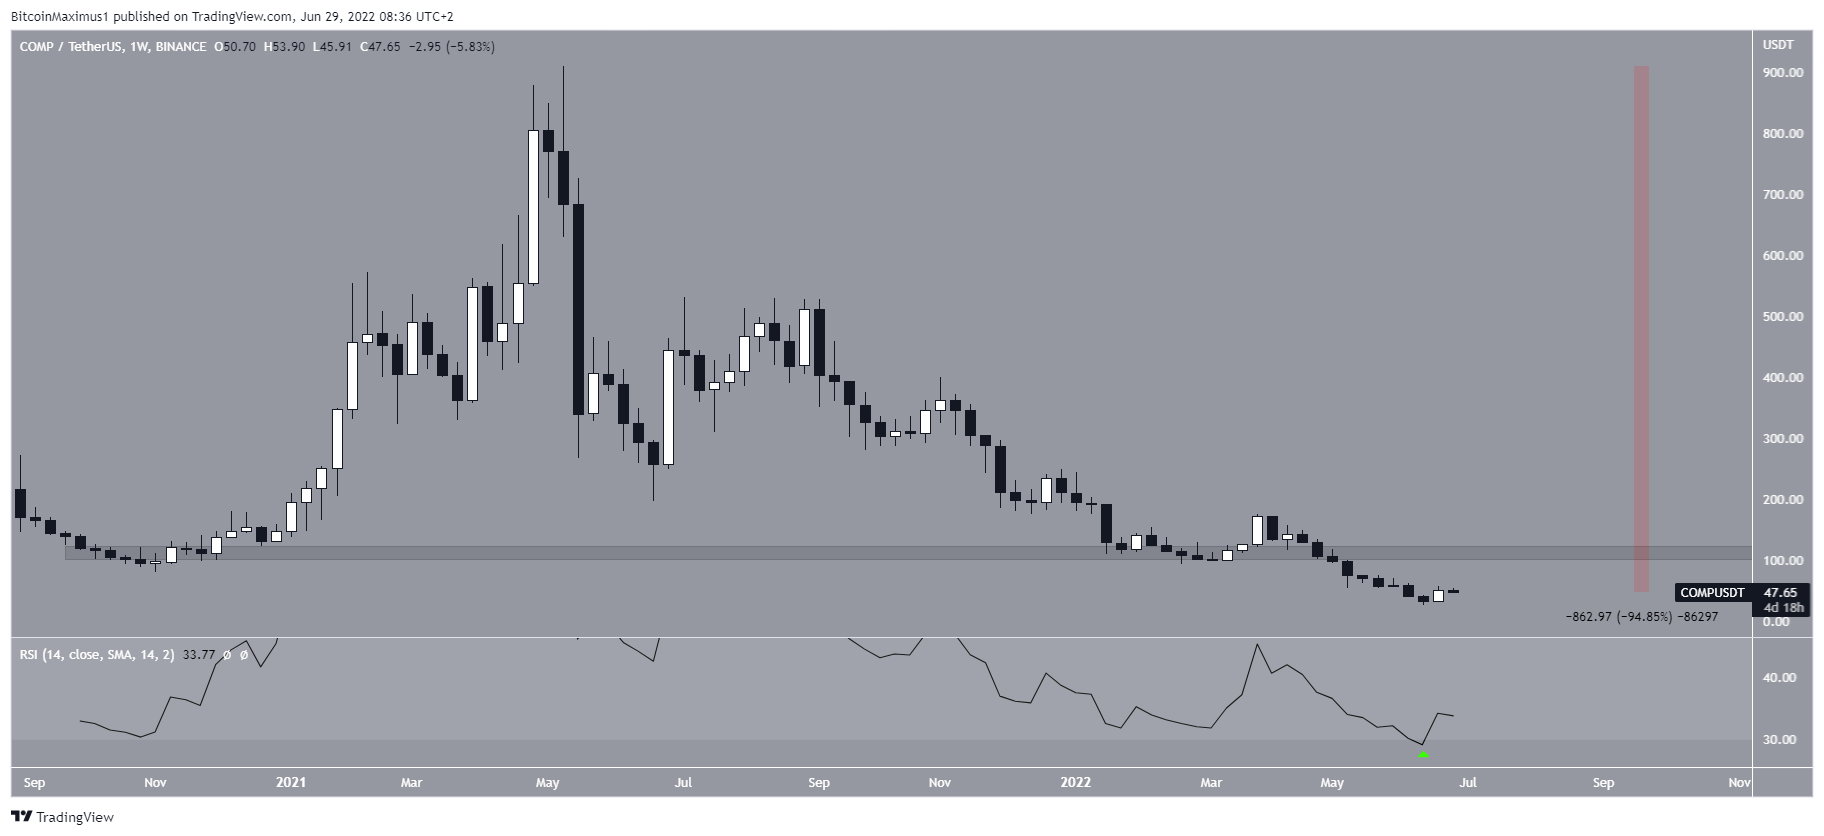
COMP has been falling since reaching an all-time high price of $911 in May 2021. The downward movement has so far led to a new all-time low price of $26.20 on June 18.
More importantly, this downward movement caused a decrease below the $110 area, which had been acting as support since 2020. The same area is now expected to provide resistance.
During the week of July 13 to 20, the RSI reached a new all-time low of 27 (green icon) and bounced, moving outside its oversold territory in the process.
While this is considered a bullish sign, the trend cannot be considered bullish until the $110 resistance area is reclaimed.
Measuring from the all-time high, the price has decreased by 95%.
Ongoing COMP breakout
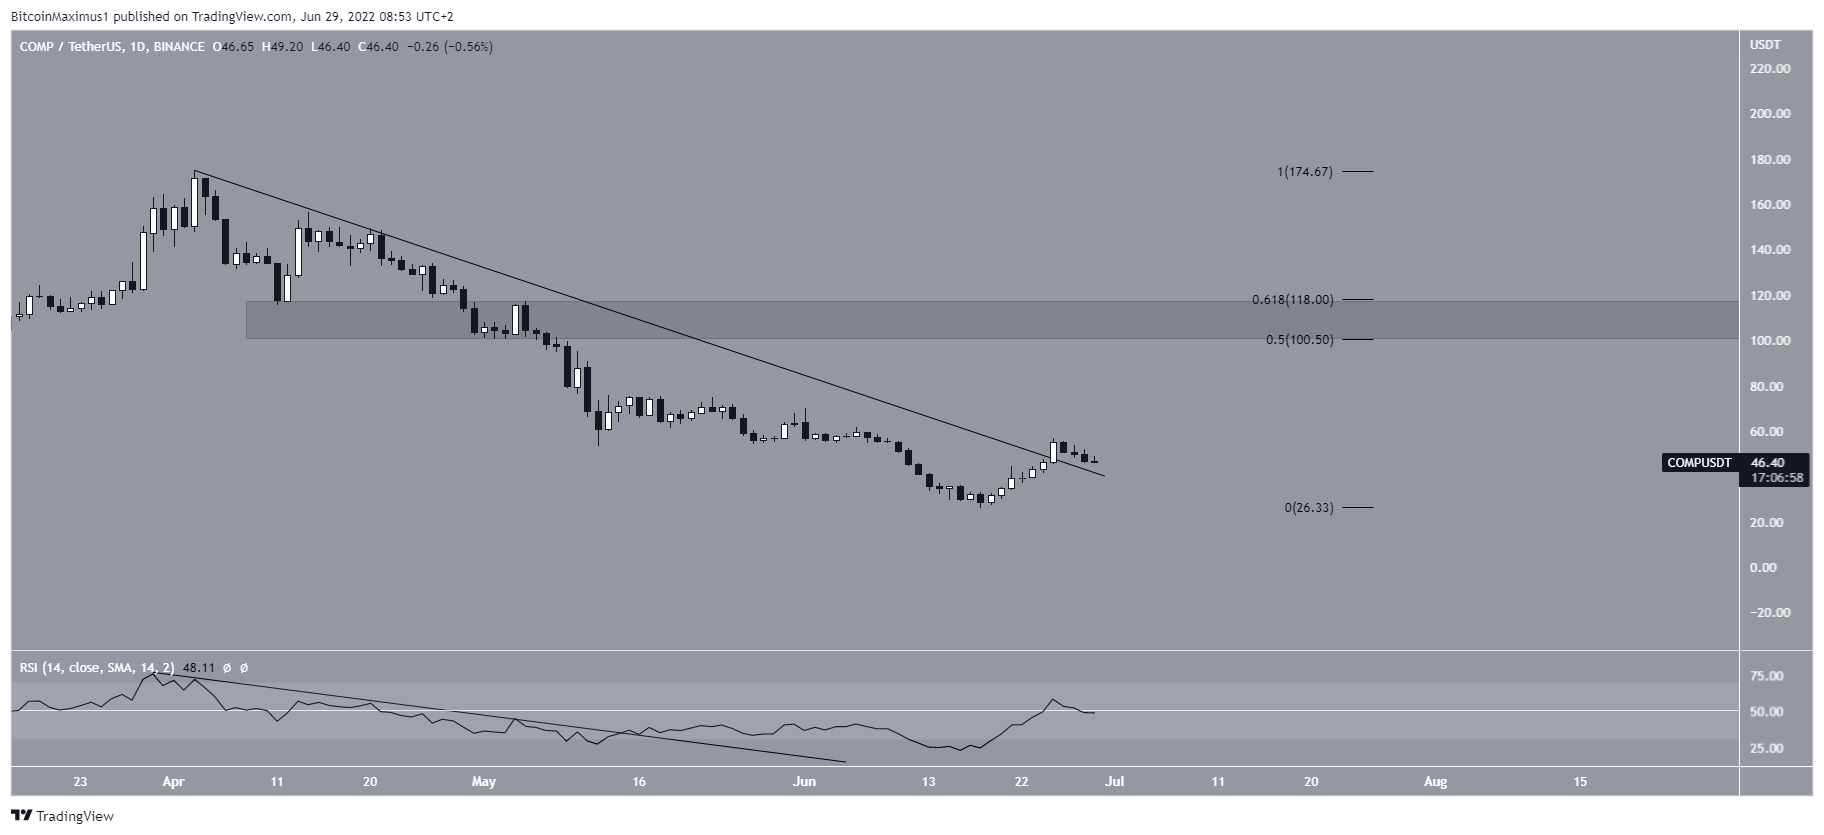
The daily chart shows that the price had been decreasing underneath a descending resistance line since March 28.
After reversing on June 18, the price managed to break out on June 26.
The daily RSI had also been decreasing below its own trend line, but managed to break out on May 17. After the price broke out, the RSI moved above 50, in what is considered a sign of a bullish trend.
If the upward movement continues, the next closest resistance area would be between $100 to $118, created by the 0.5-0.618 Fib retracement resistance levels. This also coincides with the previously outlined long-term resistance.
Short-term movement
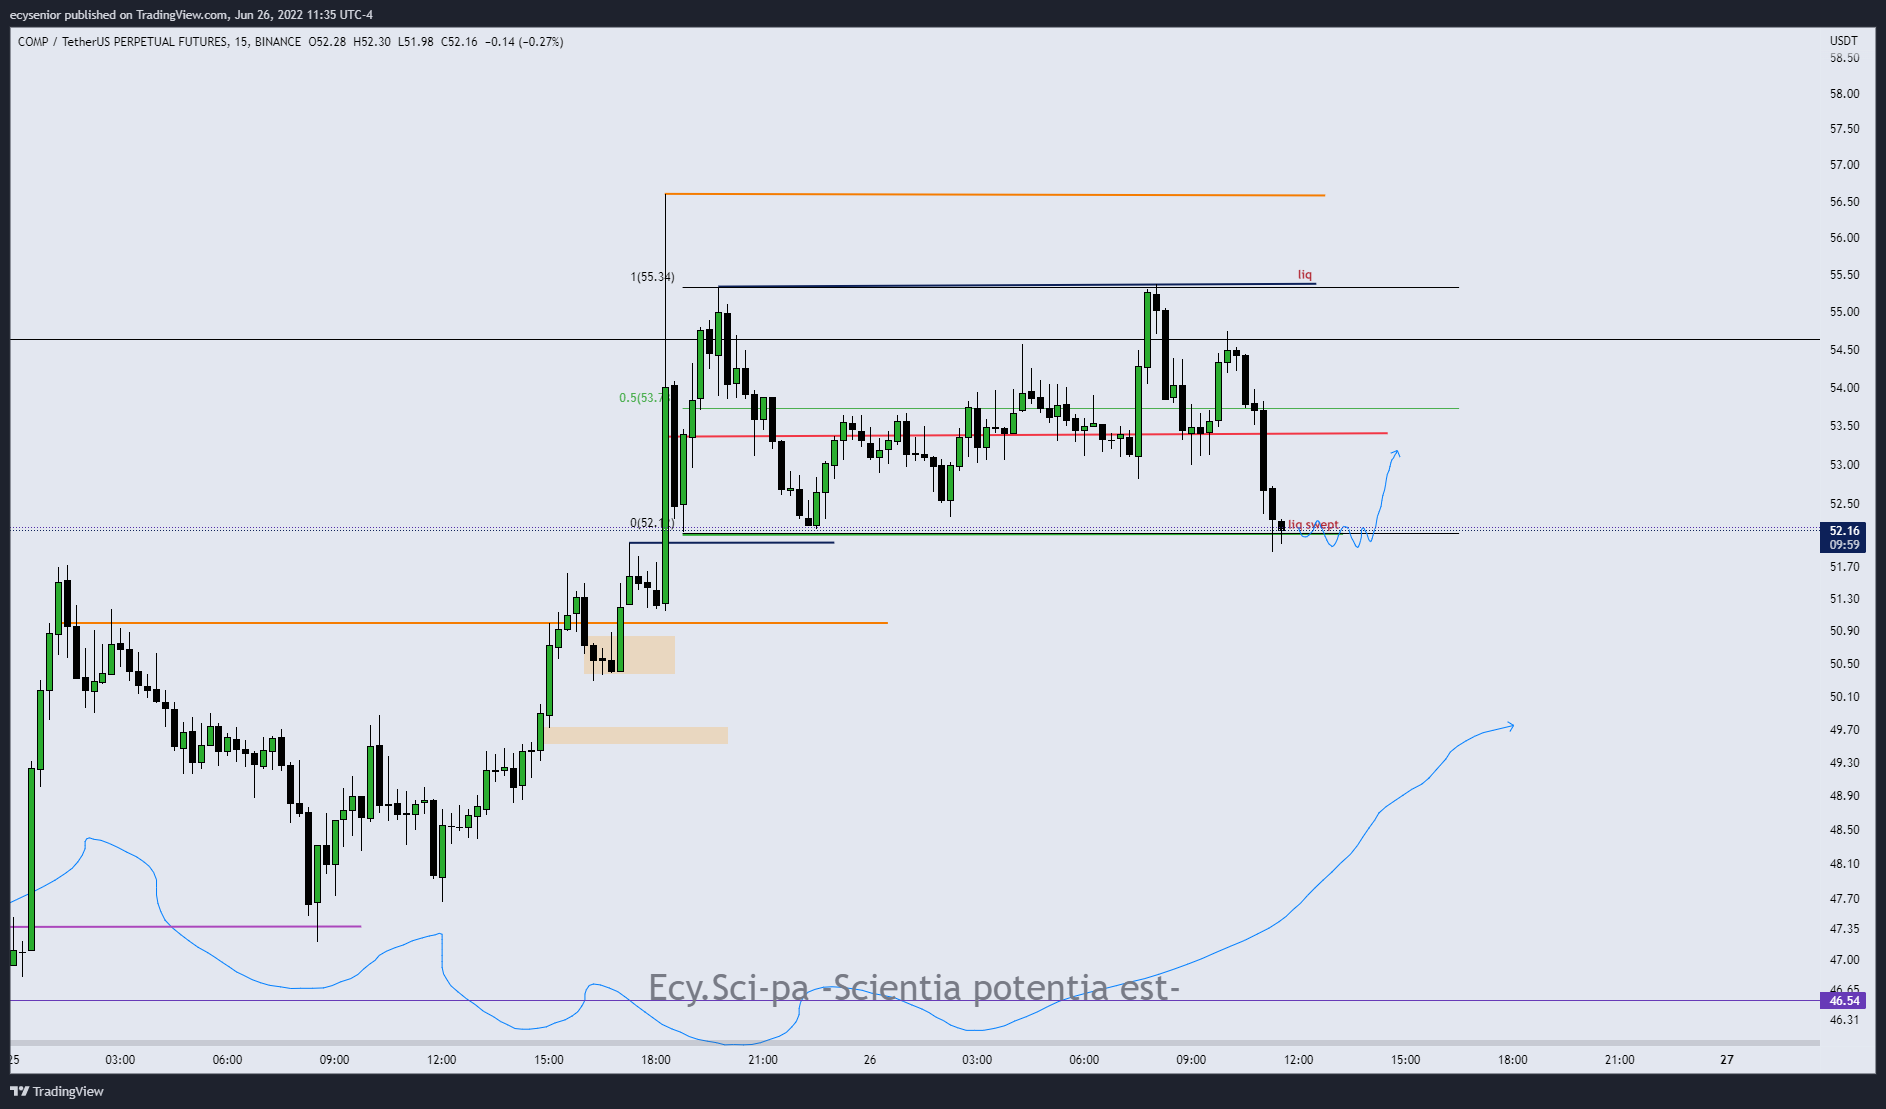
Cryptocurrency trader @traderECY tweeted a COMP chart, stating that the short-term movement looks bullish.
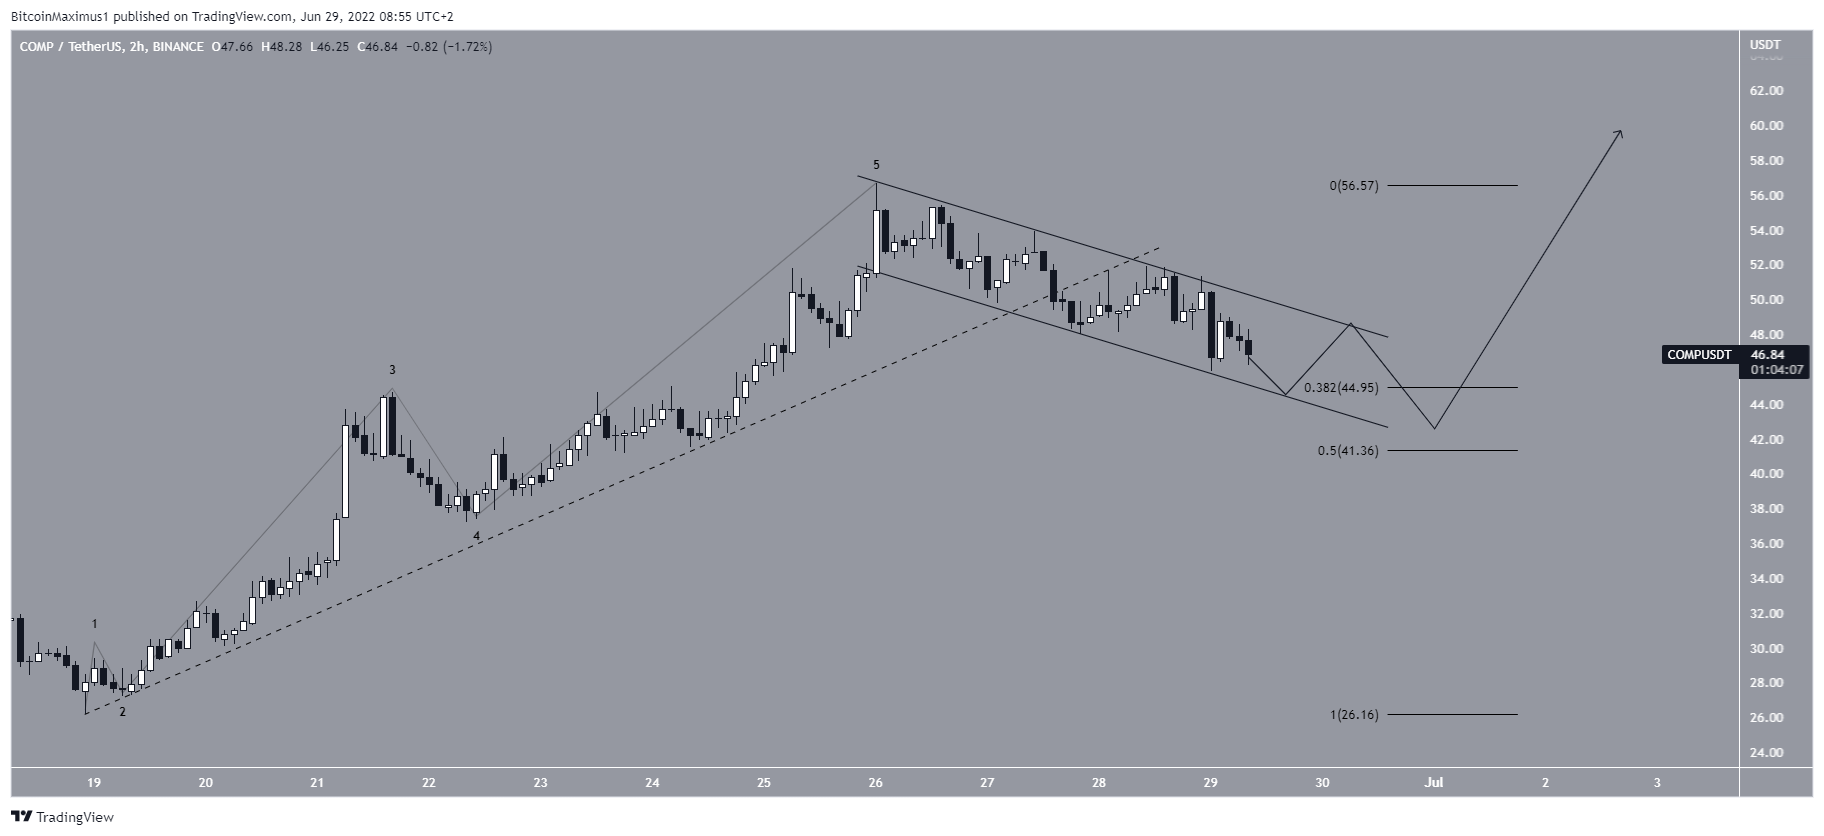
Since the June 18 low, the price has completed a five-wave upward movement, which led to a high of $56 on June 26.
Since then, the price has been falling inside a descending parallel channel. Such channels are usually considered corrective patterns, meaning that an eventual breakout would be likely.
This fits with the readings from the daily time frame that indicate another upward movement is likely.
For Be[in]Crypto’s latest bitcoin (BTC) analysis, click here


