

The Compound (COMP) price has created a bullish reversal pattern inside a significant support area and is expected to continue moving upwards.
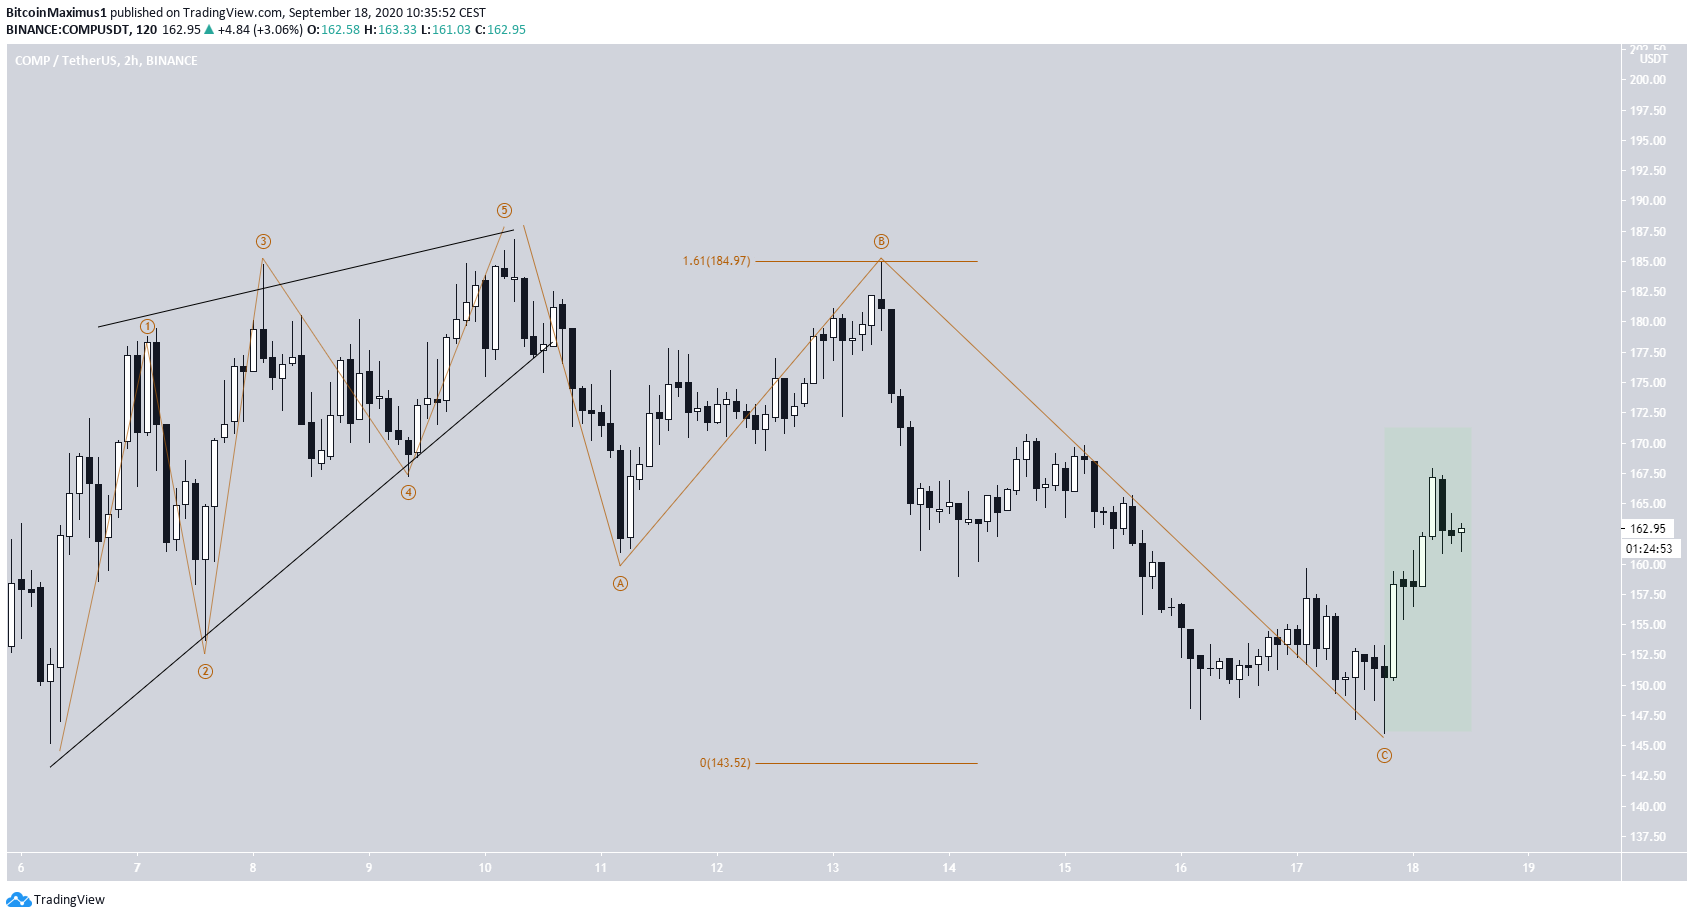
The COMP price has been decreasing since Sept 1, when it reached briefly hit a high of $272.61. On Sept 18, it had bounced at the $145 support area, which is the 0.786 fib level of the preceding upward move.
COMP Hits Double-Bottom
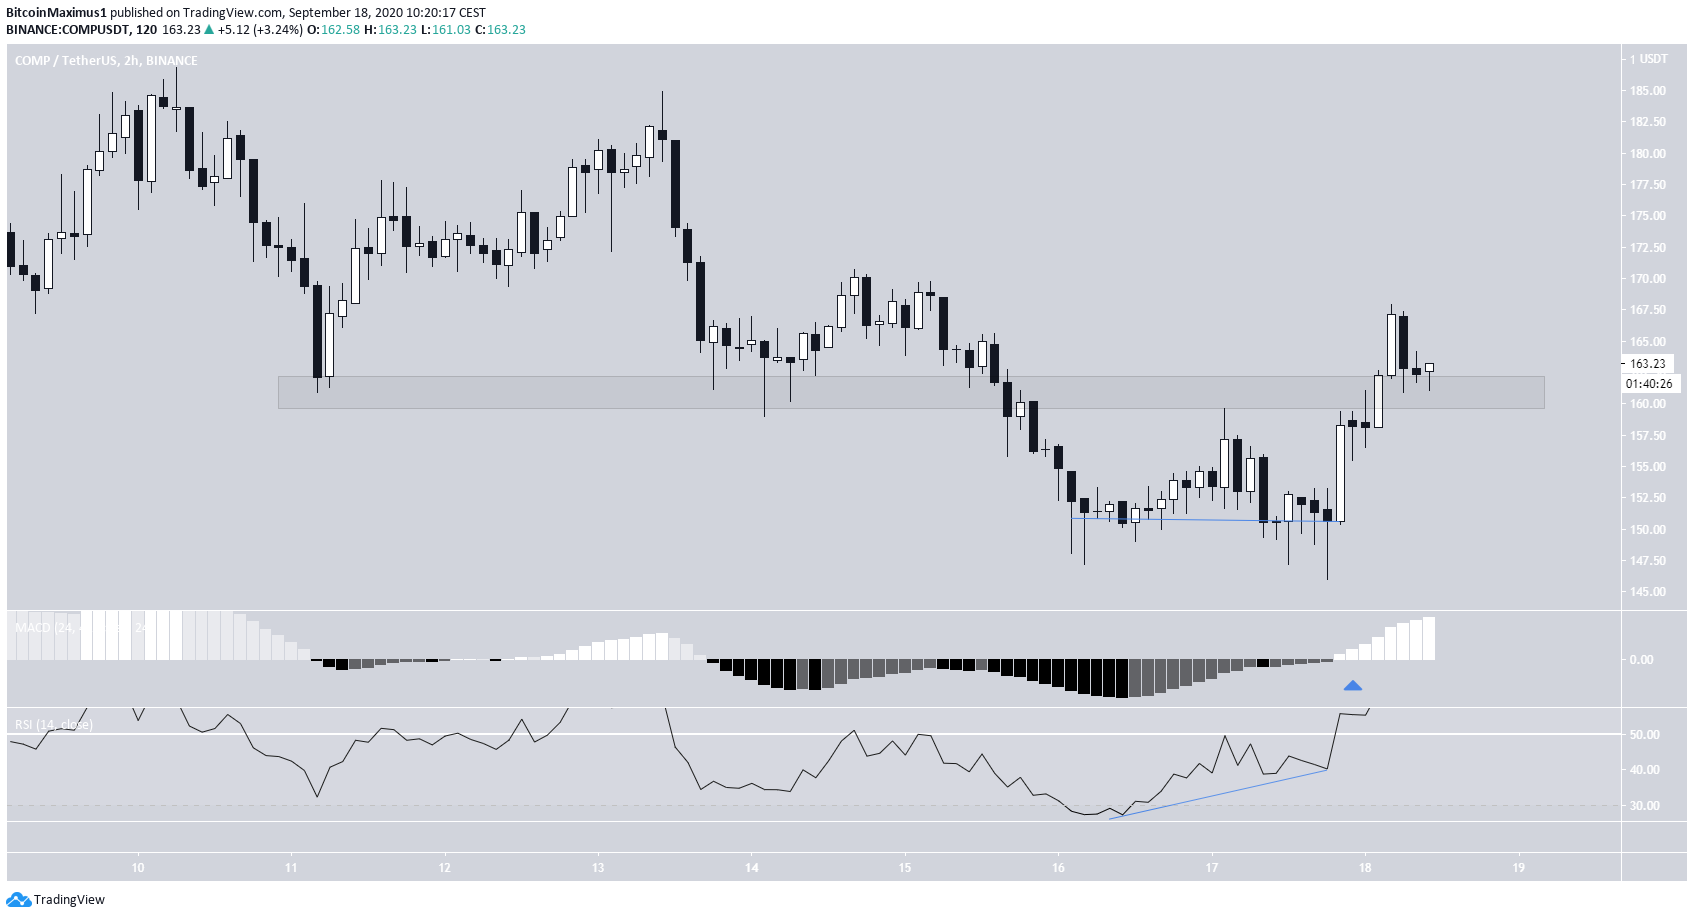
Inside the support area, COMP has seemingly completed a double-bottom, which is normally considered a bullish reversal pattern. The pattern has been combined with lower wicks in both bottoms, a sign of buying pressure.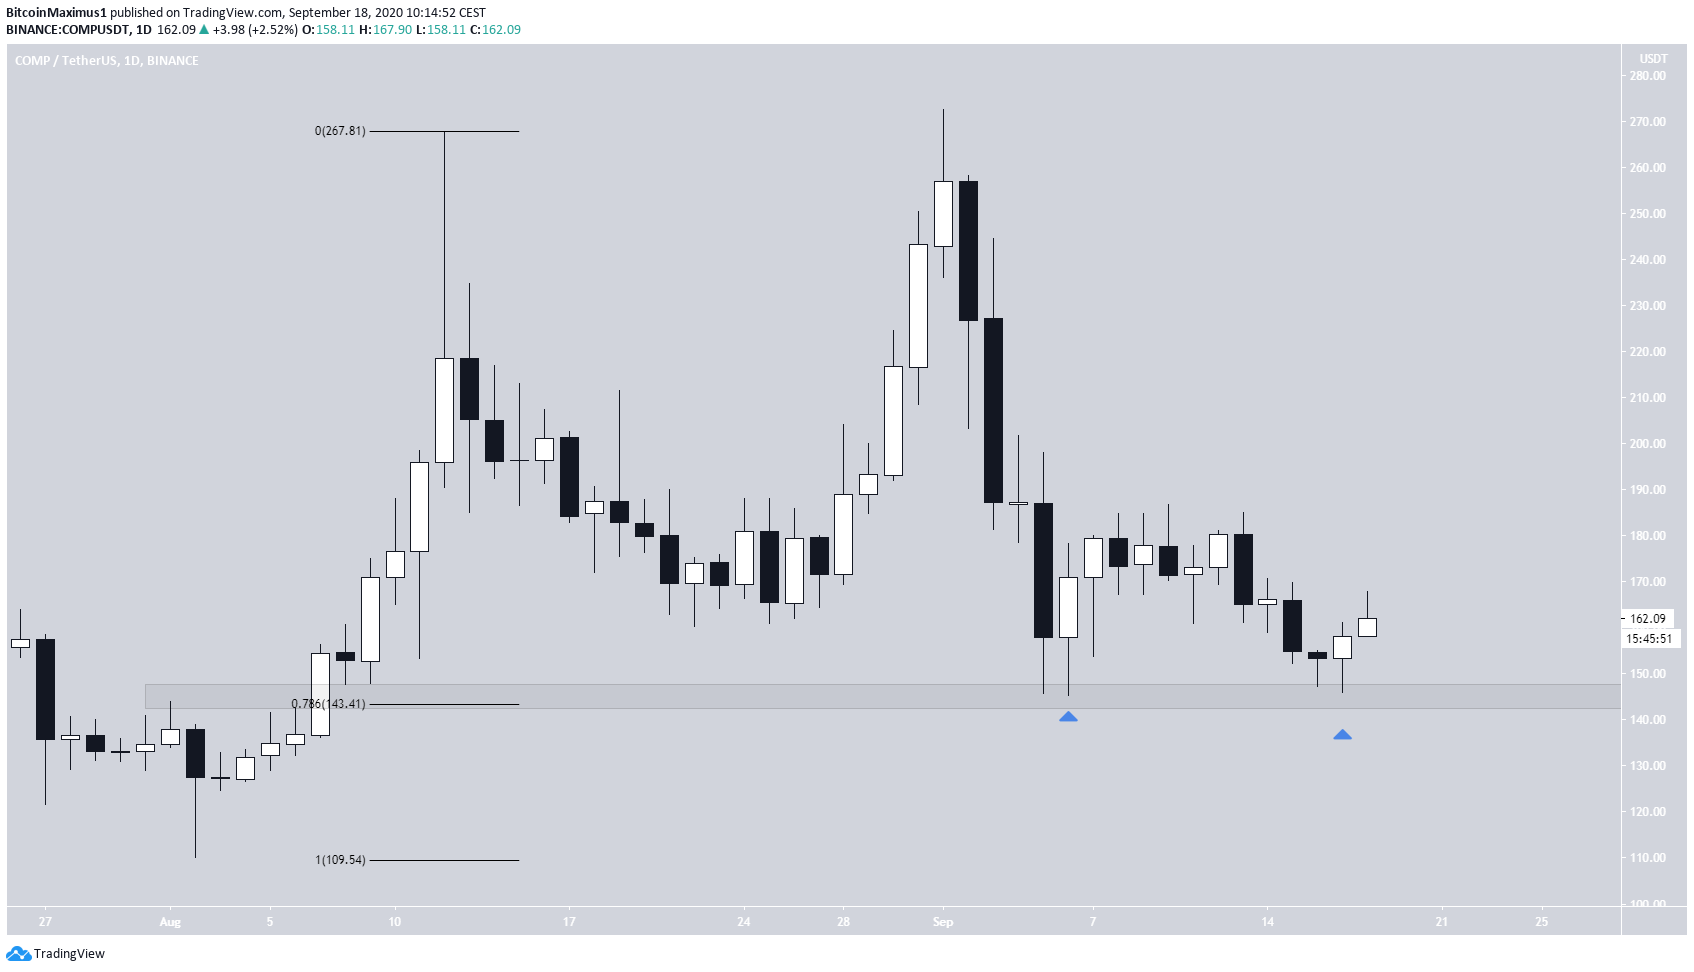
Possible Reversal
In the daily time-frame, technical indicators do not show any signs of reversal in the form of bullish divergences or bullish crosses. On the contrary, the successive lower closes are a sign of bearishness.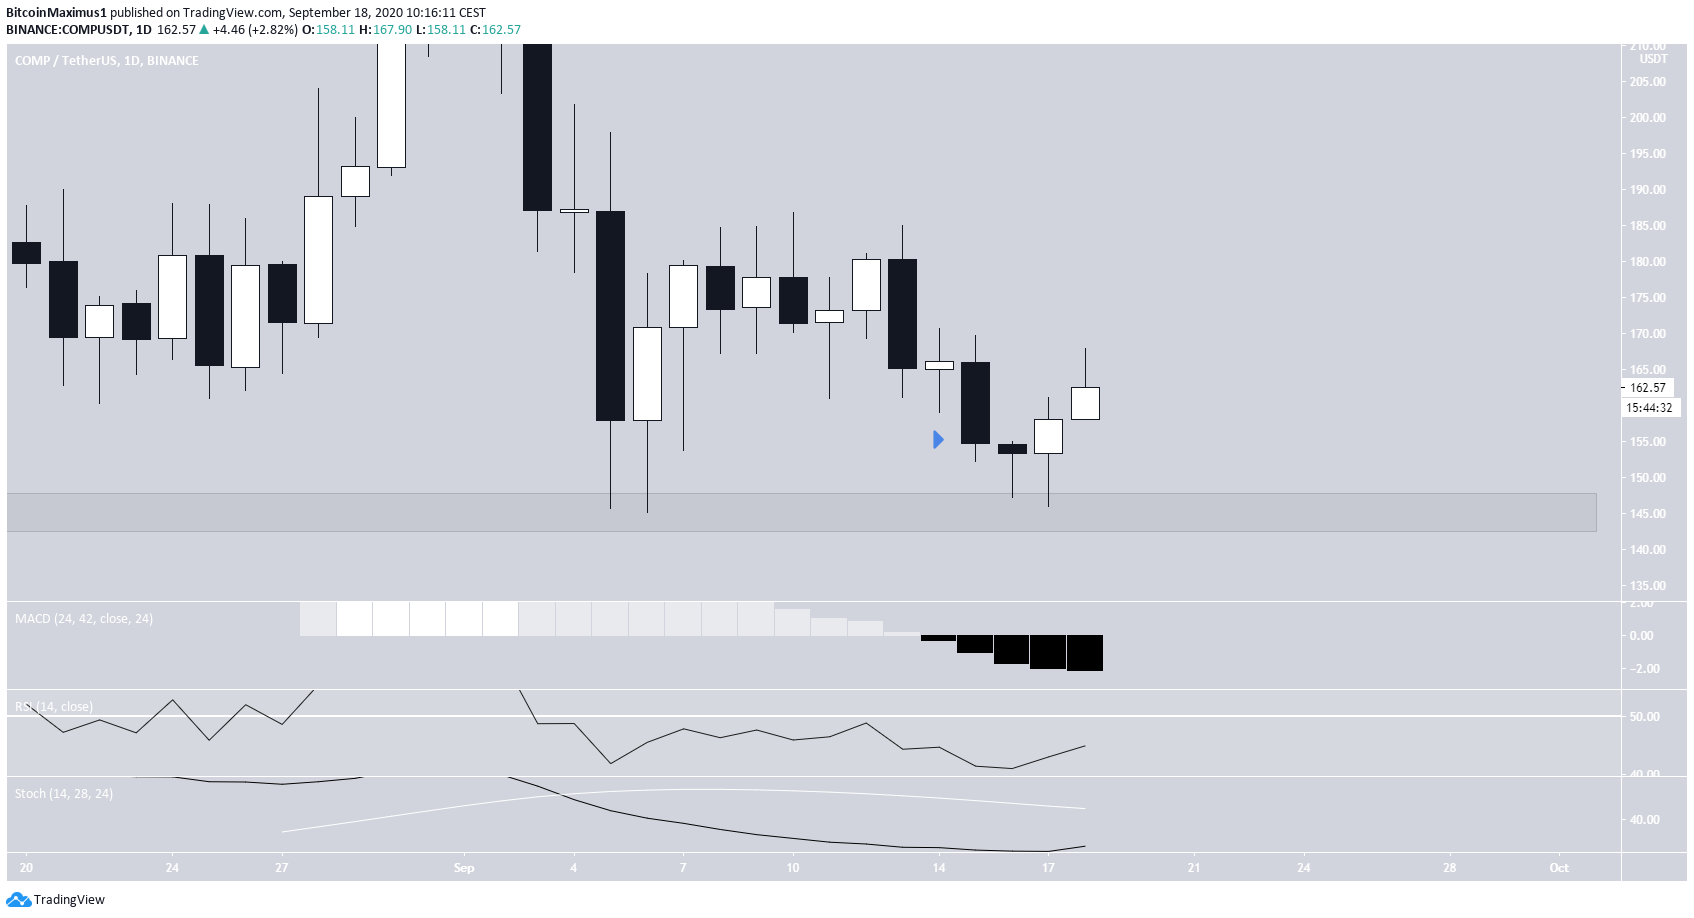
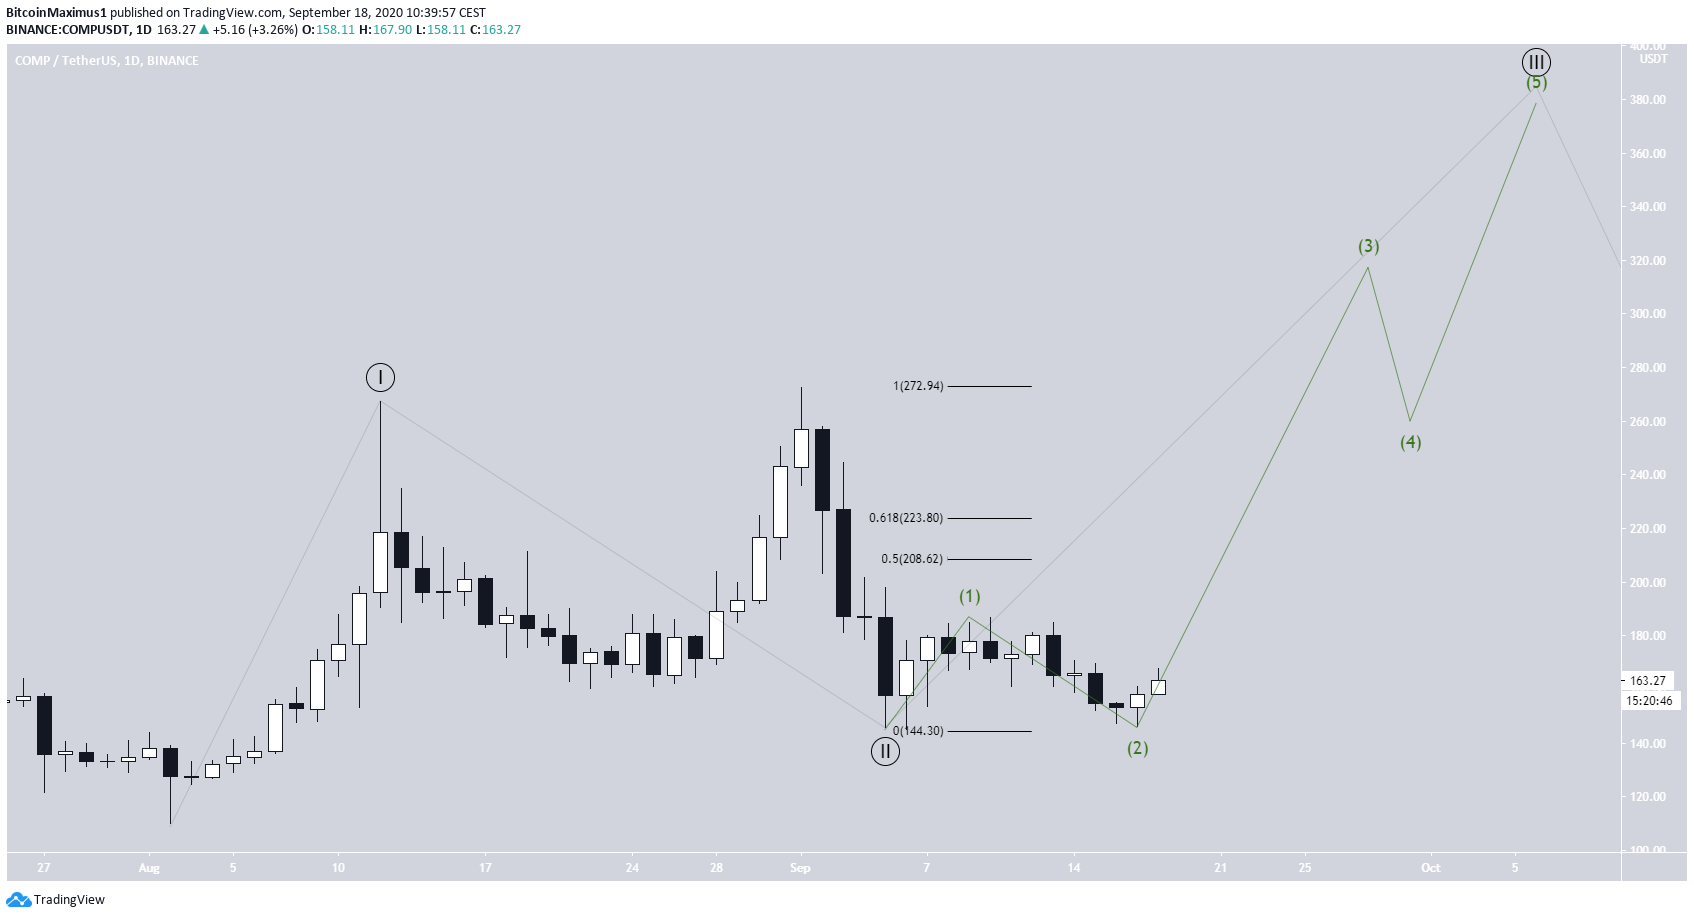
Wave Count
Cryptocurrency trader @theTradingHubb outlined a COMP chart that predicts the price retracing in the short-term before eventually resuming its upward movement towards new all-time highs.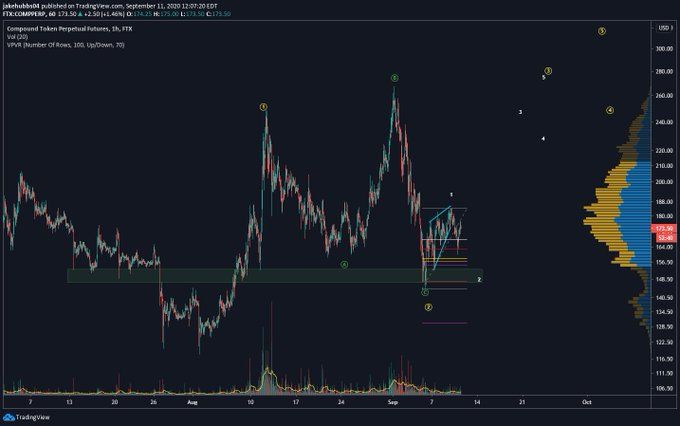
Top crypto platforms in the US

 eToro
Explore
Explore
Explore
Explore
eToro
Explore
Explore
Explore
Explore
Don’t invest unless you’re prepared to lose all
the money you invest.
This is a high-risk investment and you should not expect to be protected if something goes wrong.
Take 2 mins to learn more
Don’t invest unless you’re prepared to lose all
the money you invest.
This is a high-risk investment and you should not expect to be protected if something goes wrong.
Take 2 mins to learn more
Don’t invest unless you’re prepared to lose all
the money you invest.
This is a high-risk investment and you should not expect to be protected if something goes wrong.
Take 2 mins to learn more
Don’t invest unless you’re prepared to lose all
the money you invest.
This is a high-risk investment and you should not expect to be protected if something goes wrong.
Take 2 mins to learn more
Don’t invest unless you’re prepared to lose all
the money you invest.
This is a high-risk investment and you should not expect to be protected if something goes wrong.
Take 2 mins to learn more
Don’t invest unless you’re prepared to lose all
the money you invest.
This is a high-risk investment and you should not expect to be protected if something goes wrong.
Take 2 mins to learn more
Top crypto platforms in the US
Uphold
eToro
eToro
eToro
eToro
Plus500
Coinbase
Moonacy
Don’t invest unless you’re prepared to lose all
the money you invest.
This is a high-risk investment and you should not expect to be protected if something goes wrong.
Take 2 mins to learn more
Don’t invest unless you’re prepared to lose all
the money you invest.
This is a high-risk investment and you should not expect to be protected if something goes wrong.
Take 2 mins to learn more
Don’t invest unless you’re prepared to lose all
the money you invest.
This is a high-risk investment and you should not expect to be protected if something goes wrong.
Take 2 mins to learn more
Disclaimer
In line with the Trust Project guidelines, this price analysis article is for informational purposes only and should not be considered financial or investment advice. BeInCrypto is committed to accurate, unbiased reporting, but market conditions are subject to change without notice. Always conduct your own research and consult with a professional before making any financial decisions. Please note that our Terms and Conditions, Privacy Policy, and Disclaimers have been updated.

Valdrin Tahiri
Valdrin discovered cryptocurrencies while he was getting his MSc in Financial Markets from the Barcelona School of Economics. Shortly after graduating, he began writing for several different cryptocurrency related websites as a freelancer before eventually taking on the role of BeInCrypto's Senior Analyst.
(I do not have a discord and will not contact you first there. Beware of scammers)
READ FULL BIO
Sponsored
Sponsored