


The Bitcoin (BTC) price has been decreasing since it was rejected at $11,100 on Sept 16.
However, the price is expected to reverse its trend soon and create another higher high.
Bitcoin Grinds Upwards
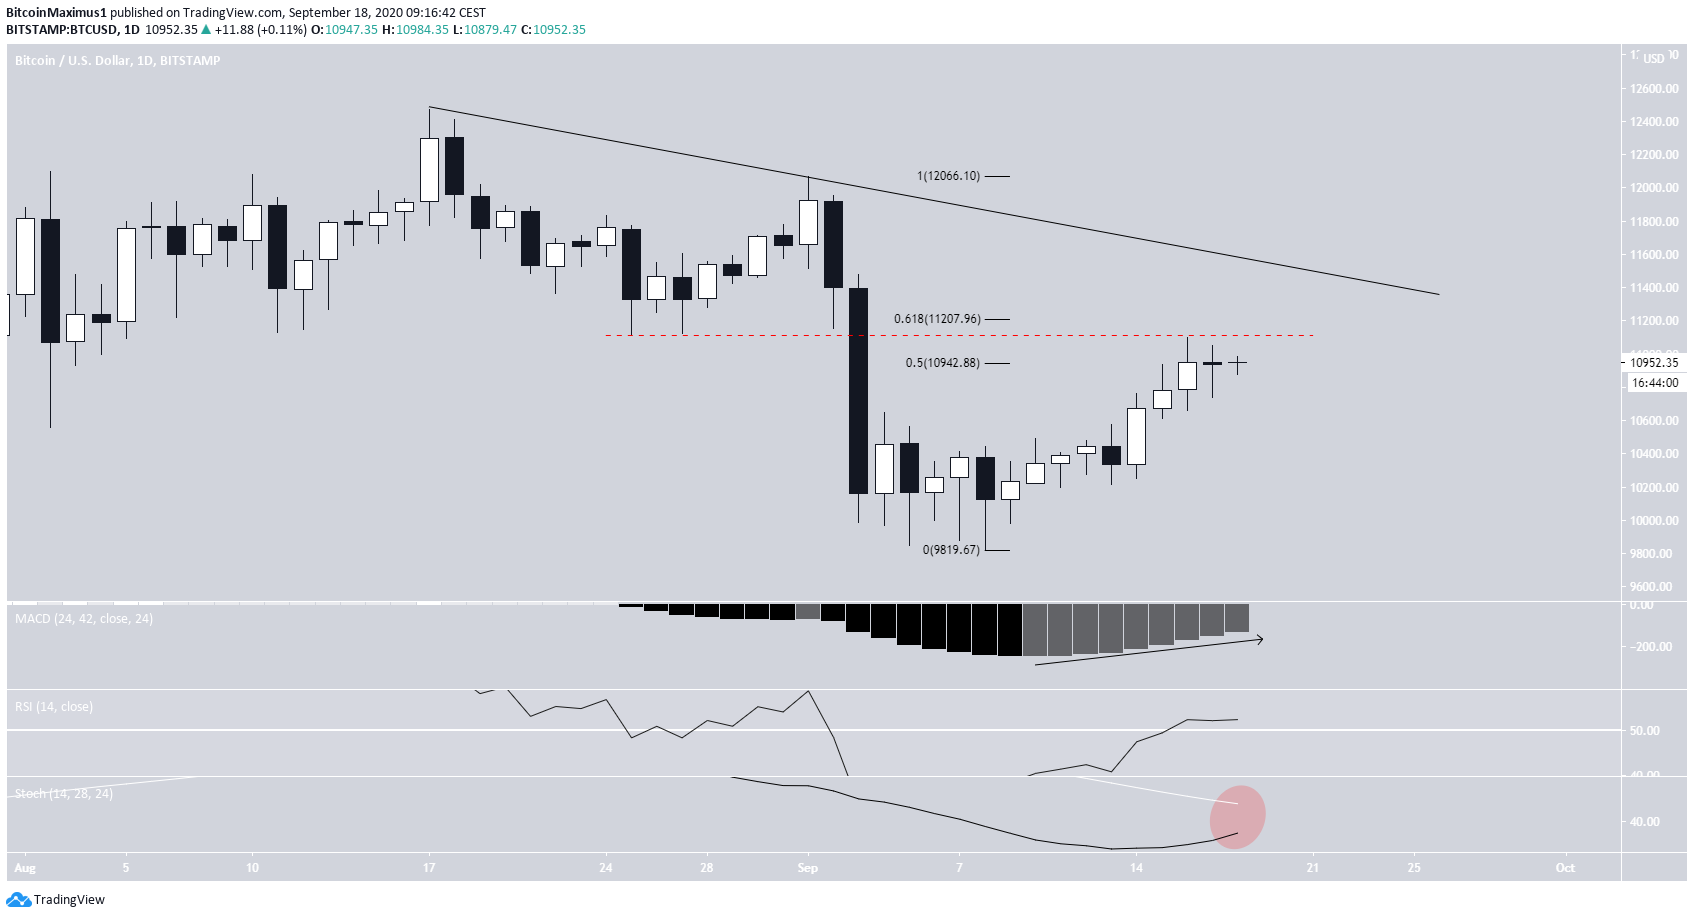
On Sept 16, the Bitcoin price reached a high of $11,100 between the 0.5-0.618 Fib levels of the entire downward move.
Interestingly, BTC did not breach the $11,112 low that was reached on Aug 25. If that were to occur, it would invalidate several longer-term bearish wave counts that are still possible, even if unlikely.
In addition, the price has not yet reached the descending resistance line that is created by tracing the two most recent lower-highs.
Technical indicators are bullish but have not yet confirmed the beginning of a new upward trend. Confirmation would likely come in the form of a MACD cross into positive territory, the RSI moving above the 50-line, and/or a bullish cross in the Stochastic Oscillator.
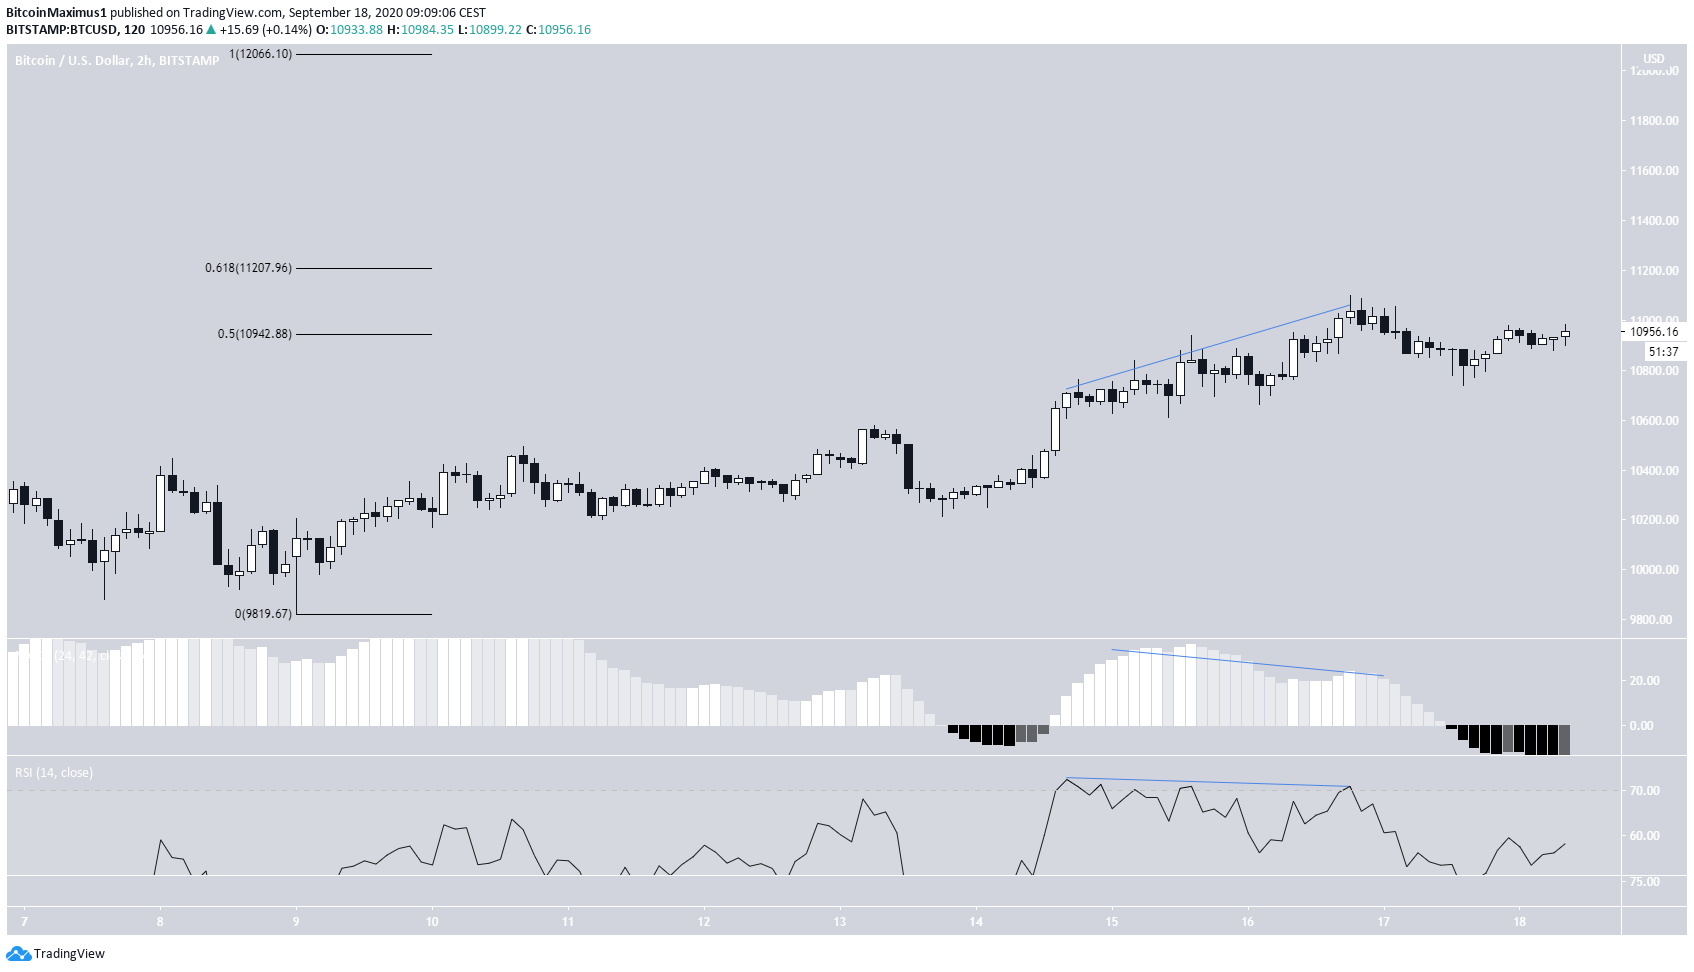
On Sept 14, the Bitcoin price began to grind upwards slowly. The increase continued for two days when the price reached a local high of $11,100. Throughout this time, there has been a considerable bearish divergence in both the RSI and the MACD, and their trends have yet to be broken
A small decrease has already transpired as a result of the divergence, and the MACD has begun to move upwards from its negative territory, possibly suggesting that the price will soon resume its upward movement.
Correction or Upward Move?
The most likely wave count up to this point has been one in which the price is still correcting in wave 4 (in orange below) of a bearish five-wave formation. However, the length and shape of the wave have put the formation in doubt, indicating that it’s more likely that the price has now begun a bullish impulse.
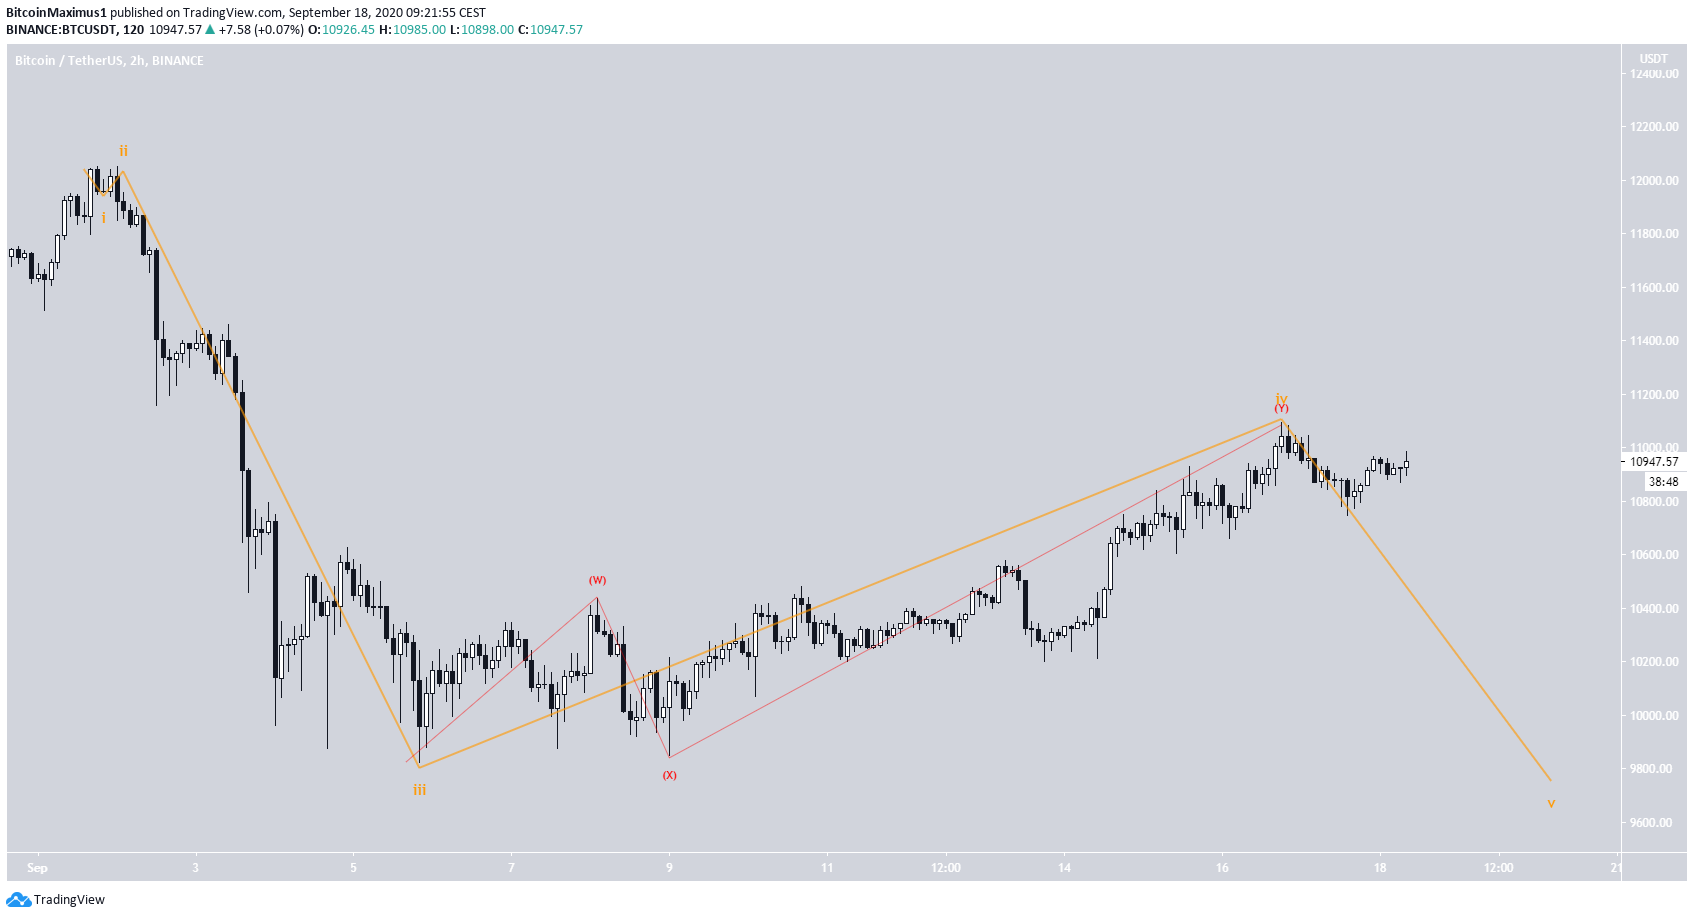
If true, BTC began a new upward move on Sept 9 (in red below).
The most helpful way to determine if this is a case would be the break of sub-wave 1 high (in red below) at $10,483. A price decrease back to this level would both break the wave 0-2 ascending support line (black) and invalidate the wave 4 rule.
If the price bounces near $10,500, it would almost certainly confirm that BTC is heading higher.
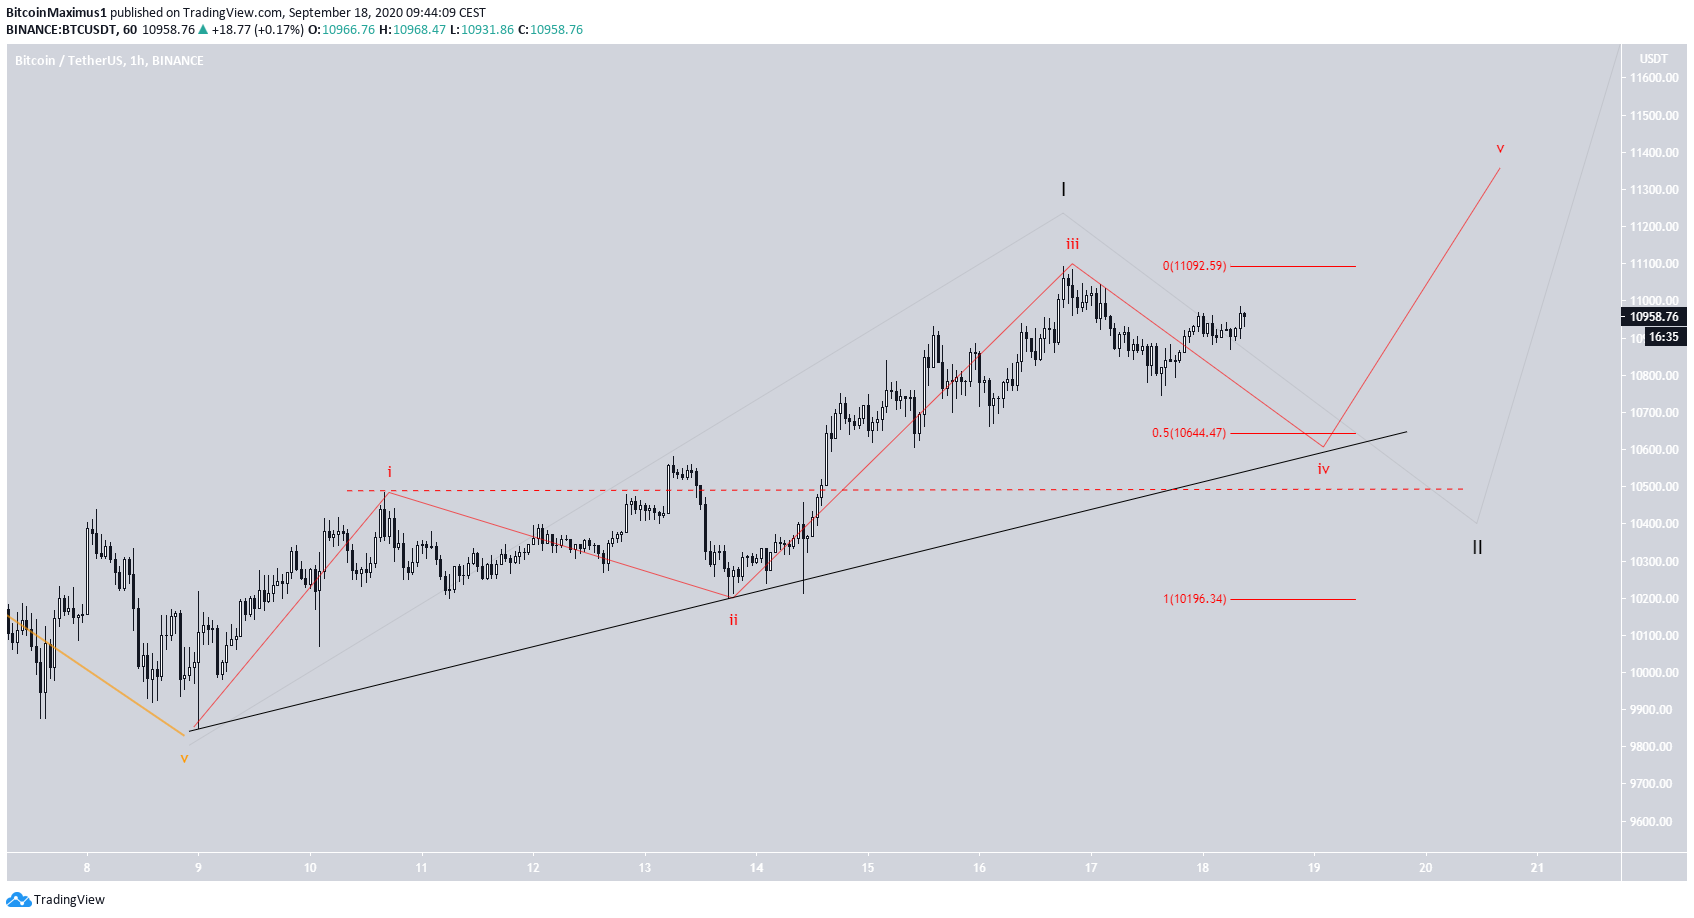
To conclude, the Bitcoin price has begun to show short-term weakness which could cause a drop towards $10,600. However, it is looking more likely that BTC has begun a new impulse rather than correcting.
For BeInCrypto’s previous Bitcoin analysis, click here!


