
Be[in]Crypto takes a look at the five cryptocurrencies that increased the most last week, more specifically, from Aug 19 to 26.
These cryptocurrencies are:
- EOS (EOS): 25.85%
- Theta Fuel (TFUEL): 19.63%
- Chiliz (CHZ): 18.31%
- Cosmos (ATOM): 18.14%
- Decred (DCR): 12.63%
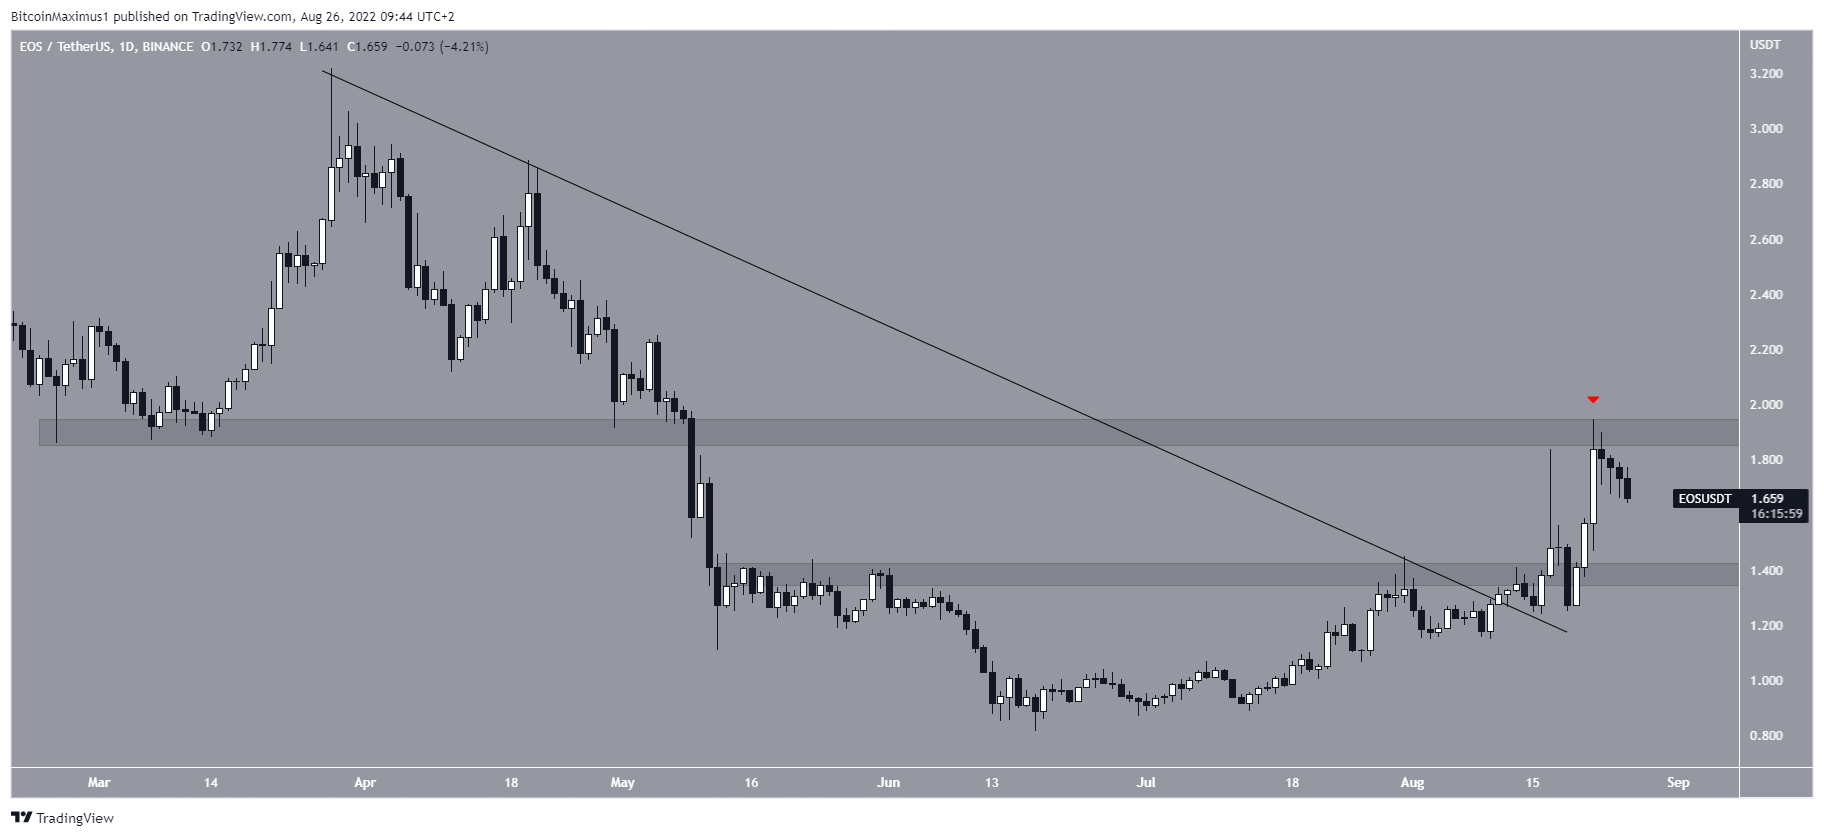
EOS
EOS has been increasing since June 18 and broke out from a descending resistance line on Aug. 12. The breakout led to a high of $1.95 on Aug 22.
This caused a rejection from the $1.90 resistance area and created a long upper wick. EOS has been falling since. If the decrease continues, the closest support area is at $1.40.
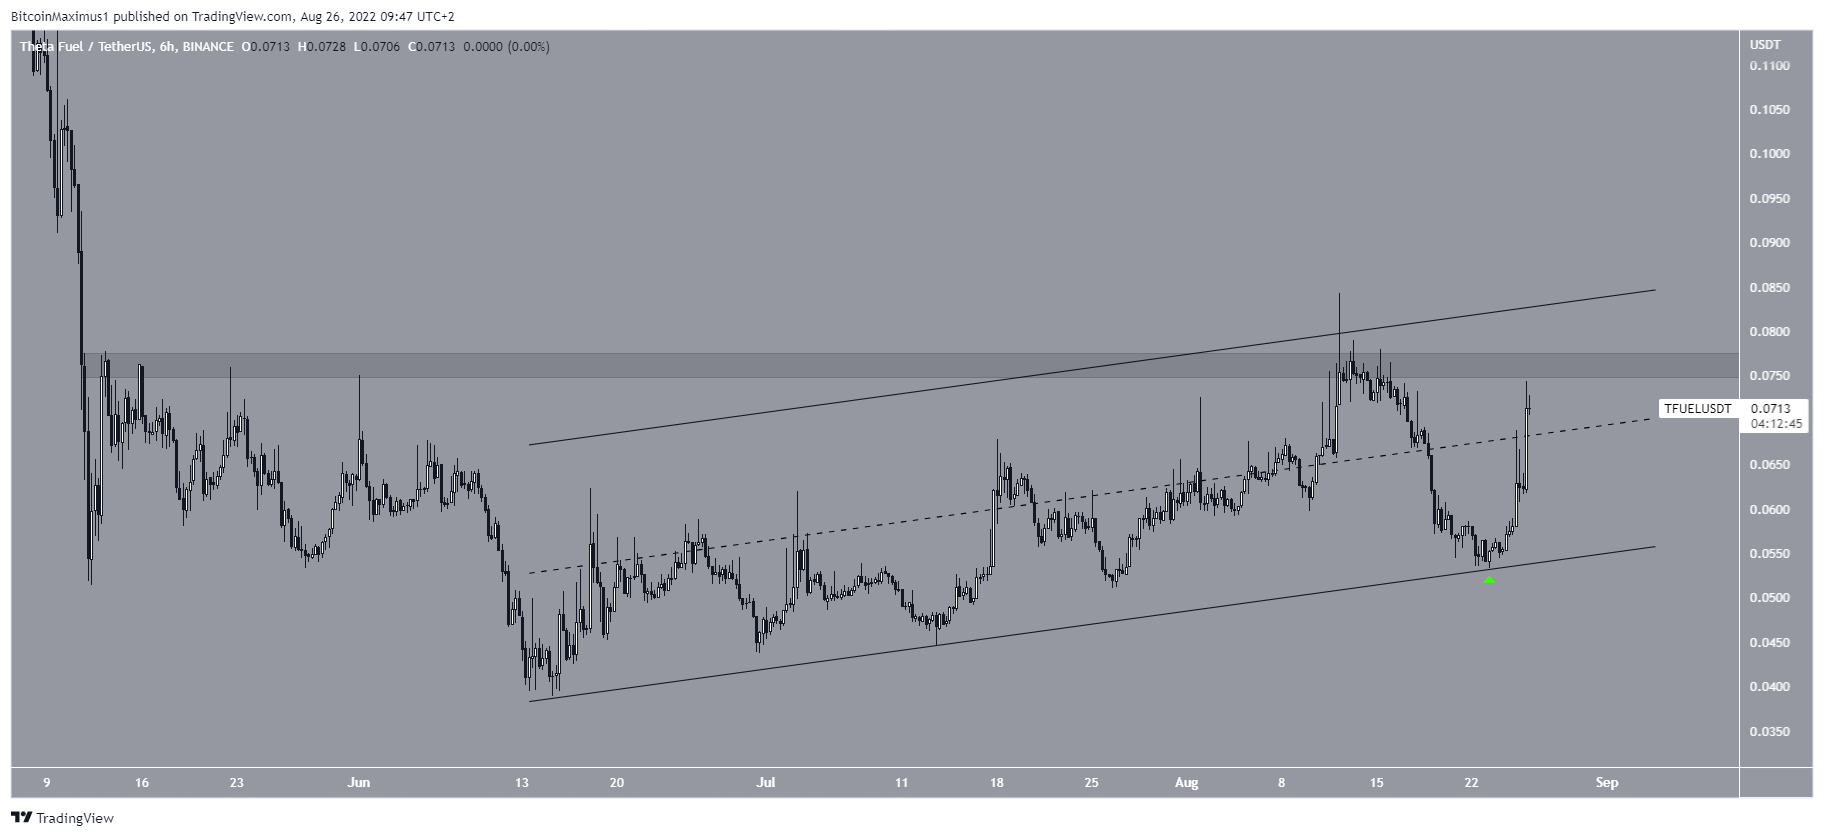
TFUEL
TFUEL has been increasing inside an ascending parallel channel since June 18. On Aug 23, it bounced at the support line of the channel and initiated a sharp upward movement (green icon). This caused a reclaim of the middle of the channel on Aug 25.
The closest resistance area is at $0.077. If TFUEL is successful in moving above it, a breakout from the channel would be expected.
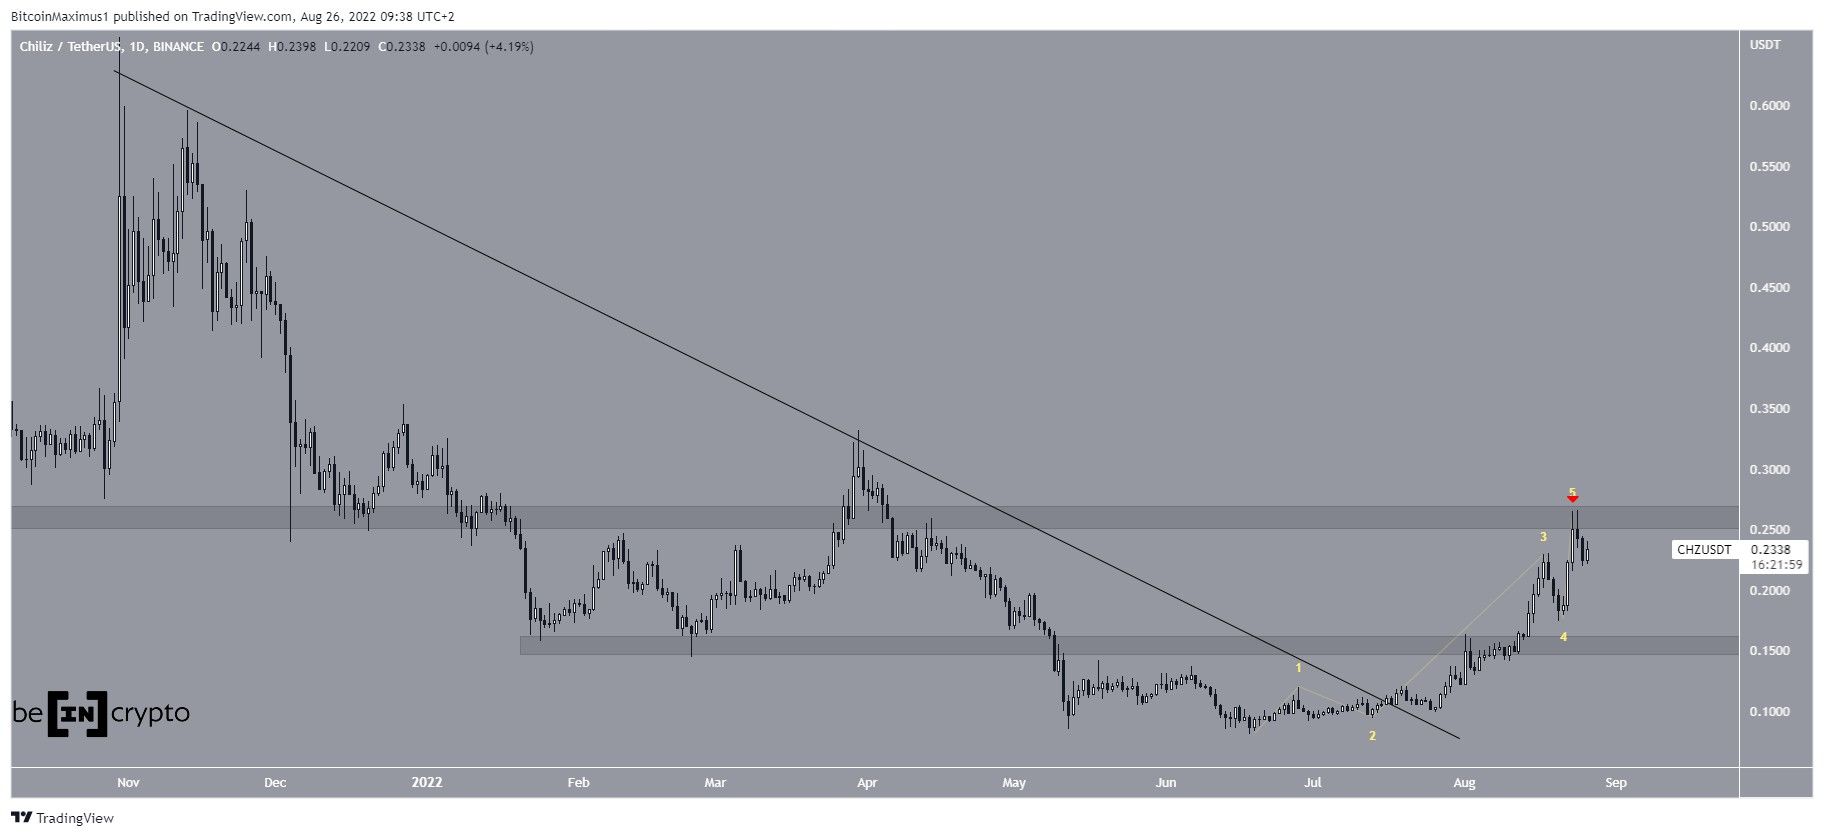
CHZ
CHZ has been increasing since June 18. The upward movement caused a breakout from a descending resistance line and led to a high of $0.26 on Aug 23.
The entire upward movement looks like a completed five wave structure. However, CHZ was rejected by the $0.28 resistance area (red icon) and has been decreasing since. If the downward movement continues, the closest support area is at $0.155.
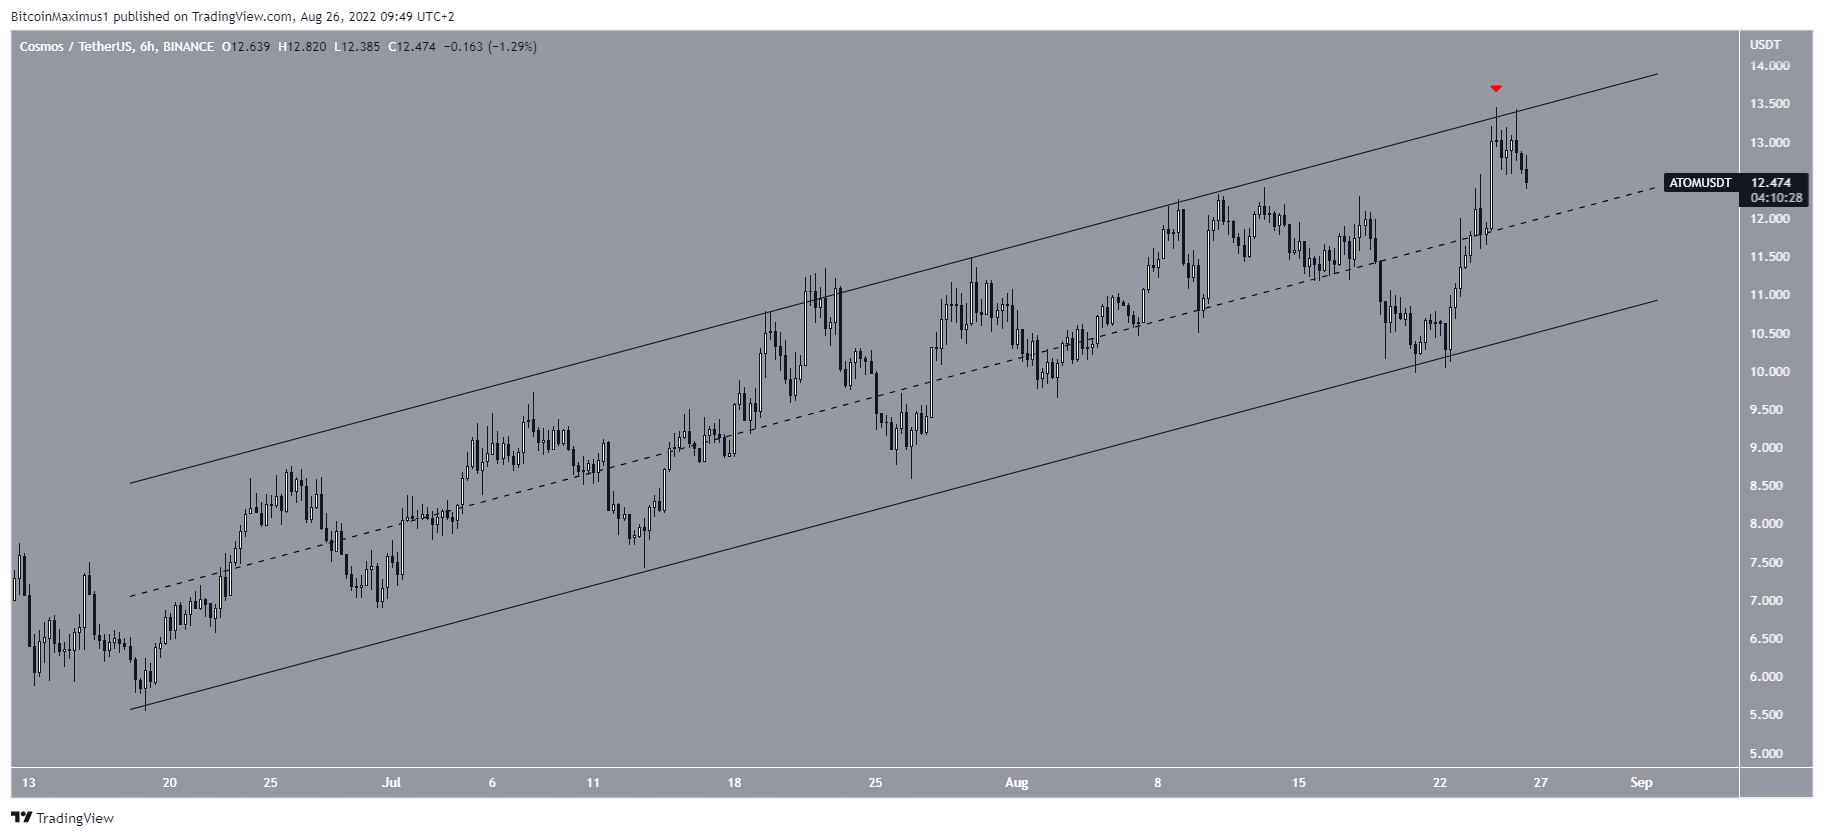
ATOM
Similarly to TFUEL, ATOM has been increasing inside an ascending parallel channel since June 19. The movement inside it has been extremely choppy, suggesting that the movement is corrective. If so, a breakdown from the channel would be likely.
On Aug 23, ATOM was rejected by the resistance line of the channel (red icon). A decrease below the middle of the channel would make a breakdown more likely.
DCR
DCR has been decreasing underneath a descending resistance line since Dec 2021. The line has so far caused four rejections (red icons), the most recent on Aug 5.
The trend cannot be considered bullish until DCR manages to break out from this line.

For Be[in]Crypto’s latest Bitcoin (BTC) analysis, click here
Disclaimer
In line with the Trust Project guidelines, this price analysis article is for informational purposes only and should not be considered financial or investment advice. BeInCrypto is committed to accurate, unbiased reporting, but market conditions are subject to change without notice. Always conduct your own research and consult with a professional before making any financial decisions. Please note that our Terms and Conditions, Privacy Policy, and Disclaimers have been updated.
