

Chiliz (CHZ) has broken out from long- and short-term resistance levels, and the wave count suggests that a bottom has been reached.
CHZ has been decreasing underneath a descending wedge since reaching an all-time high price of $0.94 in March 2021. The downward movement led to a low of $0.081 in May 2022.
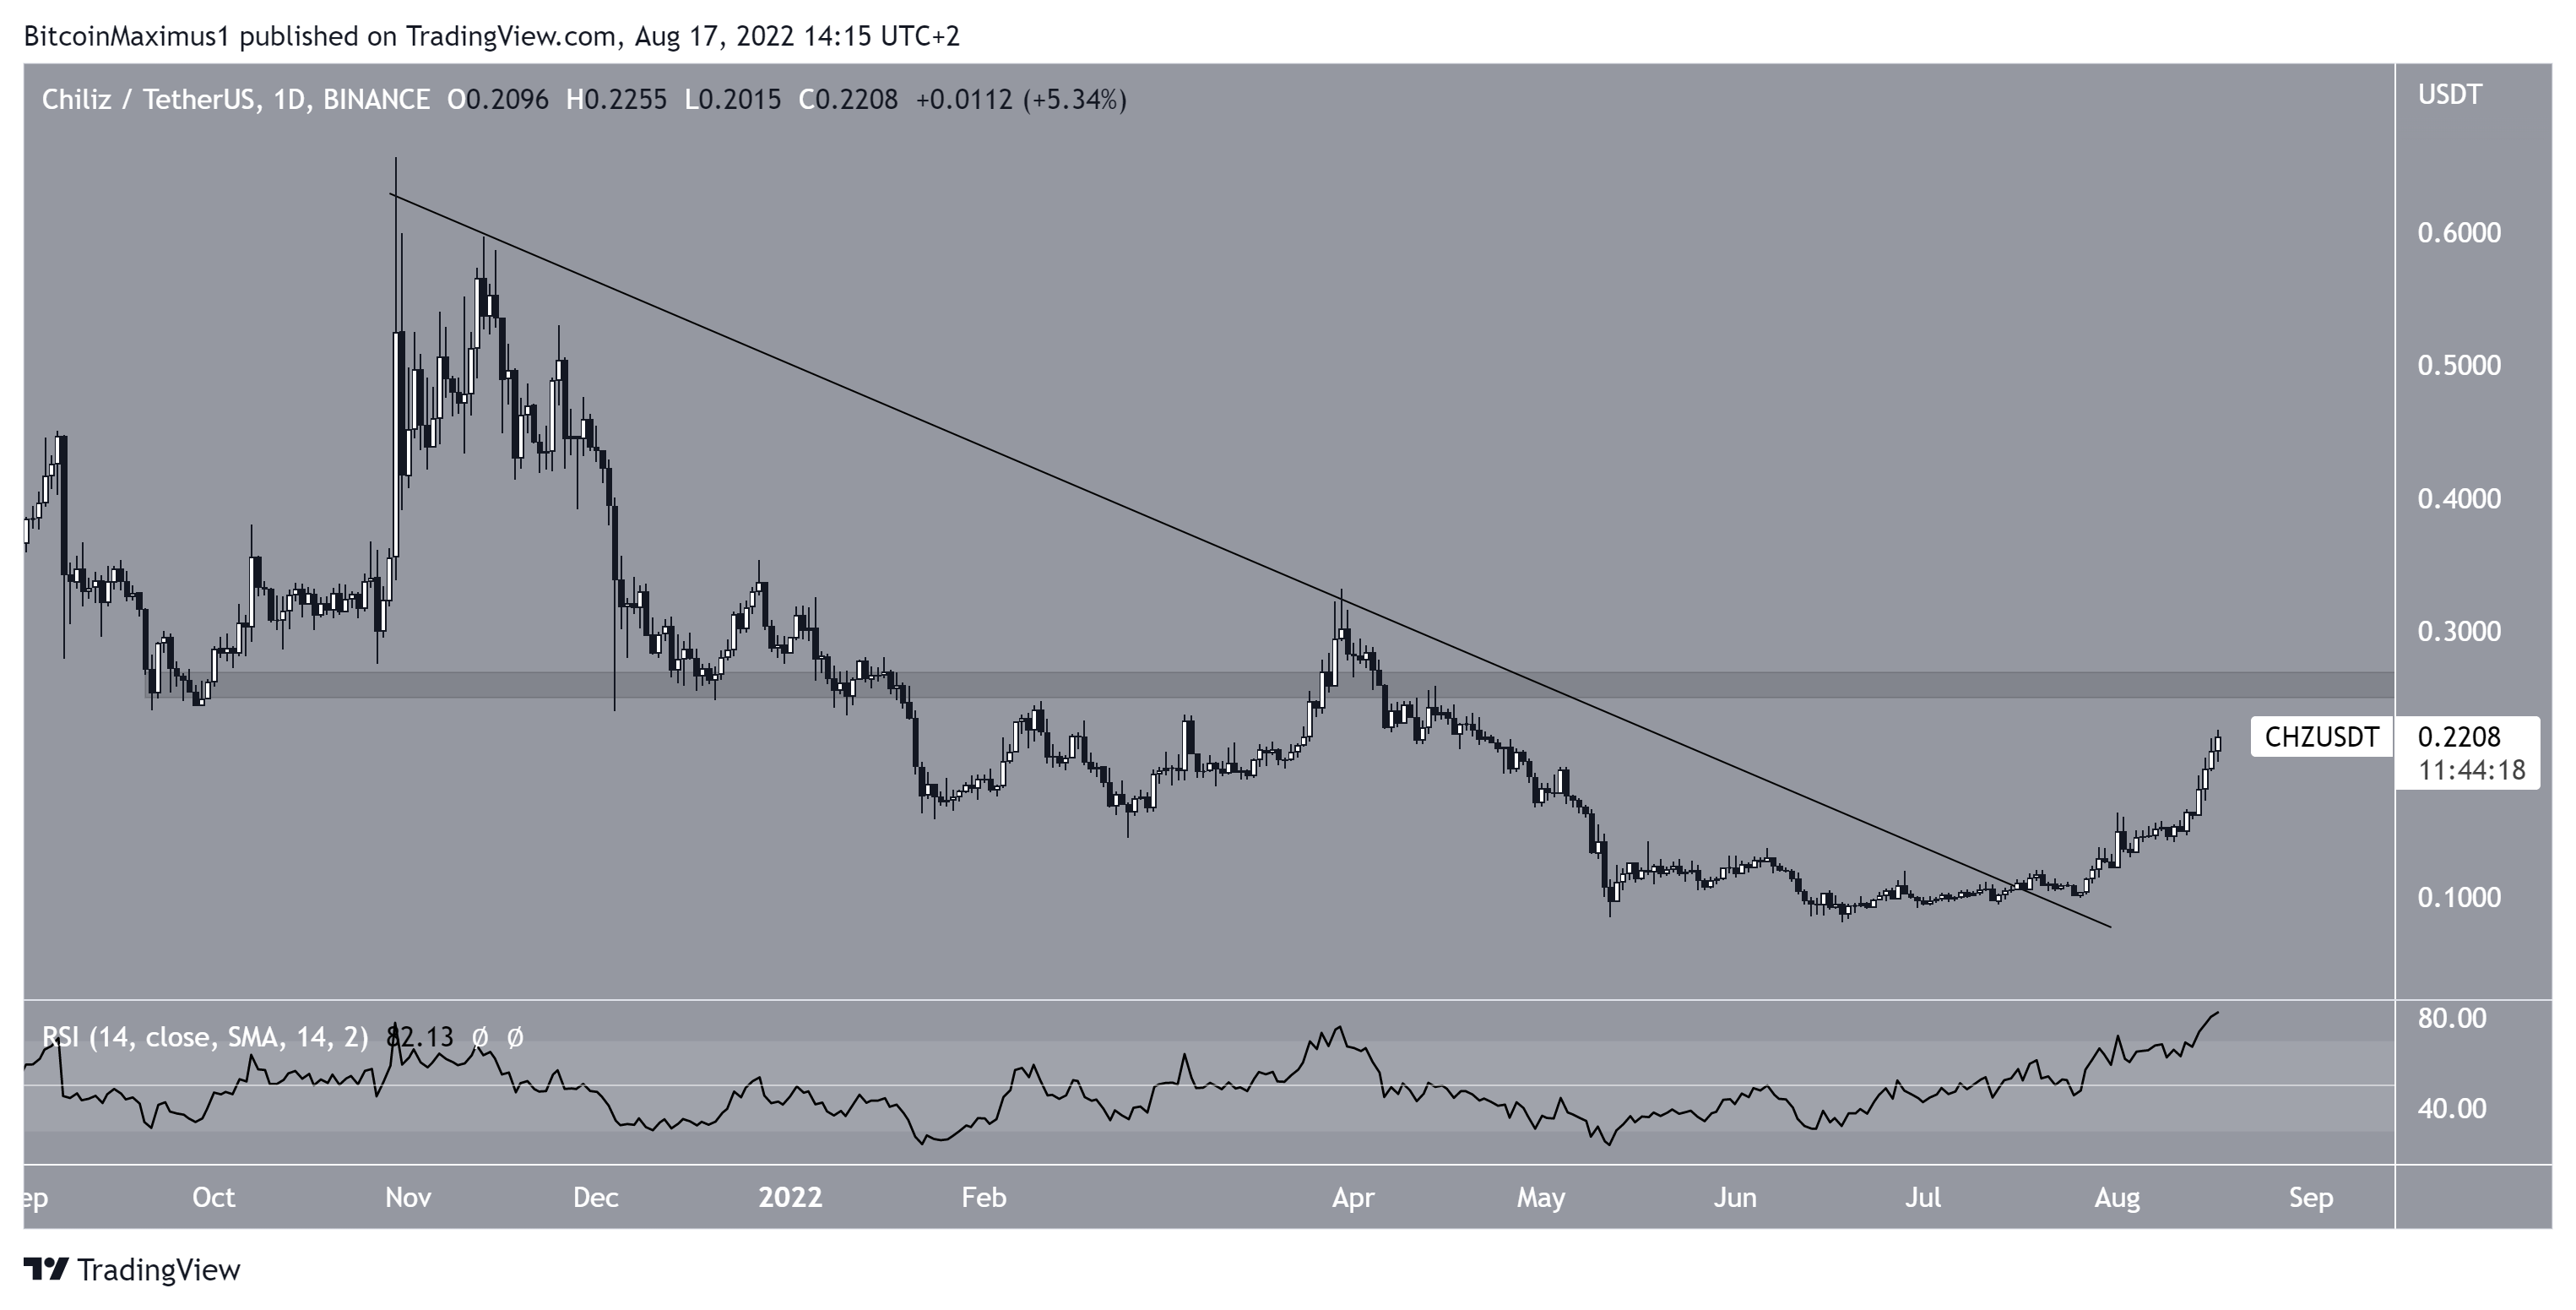
The descending wedge is considered a bullish pattern, meaning that the price breaks out from it the majority of the time. CHZ did break out on Aug. 1 and has so far reached a high of $0.225 on Aug. 17.
Moreover, the weekly RSI has broken out from its descending resistance line and moved above 50. This is considered a sign of a bullish trend, supporting the legitimacy of the breakout.
If the upward movement continues, the closest resistance would be at $0.41. This is the 0.382 Fib retracement resistance level.

CHZ breaks out
The daily chart supports the readings from the weekly one, since the price has broken out from a long-term descending resistance line, which had been in place since Oct. 2021.
Similarly to the weekly timeframe, the daily RSI has moved above 50, supporting the legitimacy of the breakout.
In the daily timeframe, the closest resistance area is at $0.26.
Wave count analysis
Technical analyst @footballelixir tweeted a chart of CHZ, stating that the price has begun a long-term wave five that will eventually take it towards a new all-time high.

The long-term count does suggest that CHZ has just completed wave four of a long-term five wave upward movement (black), which began in March 2020.
If correct, it has now begun wave five, which is expected to take the price to a new all-time high.
A decrease below the wave four low (red line) at $0.081 would invalidate this particular wave count.
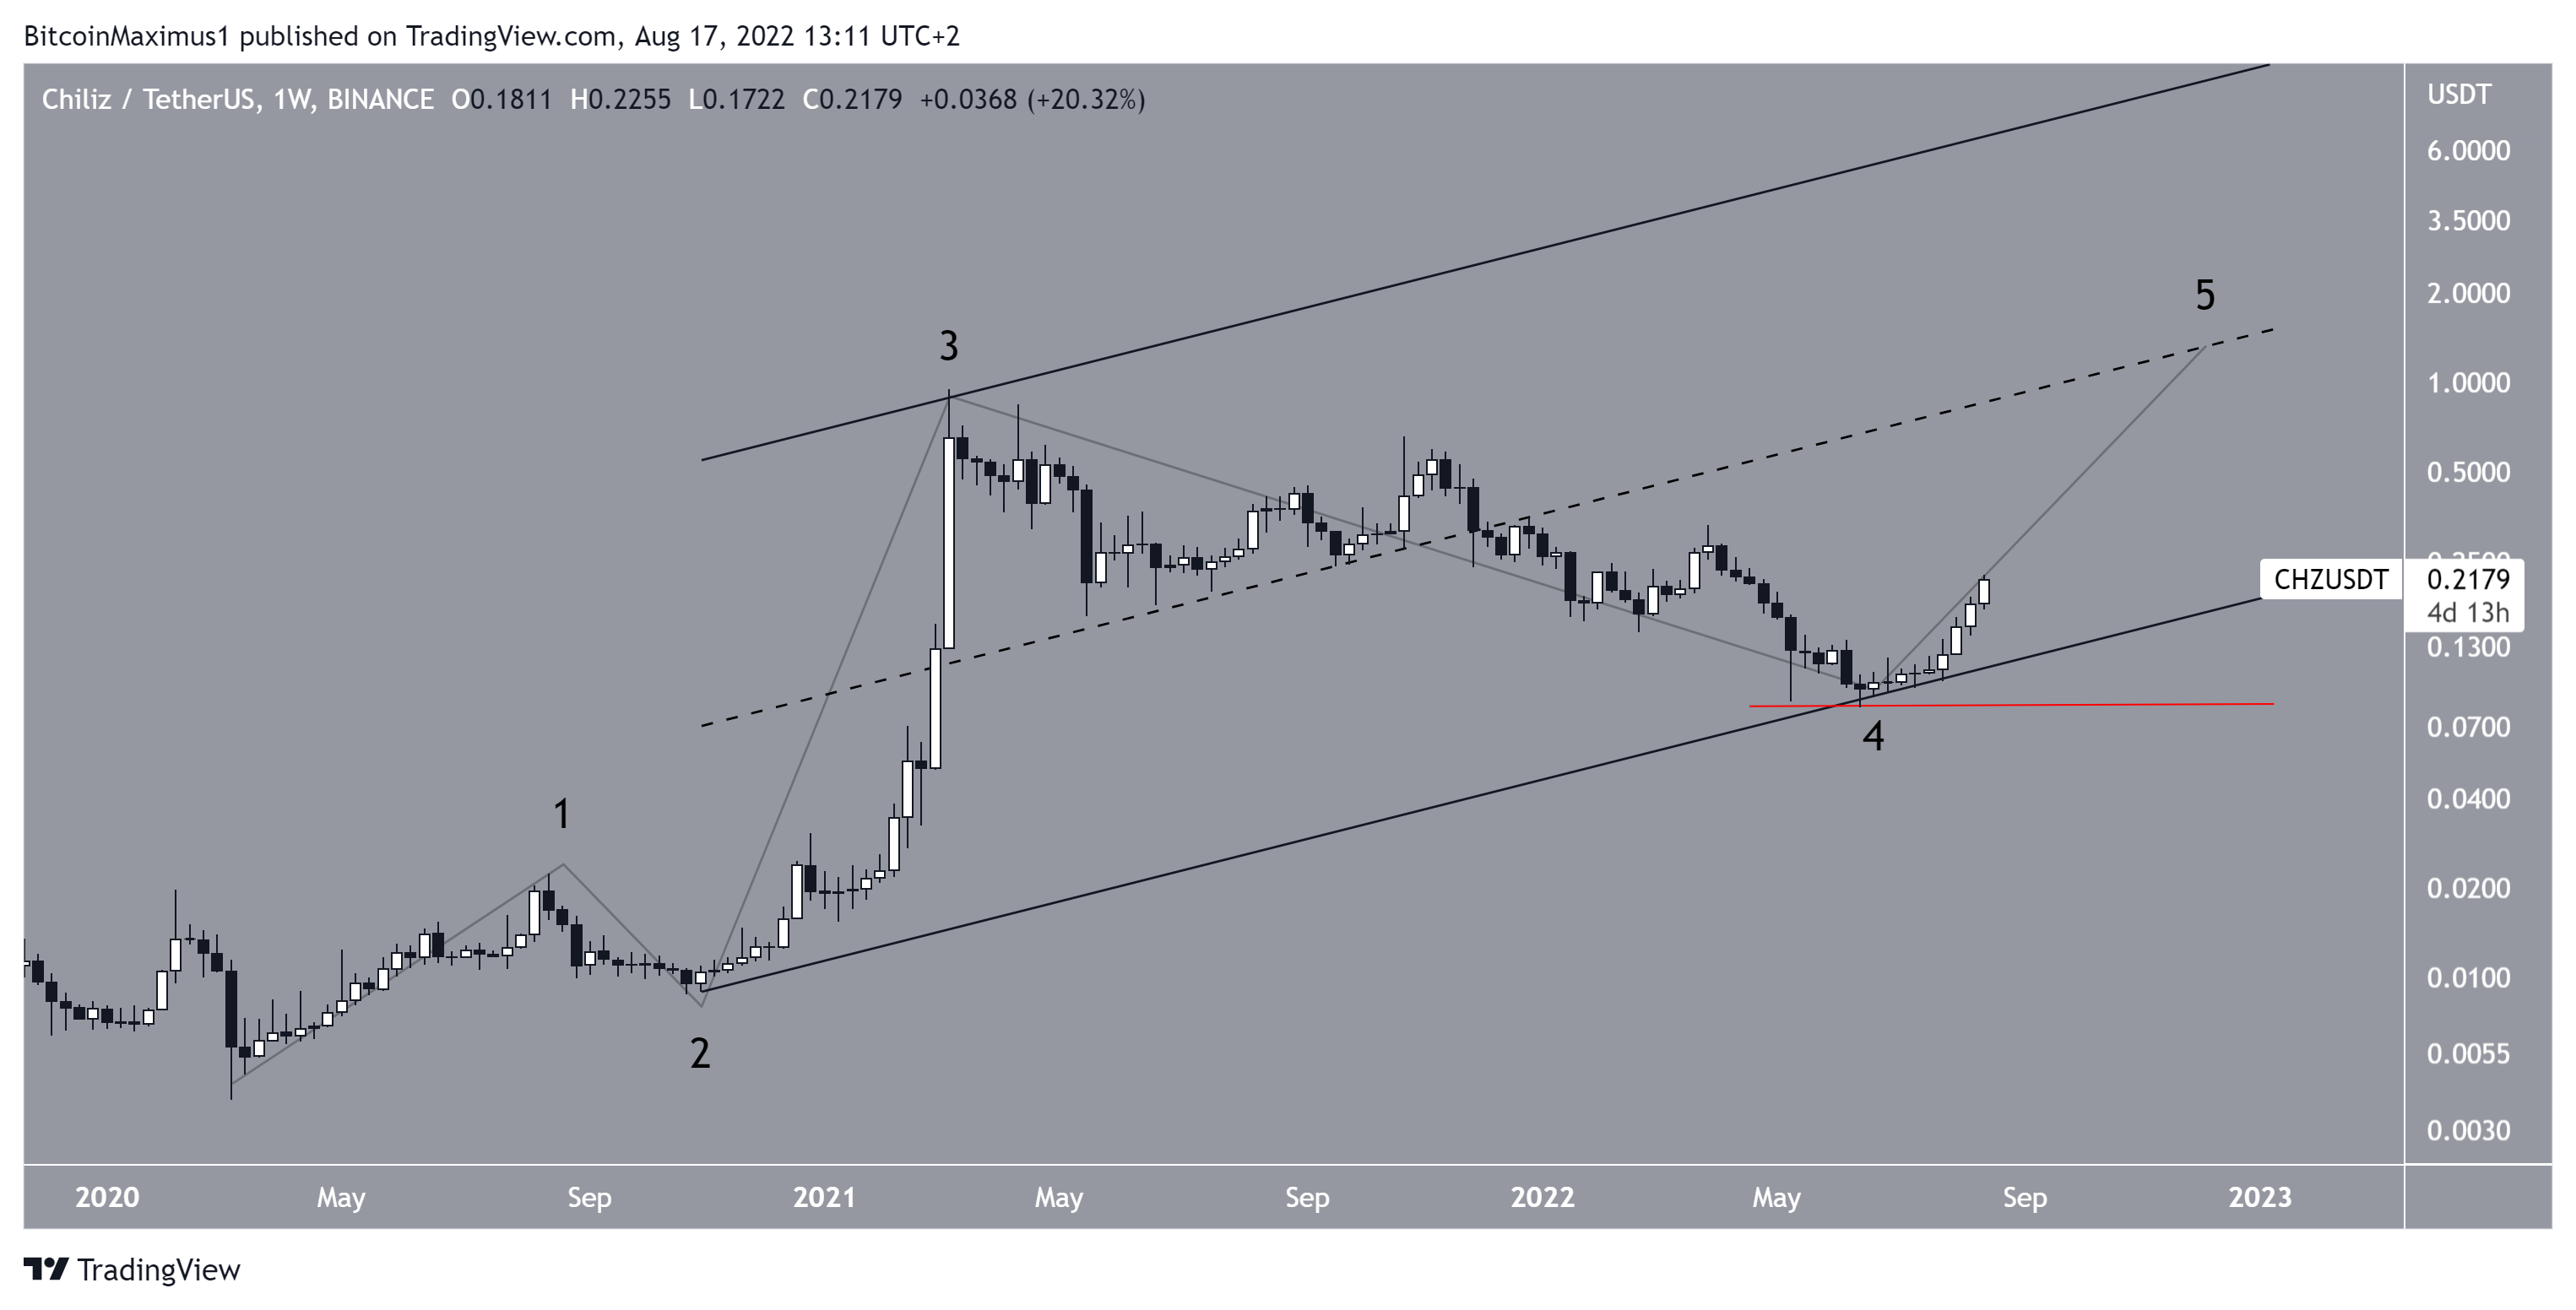
The short-term count suggests that the price has completed a short-term five wave upward movement, in which waves 1:5 had a 1:1 ratio. Since wave three was extended, it is possible that the entire upward movement has ended.
If so, CHZ has now begun a corrective A-B-C structure. The 0.5-0.618 Fib retracement support levels between $0.13 – $0.15 are likely to provide support and end the correction.

For Be[in]Crypto’s latest Bitcoin (BTC) analysis, click here
Disclaimer
In line with the Trust Project guidelines, this price analysis article is for informational purposes only and should not be considered financial or investment advice. BeInCrypto is committed to accurate, unbiased reporting, but market conditions are subject to change without notice. Always conduct your own research and consult with a professional before making any financial decisions. Please note that our Terms and Conditions, Privacy Policy, and Disclaimers have been updated.
