


The Chainlink (LINK) price saved a breakdown by bouncing on Feb. 1. An increase above the current pattern could accelerate the rate of increase toward $7.90 and possibly $9.48.
Most of the Chainlink news is related to dynamic non-fungible tokens (dNFTs), which are NFTs with encoded smart contract logic. Therefore, they can change their metadata based on external conditions. The Chainlink network aspires to be the primary provider of off-chain data and computation services, which will then be used to trigger dNFT updates.
The only piece of Chainlink news that does not involve dNFTs has to do with the Picardy Protocol, the winner of the Chainlink Spring 2022 Hackathon. The protocol announced that it is integrating Chainlink Automation on the Polygon mainnet. This is done to securely trigger payments of royalties to creators and royalty token holders.
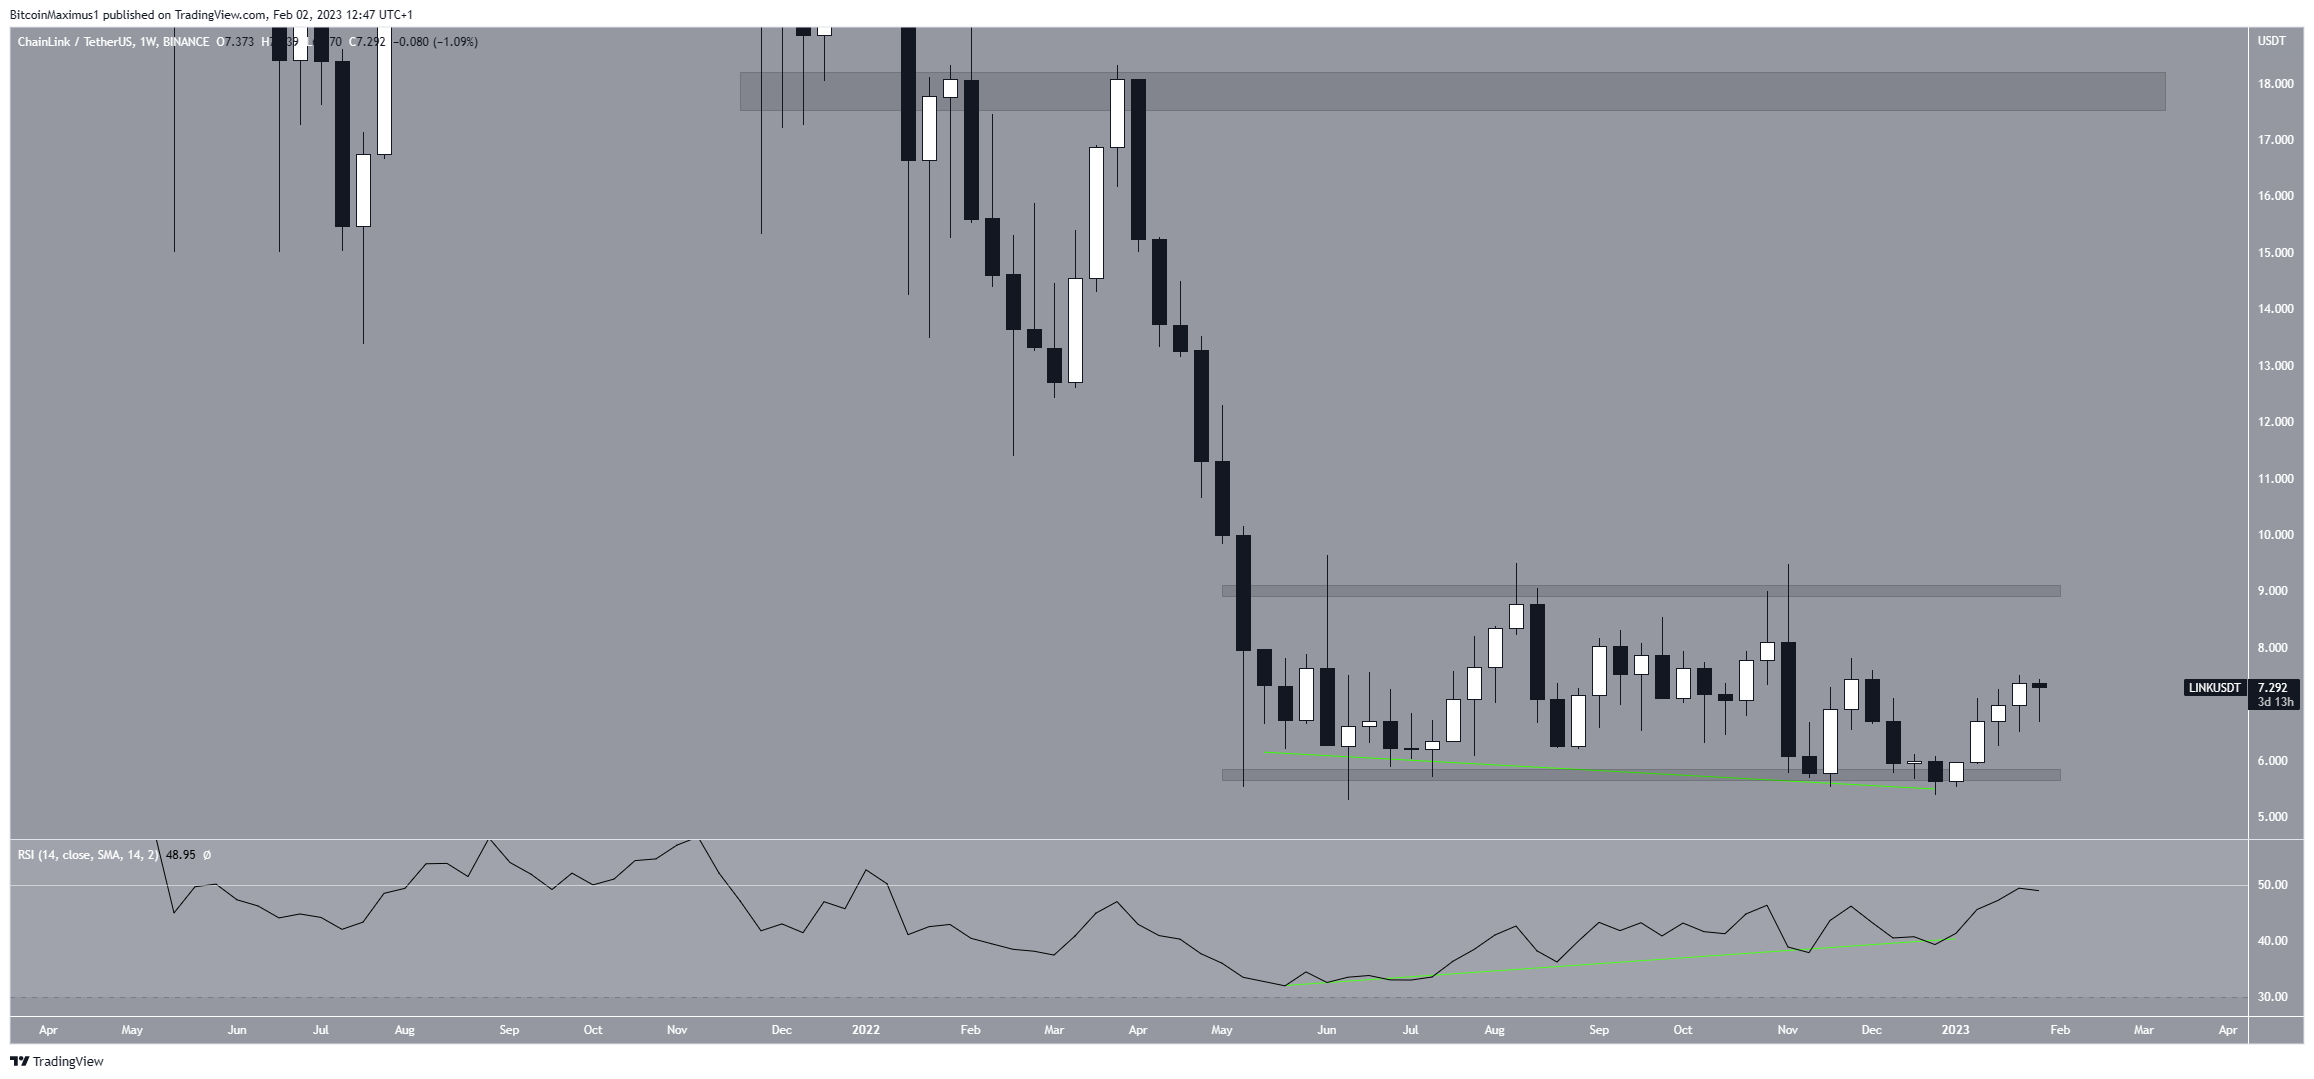
Chainlink Long-Term Reversal Underway
The Chainlink price has been trading above the $5.75 horizontal support area since May 2022. Despite reaching a low of $5.30, the LINK price managed to stay above the $5.75 support level in the weekly time frame, never closing below the area.
The weekly RSI generated bullish divergence (green line) throughout this time. Divergence in such a long-term time frame is uncommon. So, it frequently precedes significant bullish trend reversals.
If the upward trend continues, the next level of resistance would be at $9. Since May 2022, the price has not closed above this level. If this occurs, the increase rate may accelerate toward the next long-term resistance level at an average price of $18. On the other hand, a weekly close below $5.75 would indicate that the trend is still bearish.
In that case, the LINK token price may drop to $4. A breakout is more likely as a result of the bullish divergence.
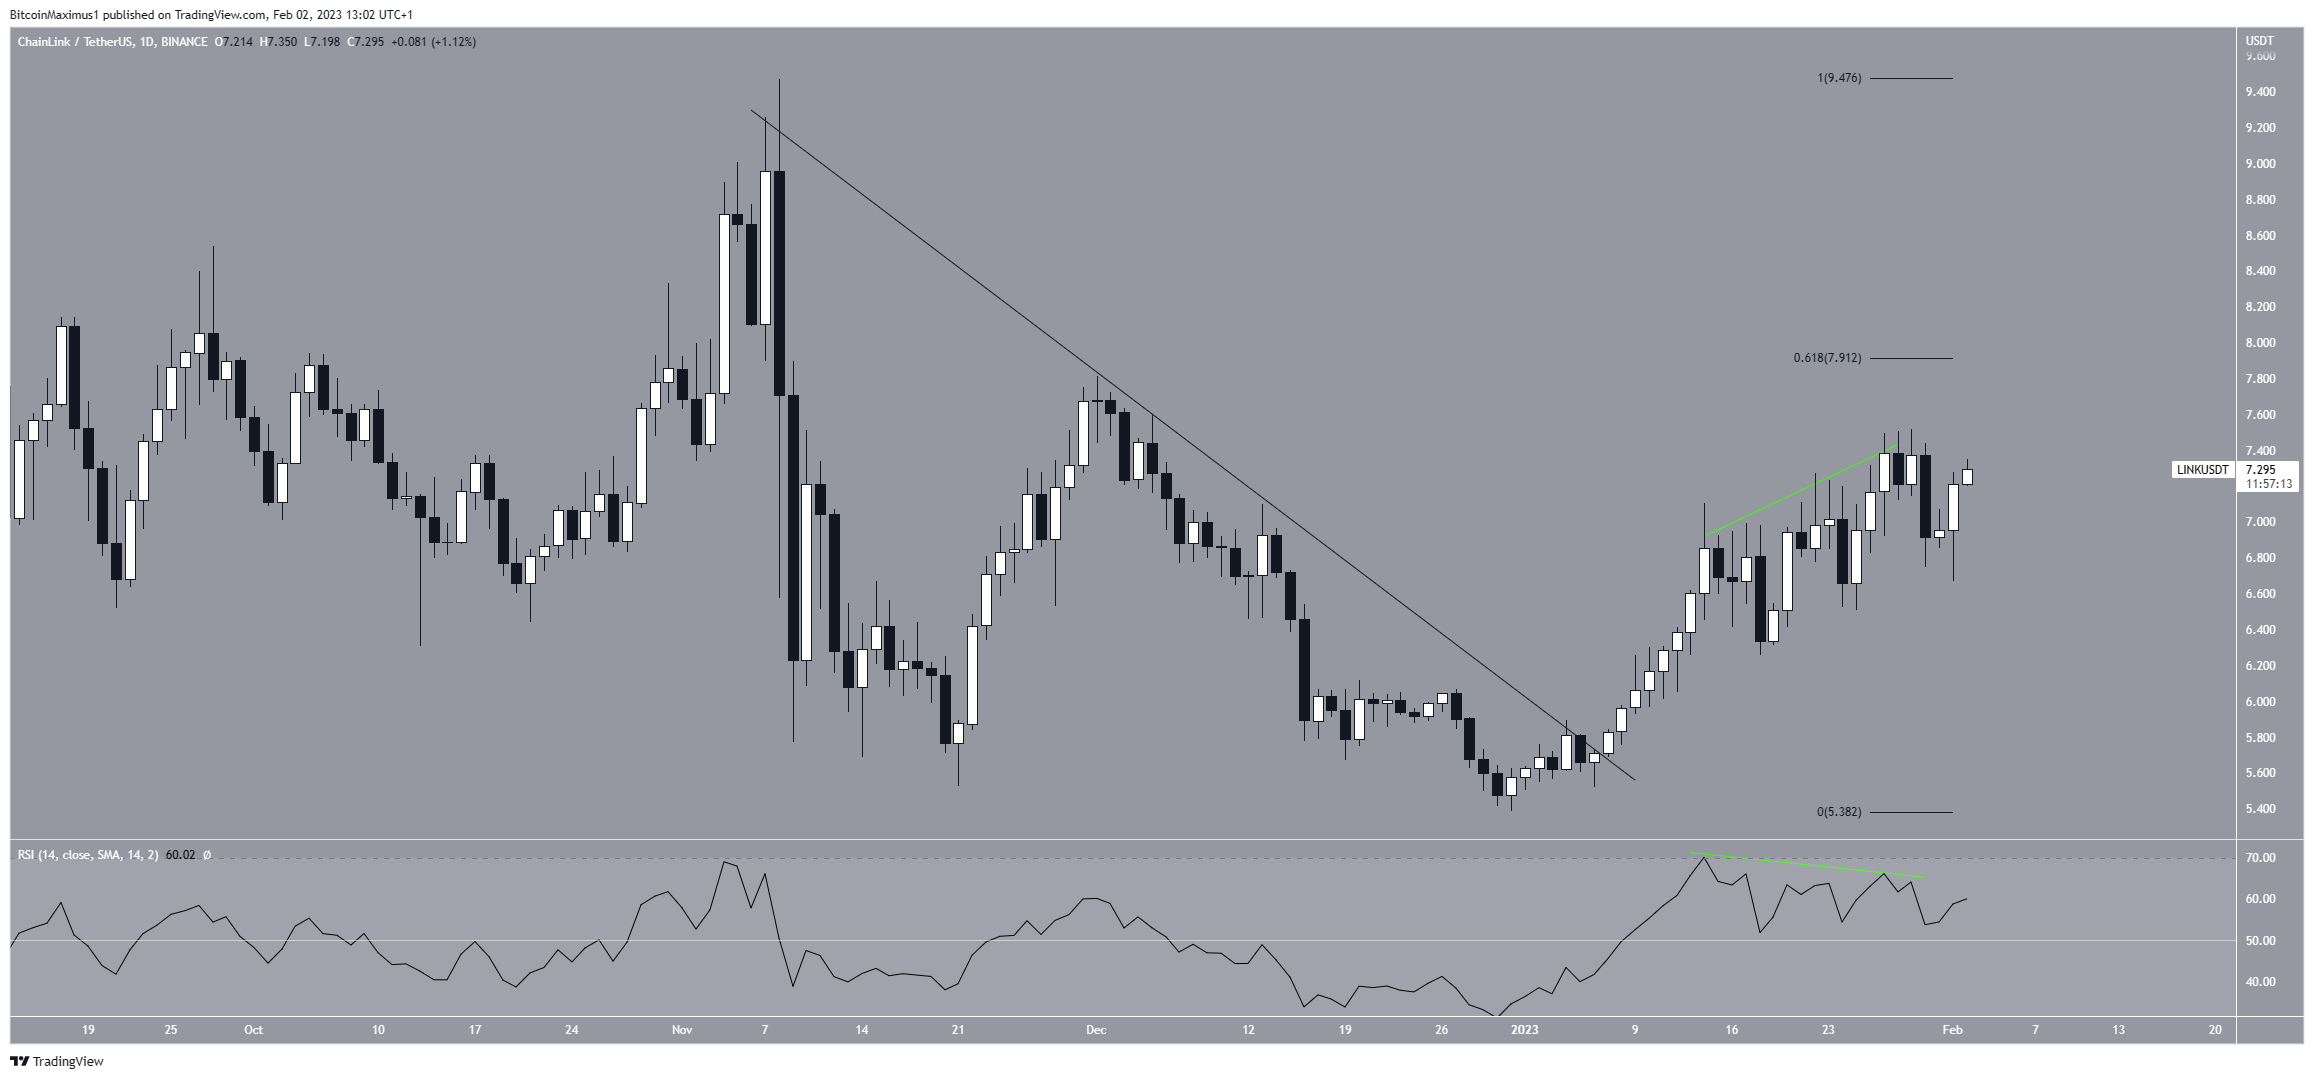
Chainlink Price Prediction for Feb: $8 Will Be Reached
The technical analysis from the daily chart shows that the Chainlink price broke out from a descending resistance line at the beginning of Jan. Afterward, it reached a high of $7.52 on Jan. 29.
While the daily RSI generated bearish divergence, a drop already occurred as a result of the divergence. Then, the trend reversed over the past 24 hours.
If the upward movement continues, the closest resistance area would be at $7.91, created by the 0.618 Fib retracement resistance level.
If the Chainlink price moves above this resistance, it could accelerate its rate of increase toward $9.48.
The wave count also supports the bullish Chainlink price prediction for February. The most likely count suggests that the LINK price completed a five-wave upward movement since the beginning of Jan. Afterward, it also completed an irregular, flat A-B-C corrective structure (black).
The movement above the channel’s midline (green icon) supports this possibility. A breakout from the channel would confirm the count and accelerate the increase toward $7.90 and likely $9.48. On the other hand, the bullish Chainlink price forecast would be invalidated by a breakdown from the channel. In that case, the LINK price could fall toward $6.40.
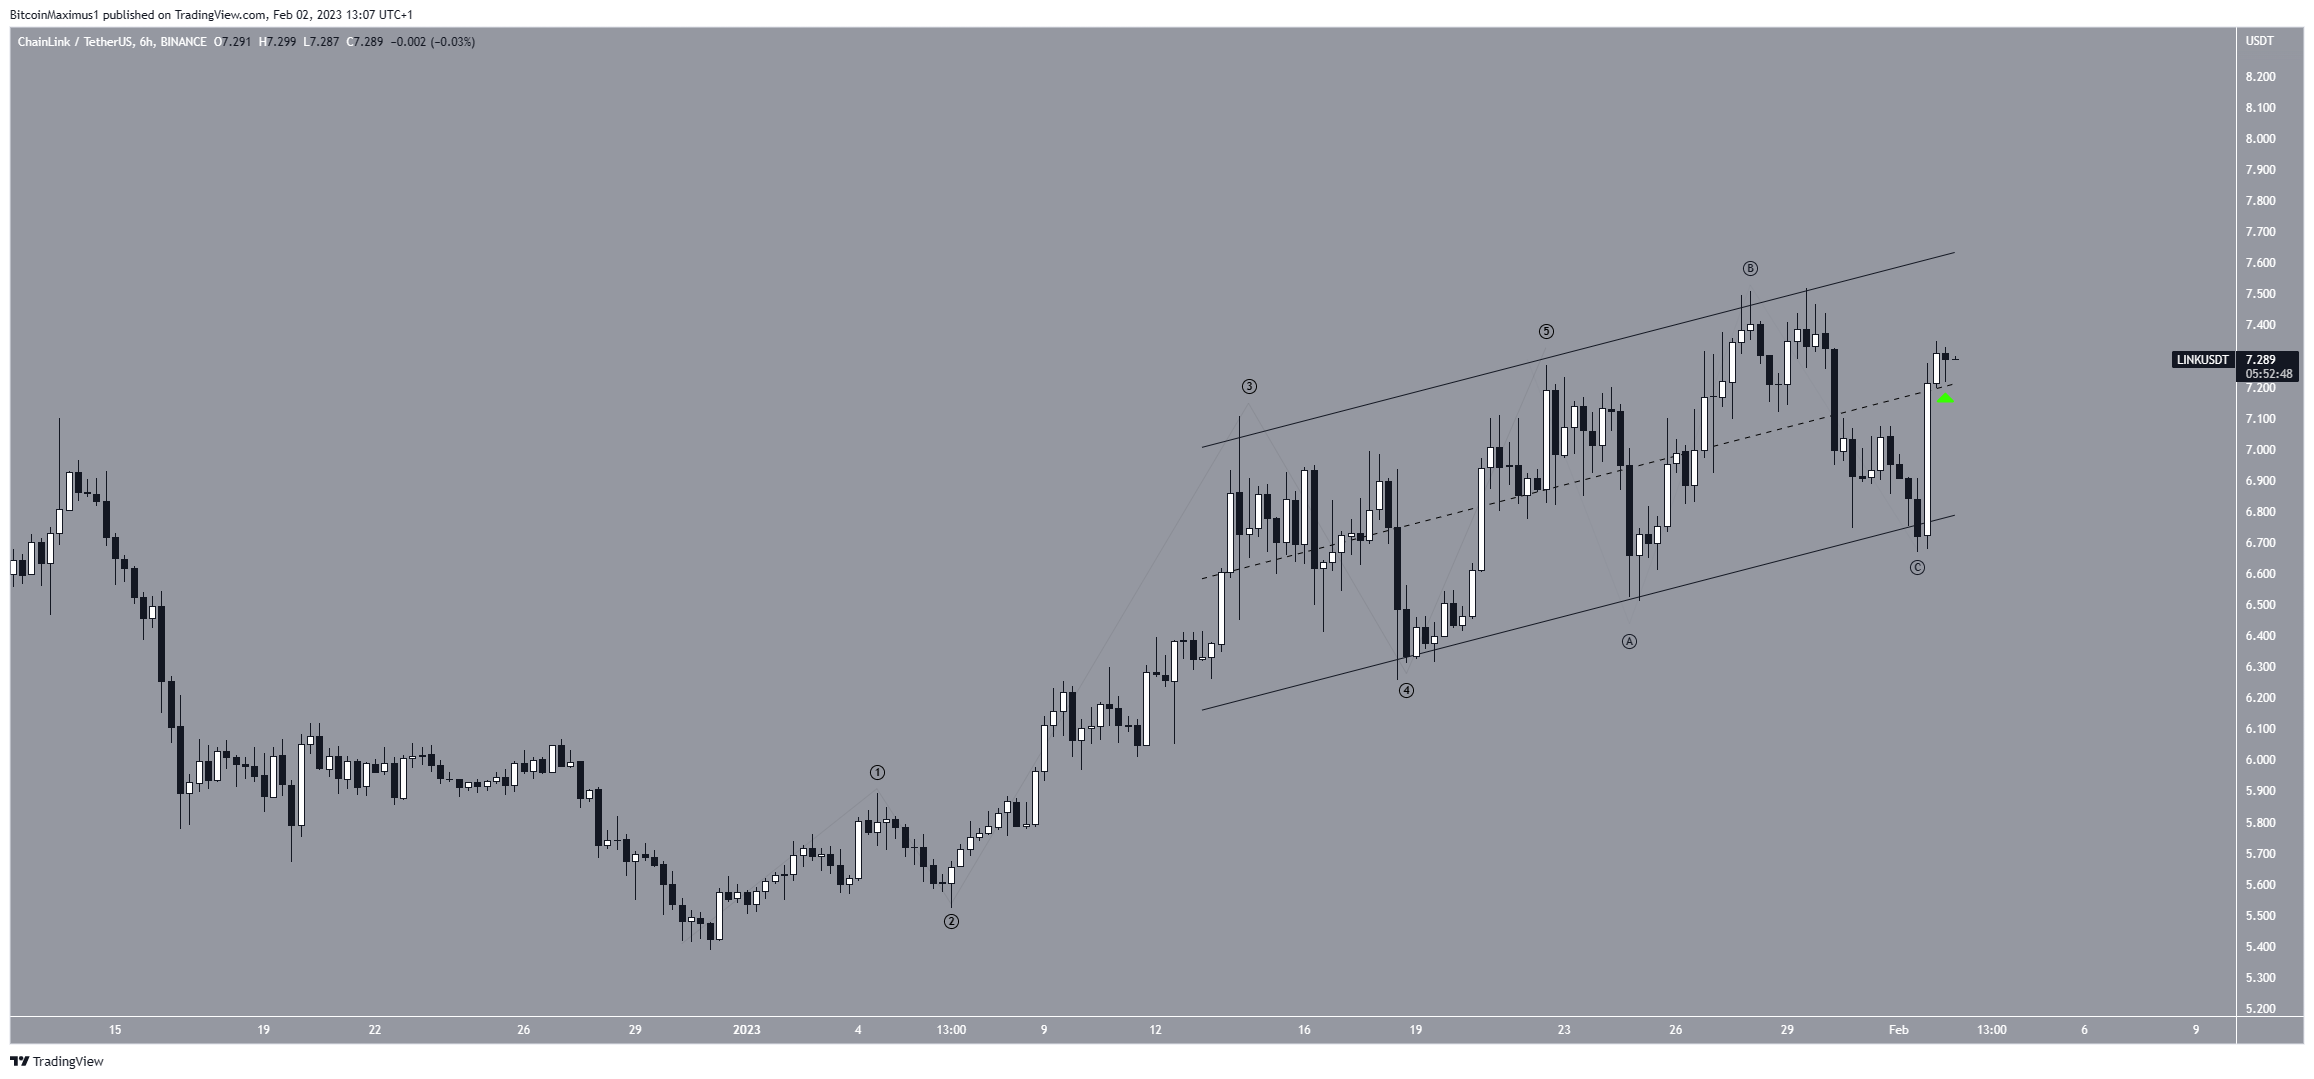
To conclude, the Chainlink price prediction for Feb. is bullish. A breakout from the channel and an increase toward $7.90 and possibly $9.48 are expected. Positive LINK news could act as fuel for the rally. On the other hand, a breakdown from the current channel would invalidate this forecast and lead to a drop toward $6.40.
For BeInCrypto’s latest crypto market analysis, click here.


