


As Chainlink (LINK) wobbles around the $13 to $14 region, traders will seek hidden insights into the potential price movement. As expected, recent events have forced market participants to adopt a more cautious approach.
However, the upswing in the last 24 hours, which caused LINK’s price to increase by 7.72%, may change the broader perception. With a potential price increase on the cards, here’s what on-chain data tells about the possible impact.
Chainlink Traders Need to Watch Out
BeInCrypto analyzes Chainlink’s Liquidation Map to understand the likely effect of a further uptrend on LINK traders.
- Liquidation Map: This map examines previous price trends to identify potential levels with liquidation risks.
At press time, LINK trades at $13.94, a 6.93% increase in 24 hours. With rising volume, the cryptocurrency’s value may head toward $15.
According to Coinglass, if Chainlink’s price hits $15.62, the Cumulative Short Liquidation Leverage is $12.56 million. In non-technical terms, traders who have placed bets on a LINK’s price decrease with insufficient margin balance will lose money should the prediction come to pass.
Read More: What Is Chainlink (LINK)?
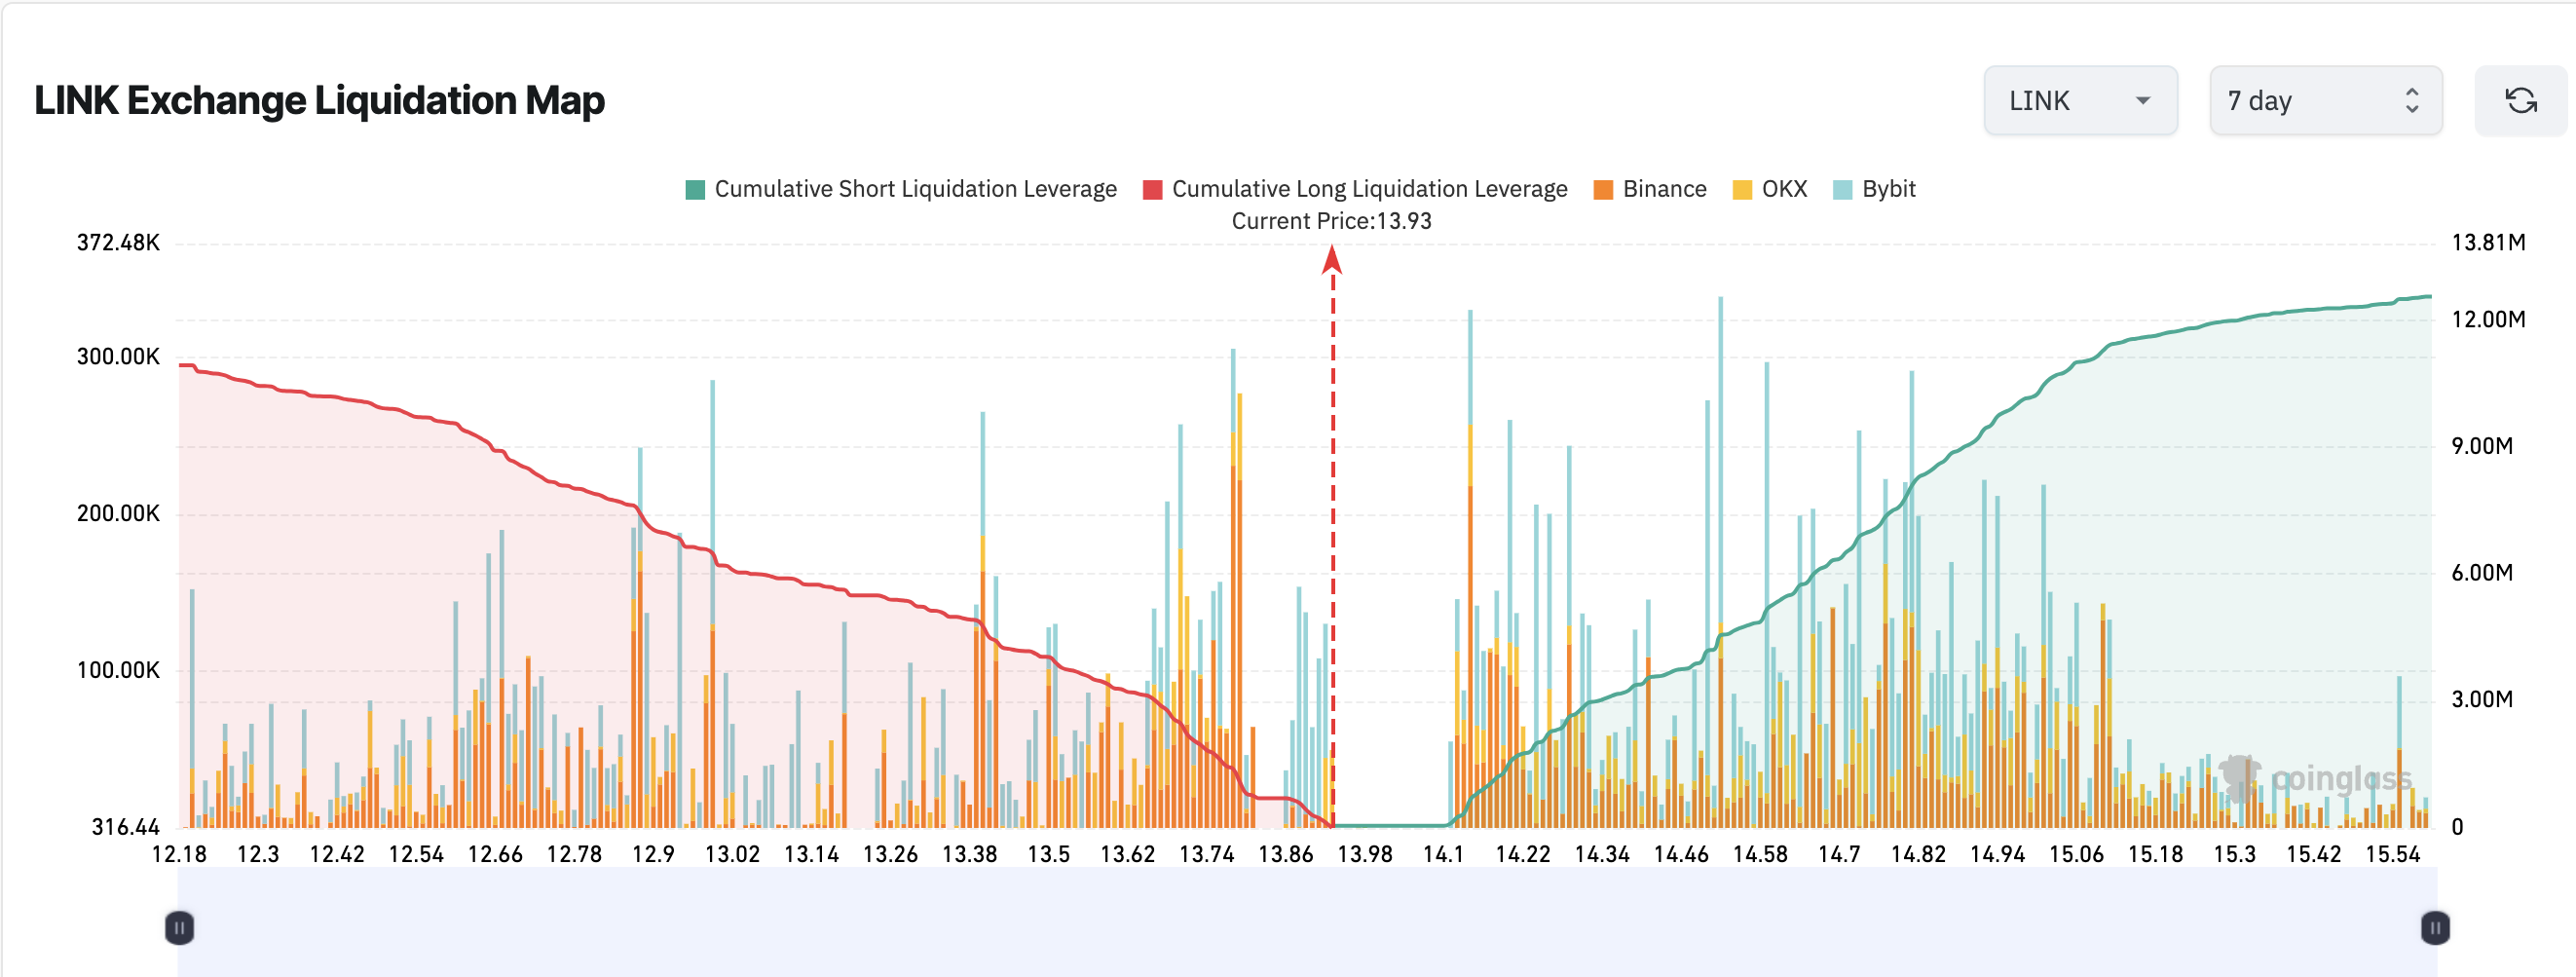
In contrast, positions valued at $10.99 million will be liquidated if LINK drops to $12.18. However, data from IntoTheBlock reveals that a plunge to the $12 region looks unlikely, as evident from the Bulls and Bears indicator.
- Bulls and Bears indicator: This indicator measures the number of addresses that bought or sold more than 1% of the total trading volume. Those who bought more than 1% are called bulls, while those selling are tagged as bears.
Furthermore, there were more bears than bulls in the last seven days. This is one reason LINK slipped to $12.91 on June 24.
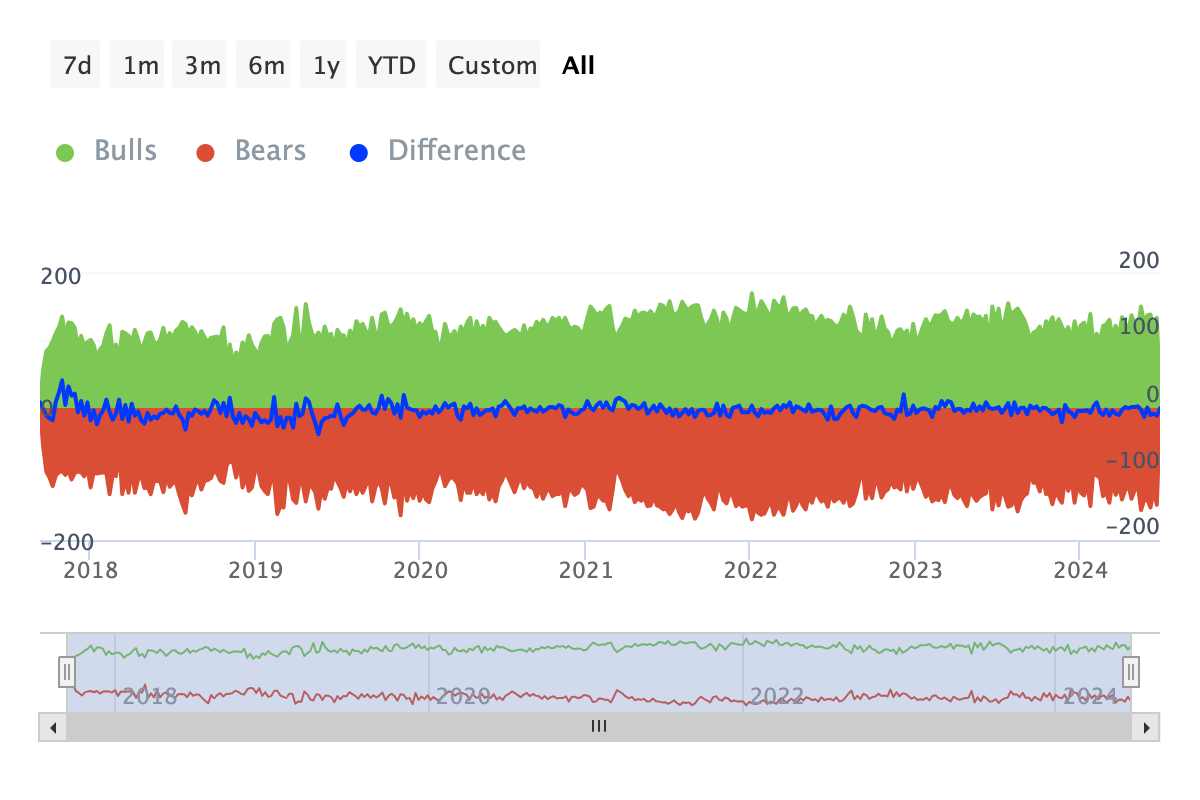
But as of this writing, bulls have taken over. Should they sustain this momentum, LINK may resist downward pressure and trade higher.
LINK Price Prediction: Higher Values Likely
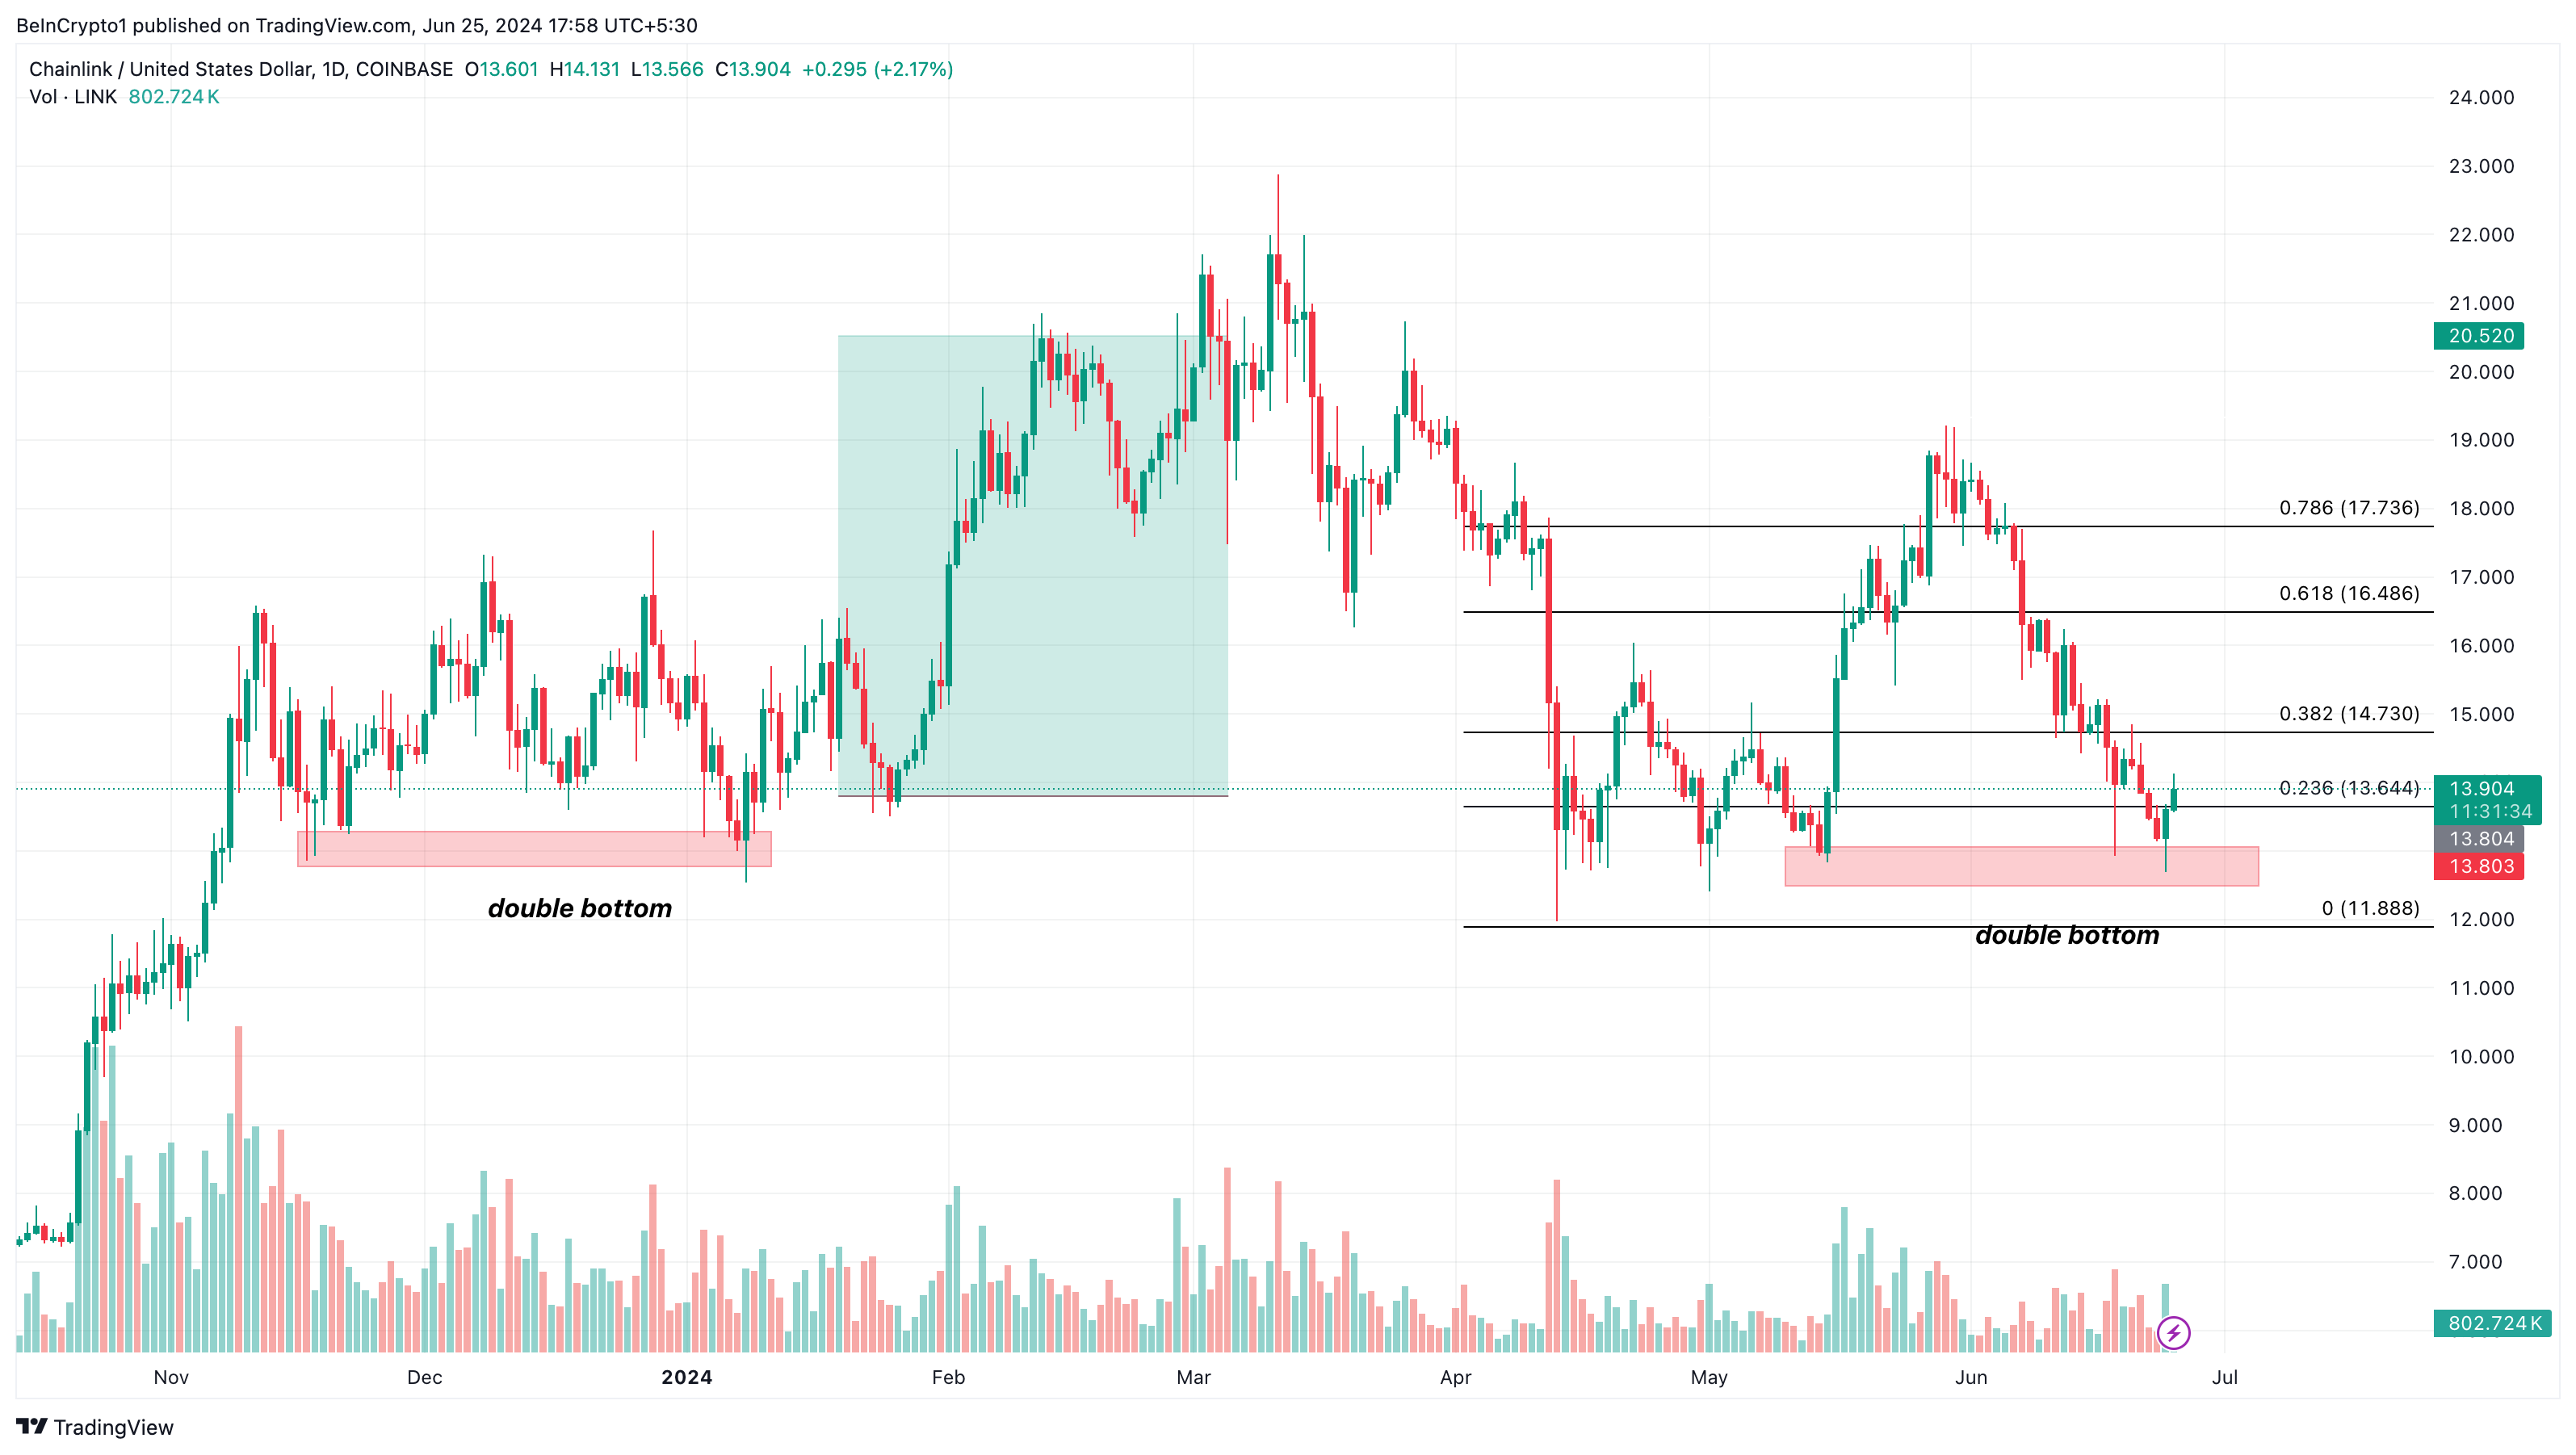
From a technical point of view, we observed that LINK formed a double-bottom pattern. The double-bottom pattern often indicates a reversal and, in many cases, the start of a potential uptrend.
It happens when the price touches a support level twice, indicating a pause in the asset’s downtrend. On the daily chart, LINK formed a similar pattern between November 2023 and January 10 this year.
Between January 26 and February 13, LINK’s price rallied from $13.82 to $20.50. Based on this historical performance, the cryptocurrency’s value may start an uptrend, taking it to $14.73 within the next few days. If validated, the price of LINK can rise to $17.73 in some weeks.
Meanwhile, the Relative Strength Index (RSI) which measures momentum, is recovering from its oversold condition.
When the RSI reading is 30 or below, it means that an asset is oversold. Readings at 70 or above indicate overbought conditions. As of this writing, the RSI is at 39.63, suggesting that the potential rise to $15 has not yet been validated.
Read More: Chainlink (LINK) Price Prediction 2024/2025/2030
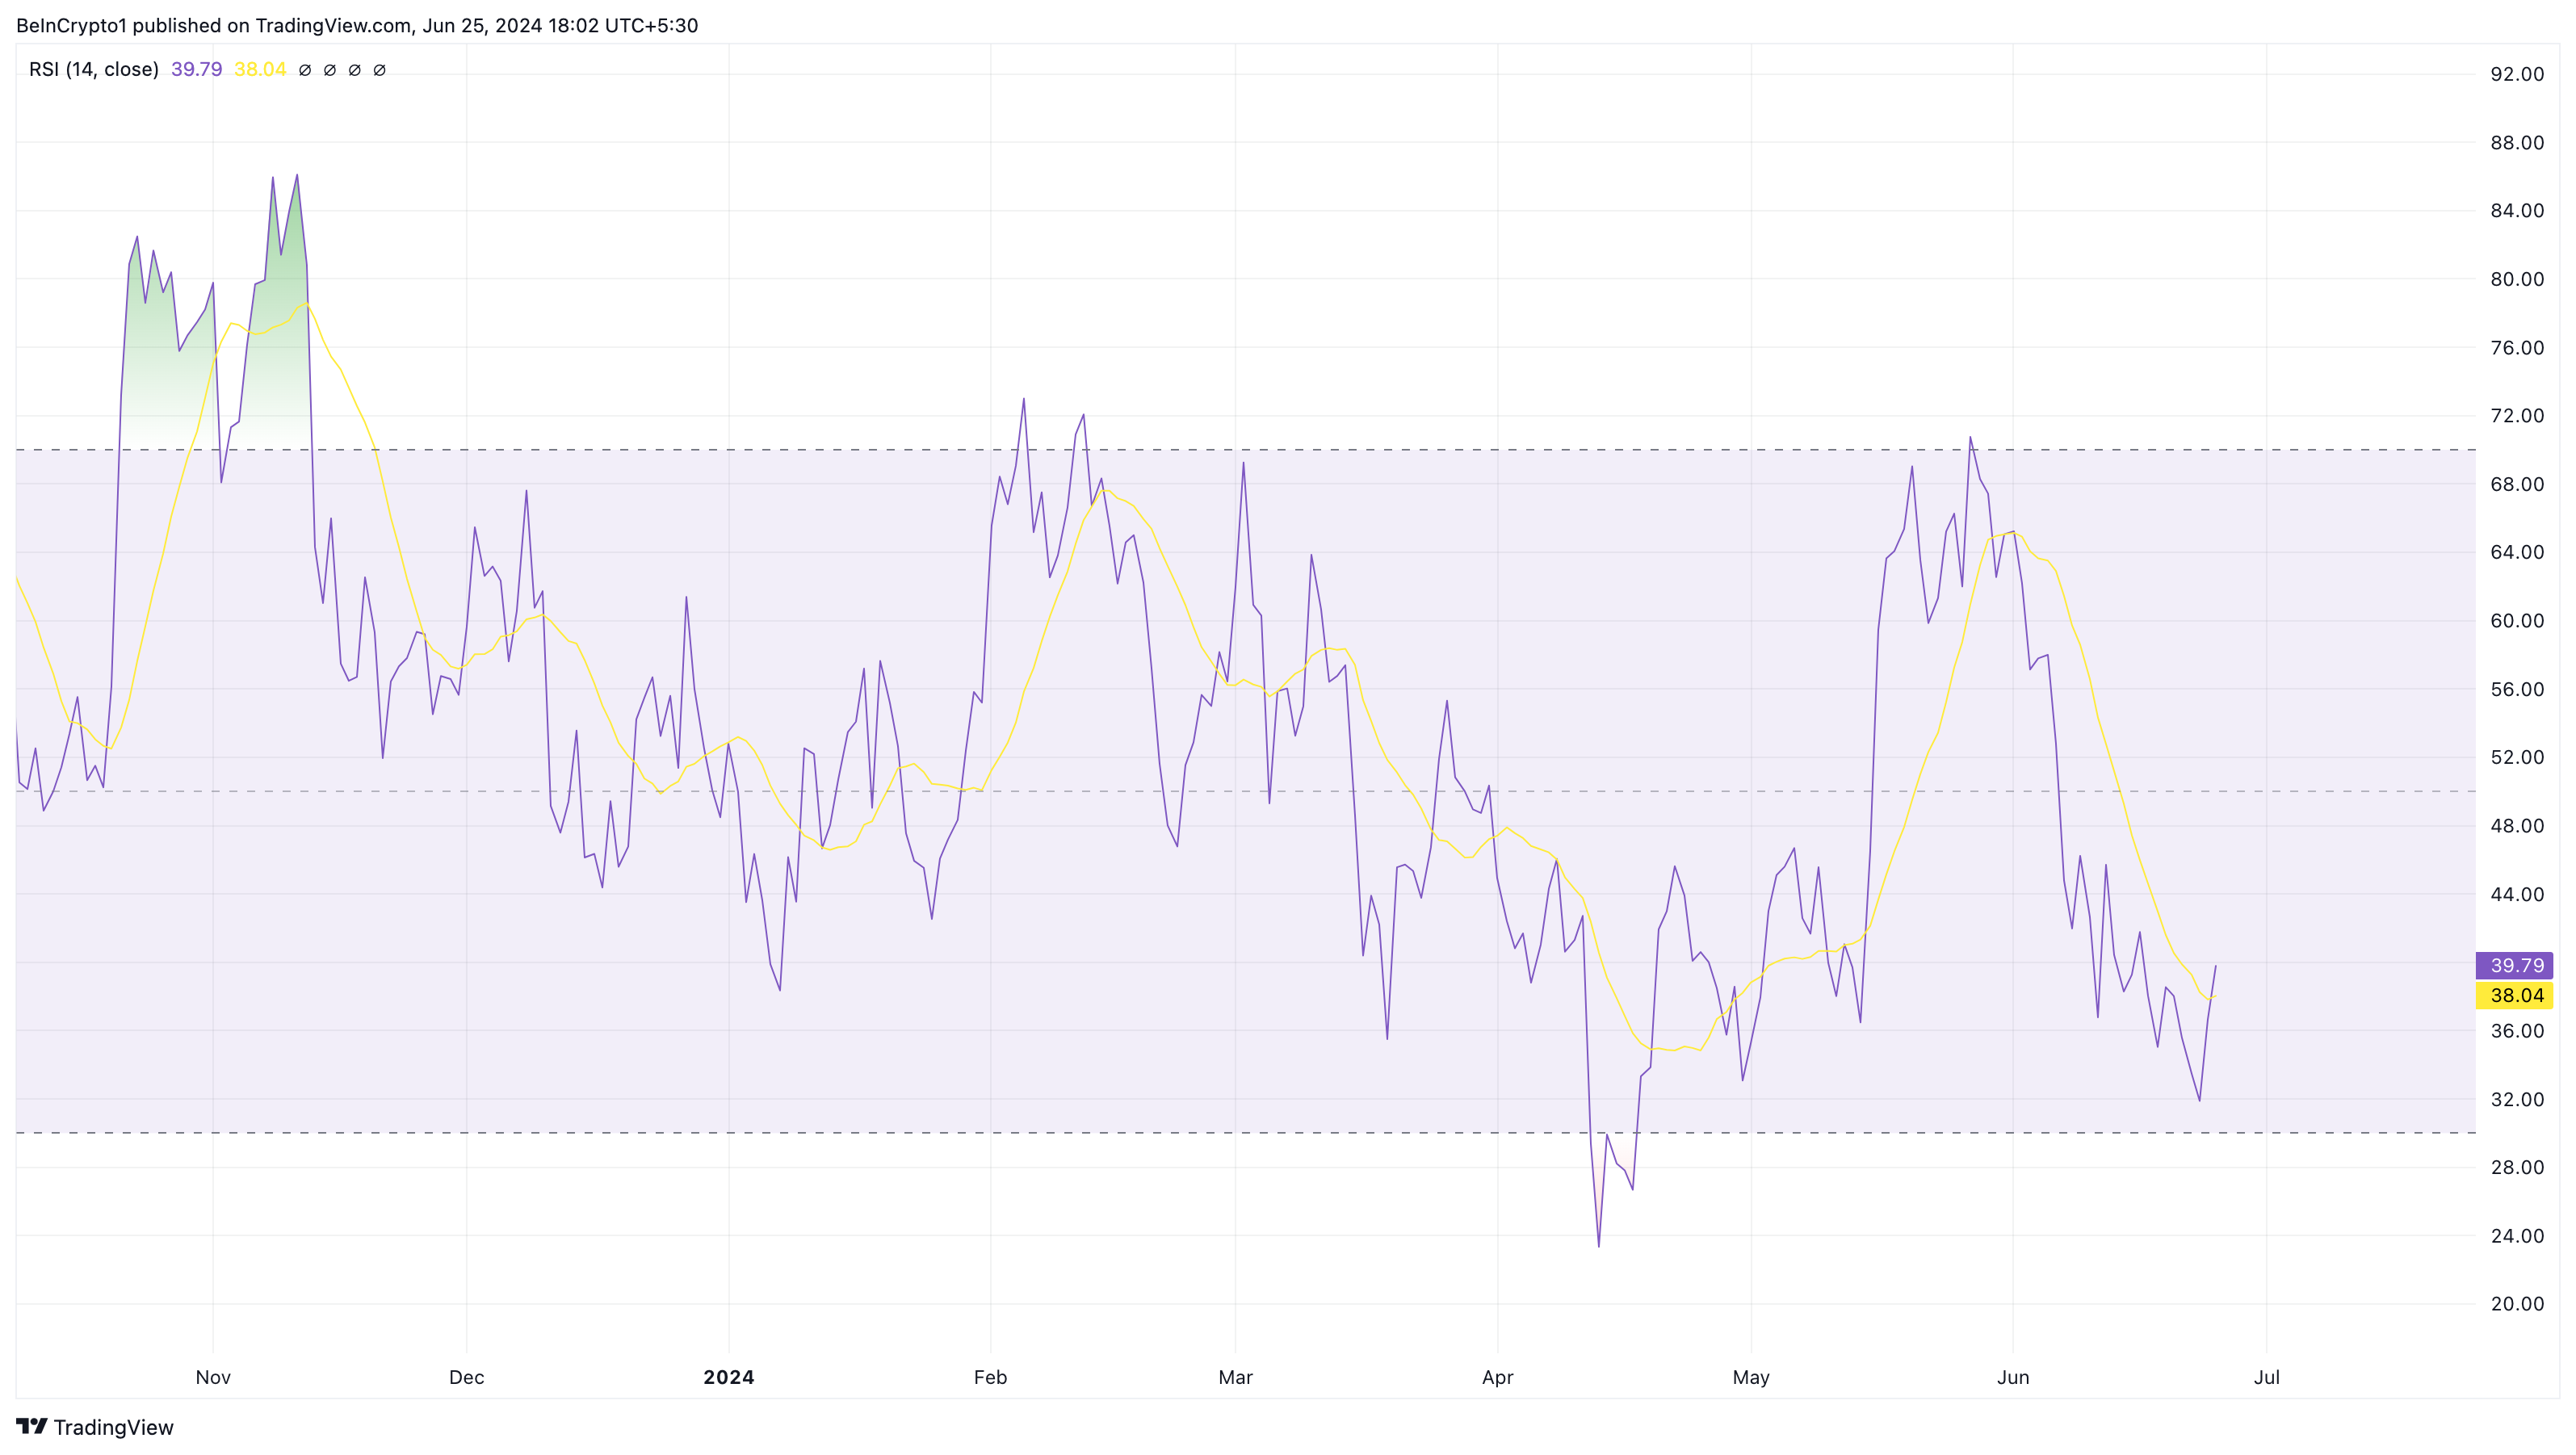
However, if the reading crosses the 50.00 neutral zone, LINK can reach the price mentioned above or trade higher. But the prediction will be invalidated if the momentum succumbs to bearish forces.
Bitcoin (BTC) is another factor that can hinder the uptrend. A few days ago, the coin faced selling pressure, which drew the wider market down.
As of this writing, Arkham Intelligence reveals that the German government is moving another round of BTC to exchanges. Should these sell-offs continue, prices of altcoins, including LINK, may stop increasing, and the next move for the token may be below $12.80.


